 Summary
- This VISA stock analysis is based on Q1 results and outlook for the remainder of fiscal 2017 which were released February 2, 2017.
- Visa reported reasonably solid results for Q1 2017 on February 2, 2017.
- While I would be prepared to buy shares at $82, we already have a full position. I will, therefore, patiently wait until V drops to $75.
- The use of options could provide you with an opportunity to earn some premium while you wait for V to reach a more attractive level.
Introduction
I recently covered VISA Inc. (NYSE: V) in my VISA Inc. (NYSE: V) – I will NEVER sell this holding post. I also recently covered Mastercard (NYSE: MA) in my MasterCard – Expensive But Worth The Price post. This post will, therefore, cover Q1 2017 results and the outlook for the remainder of the current fiscal year.
Before we go any further, some readers have raised concerns about bitcoin/blockchain ultimately putting V and MA out of business. I suggest you read my VISA and the potential impact of Bitcoin and Blockchain technologies.
Other readers have raised concerns about the massive lawsuits V and MA are facing. I would be foolish to think the magnitude of any penalties these companies end up paying is immaterial. Will they, however, put V and MA out of business? No. The intent of these punitive penalties is not to put these two companies out of business. Anybody with an ounce of common sense can put 2 and 2 together and realize the ramifications are staggering if consumers, businesses, and governments are no longer able to use credit cards to rent a car, purchase an airline ticket, buy gas, etc..
Q1 2017 Financial Results and Q1 events
Full details can be found in V’s February 2, 2017 Earnings release. Highlights are provided below.
- Cross-border volume growth, on a constant dollar basis, was 140%.
- Total processed transactions, which represent transactions processed by V, were 27.3B. This is a 44% increase over the prior year.
- Service revenues were $1.9B, a 17% increase over the prior year. This form of revenue is recognized based on payments volume in the prior quarter; all other revenue categories are recognized based on current quarter activity.
- Data processing revenues rose 28% over the prior year to $1.9B.
- International transaction revenues grew 44% over the prior year to $1.5B.
- Other revenues were $0.203B, an increase of 2% over the prior year.
- GAAP net income of $2.1B or $0.86 per share, an increase of 7% and 7%, respectively.
- Adjusted net income and EPS growth of 23% and 23%, respectively.
- Net operating revenue of $4.5B, an increase of 25%.
Payments volume growth, on a constant dollar basis, for the 3 months ended September 30, 2016, on which Q1 2017 service revenue is recognized, was 47% over the prior year at $1.9T.
Payments volume growth for the 3 months ended December 31, 2016, was 39% over the prior year at $1.8T.
Effective with the 3 months ended December 31, 2016, Europe co-badge volume is no longer included in reported volume. Excluding Europe co-badge payments volume from the 3 months ended September 30, 2016, growth was 38.5% and flat compared to the 3 months ended December 31, 2016.
Co-badging (one card for all brands) has become applicable in Europe since June 2016. This term refers to the ability for customers to choose the preferred payment type since the European Commission’s Antitrust Regulation on Interchange Fees gives consumers the right to require their bank to co-badge their device with all other brands offered as compatible apps (for a wallet) or other card products offered by the bank (for a card). The bank can, however, refuse to offer the customer a given card product (e.g. a premium card).
You can find a very succinct Press Release here from the European Commission regarding the regulation that caps the interchange fees for the most widely-used cards and which imposes transparency obligations on banks and retailers to improve the functioning of the payment market for all cards.
This Press Release explains:
- What are interchange fees?
- What was the problem with interchange fees?
- What are they key benefits of the Interchange Fees Regulation?
- What are they key provisions of the Interchange Fees Regulation?
- How will the Commission measure the impact of the Regulation?
In December 2016, V issued $0.567B of commercial paper with a weighted-average interest rate of 0.79% and remaining maturities from 37 days to 66 days.
In Q1, V repurchased 22.3 million shares of class A common stock, at an average price of $79.77 per share, using $1.8B of cash on hand. At the end of Q1, V had $3.9B available for share repurchase under the current programs. FCF continues to be extremely strong and I see no reason why V should encounter any difficulty in repurchasing this remaining amount.
On January 31, 2017, V’s Board declared a quarterly cash dividend of $0.165/share payable on March 7, 2017, to all holders of record of V’s common and preferred stock as of February 17, 2017.
Outlook for Remainder of Fiscal 2017
V affirmed its financial outlook for the following GAAP metrics for fiscal full-year 2017:
- Client incentives as a % of gross revenues: 20.5% – 21.5%.
- Annual operating margin: Mid 60s.
- Effective tax rate: Low 30s.
V updated its financial outlook for the following GAAP metrics for fiscal full-year 2017:
- Annual net revenue growth: 16% – 18% range including 2 – 2.5 bps of negative foreign currency impact.
- Annual diluted class A common stock EPS growth: Low 30s on a GAAP nominal dollar basis and mid-teens on an adjusted, non-GAAP nominal dollar basis. Both include 2.5 – 3 bps of negative foreign currency impact.
- Visa Europe integration expenses of approximately $0.08B for FY2017.
- Annual adjusted diluted class A common stock EPS share growth is derived from adjusted full-year 2016 EPS results of $2.84.
Valuation
I draw your attention to the estimated EPS for FY2017 found below. Multiple analysts have estimated $3.28 – $3.29; let’s use $3.28 for argument’s sake. I like to buy at no more than a 20 PE but I know this is totally unrealistic for V. I would, therefore, be willing to stretch to a PE of 25. Using $3.28 and a PE of 25 I get a price of $82. V is trading a shade above this. As I compose this post, V closed at $82.30 February 2, 2017 but is up $2.80 to $85.10 after hours.
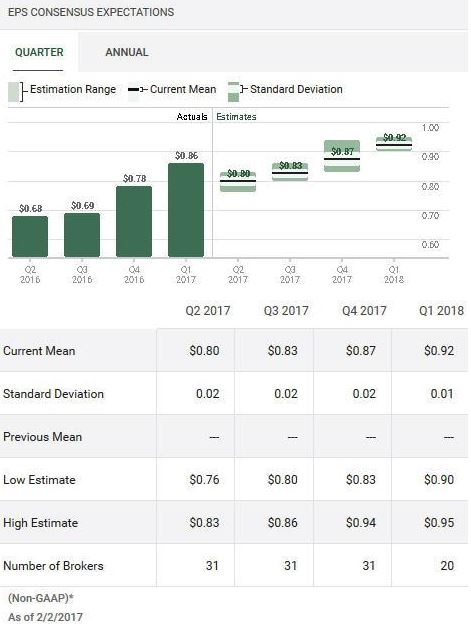
Source: TD WebBroker – V Quarterly EPS estimates
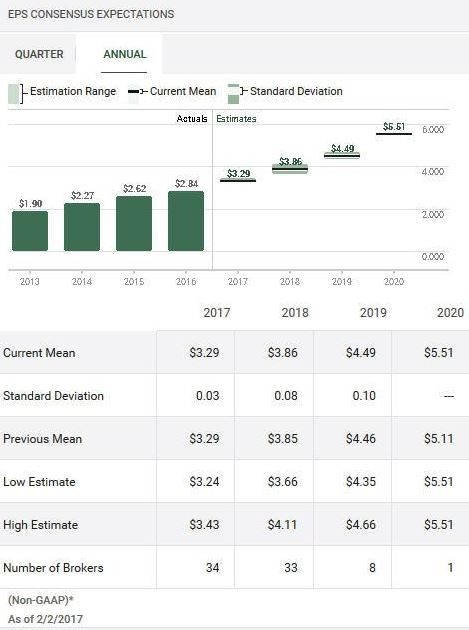
Source: TD WebBroker – V Annual EPS estimates
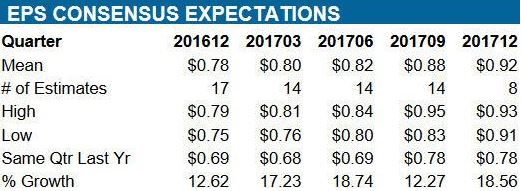
Source: ValuEngine – V Quarterly EPS estimates
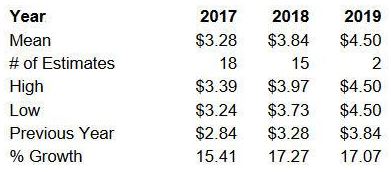
Source: ValuEngine – V Annual EPS estimates
When I wrote my VISA Stock Analysis – I Will NEVER Sell This Holding post in mid January 2017, V was trading just a shade below $82. As noted above, V has ticked up a bit since then.
If you understand options, you could sell a September 15, 2017 PUT for $75 (for example). For each contract you would get $2.60 x 100 shares = $260. If V remains above $75, nobody in their right mind will exercise their right to sell V to you at $75 so you would keep $260 (less commission).
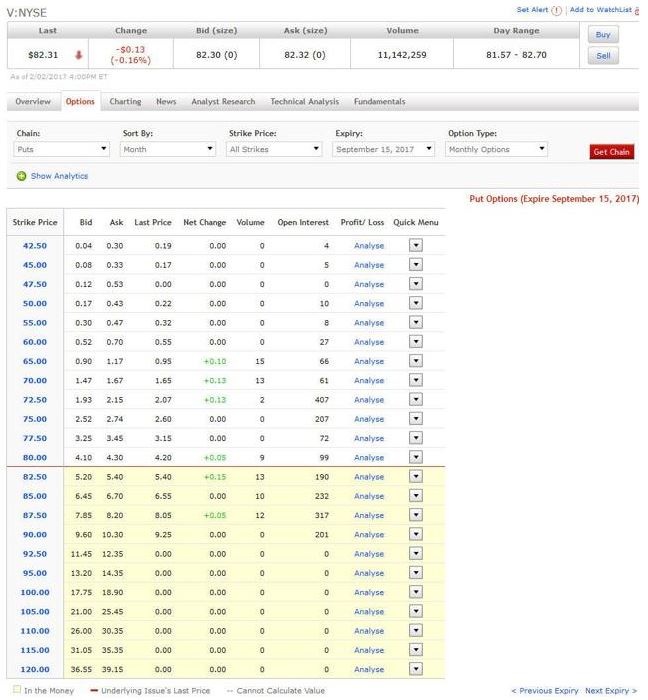
Source: Scotiabank – V Put Option Strategy
If V drops below $75, you would be faced with the position of having to fork over $75 x 100 shares = $7500 for every contract….even if V were to tank to $0! Realistically, the probability of V going to $0 is extremely remote but if it were to drop 15% from the current price, you could end up with shares worth less than your $75/share purchase price minus $2.60/share you received for writing the option, or $72.40/share. Having said this, V would most likely end up bouncing back above $72.40 at some point in the future.
The above is merely one example of how you could use options to help you generate some premiums while you wait for V to retrace to a more attractive level.
V’s dividend yield is negligible, and therefore, it is unlikely one would be purchasing V for dividend income. I will, therefore, dispense with any form of dividend yield analysis.
VISA Stock Analysis – Final Thoughts
While V is an excellent company with great growth prospects, it is definitely not on sale at the moment. If you do decide to buy at this time I think you need to be thinking of holding V long-term versus quickly flipping it.
I am becoming increasingly cautious about the markets given the run-up we have had post US election. I suspect there will be a market correction of some sort in 2017 which may offer a more attractive entry point if you want to initiate/increase a position in V.
Since we already have a full position by way of a few thousand shares of V with an average cost below $14/share, I am in no hurry to acquire more unless V drops to $75 or less. If we did not own any V, I would buy if the price were $82 or less.
I view V as a core holding and encourage you to do your own due diligence to see whether V would fit your investment profile.
Disclaimer: I have no knowledge of your circumstances and am not providing individualized advice or recommendations. I encourage you to conduct your own research and due diligence and to consult your financial advisor about your situation.
Disclosure: I am long V.
I wrote this article myself and it expresses my opinions. I am not receiving compensation for it and have no business relationship with any company mentioned.