 My last Thermo Fisher (TMO) review this January 30, 2026 post. Shares were trading at ~$577.50 and was of the opinion market conditions were ripe for further broad market pullbacks and anticipated TMO’s share price would weaken. As I finalize this post on May 21, the share price is ~$448.83.
On April 23, TMO released its Q1 2026 results and on May 20 it held its 2026 Investor Day. This is, therefore, an opportune time to revisit this exiting holding.
Industry Overview – Life Sciences Tools & Diagnostics
Market Size and Growth
The global life science tools market is one of the most enduring secular growth stories in the investment landscape. Valued at ~ $166B – ~$198B in 2024 – 2025, the market is forecast to expand at a compound annual growth rate (CAGR) of ~8 – ~11% depending on scope, potentially reaching ~$375B – ~$472B by 2034. The life science instrumentation segment specifically, TMO’s core business, stood at ~$63B in 2025. It is projected to reach ~$92.5B by 2031 at a ~6.5% CAGR.
Key Industry Drivers
Several powerful tailwinds underpin the sector’s long-term growth trajectory:
- Biopharma R&D investment: PhRMA reports more than 6,000 drugs currently in development worldwide. The National Institutes of Health (NIH), the medical research agency that is part of the US Department of Health and Human Services, allocated over $47B in 2024 for biomedical research. These investments translate directly into demand for instruments, reagents, consumables, and contract development and manufacturing services.
- Precision medicine and genomics: Advances in next-generation sequencing (NGS), proteomics, and multi-omics are requiring increasingly sophisticated instrumentation and software, driving instrument refresh cycles and expanding addressable markets.
- Pharmaceutical outsourcing: Growing reliance by pharma and biotech companies on contract research organizations (CROs) and contract development and manufacturing organizations (CDMOs) benefits integrated platforms like Thermo Fisher’s PPD and Patheon businesses.
- Aging demographics: Rising chronic disease burdens globally are propelling clinical diagnostics demand and accelerating drug development pipelines.
- AI integration in laboratory workflows: The shift toward automated, data-driven laboratory platforms is creating premium product opportunities for incumbents with robust digital capabilities.
Near-Term Challenges
The industry is navigating a post-COVID normalization cycle that has compressed demand for certain research tools and diagnostics since the 2021 – 2022 peak. Academic and government funding pressures – particularly concerns about NIH budget sequestration risk in the United States – are weighing on near-term instrument purchasing. China, which represents roughly 8% of TMO’s revenues, has experienced persistent demand softness due to fiscal caution and, more recently, escalating U.S.–China trade tensions including potential tariff impacts. These cyclical headwinds are real but widely expected to normalize as biopharmaceutical capital spending recovers through 2026 and 2027.
Competitive Landscape
The industry is dominated by a handful of large, diversified incumbents with formidable scale advantages. The top five players collectively control an estimated 30–35% of the global life science instrumentation market:
- TMO: The global market leader with ~ $44.556B in FY2025 revenues. Unmatched scale and the most complete end-to-end platform spanning instruments, consumables, reagents, and services.
- Danaher Corporation (DHR): A major rival with ~ $24B in annual revenues from its Life Sciences and Diagnostics segments. Danaher is known for the Danaher Business System and aggressive portfolio management, including its 2023 spin-off of Veralto.
- Agilent Technologies (A): ~ $6.5B in revenues, focused on analytical instruments, genomics, and laboratory solutions for pharma, chemical, and environmental markets.
- Waters Corporation (WAT): A specialty player (~$3B in revenues) with leadership in liquid chromatography and mass spectrometry. Launched the Xevo CDMS platform in October 2025.
- Bruker Corporation (BRKR): ~ $3.5B in revenues; strong in academic and preclinical research instrumentation.
- Bio-Rad Laboratories (BIO): ~$2.5B in revenues; focused on life science research and clinical diagnostics.
- QIAGEN N.V. (QGEN): ~ $2B in revenues; a leader in molecular diagnostics and sample preparation.
- Illumina (ILMN): The dominant force in DNA sequencing (~$4B in revenues), though it has been navigating significant margin pressure and strategic challenges following its aborted Grail acquisition.
TMO’s scale is a material advantage in a market where breadth of product portfolio, purchasing convenience, and customer stickiness are decisive competitive factors.
Business Overview
TMO has multiple brands (eg. Thermo Scientific, PPD, Patheon, Applied Biosystems, etc). I encourage you to access the websites of these brands to see the magnitude of TMO’s product offering. I also recommend reviewing the company’s website and Part 1, Item 1 in the FY2024 Form 10-K.
It is arguably the premier life science supplier. Its portfolio of products, resources, and manufacturing capabilities is unmatched. This enables it to increase its ‘share of wallet’ across all channels.
A large portion of TMO’s business mix is consumables and services (~82% of sales) much of which is recurring business.
Economic Moat Analysis
I consider TMO to have a wide economic moat, one of the most coveted designations in equity research, for the following reasons.
Scale and Integration
With $44.556B in annual revenues, TMO operates at a scale that no pure-play competitor can match. Its ability to supply a customer with a mass spectrometer, the reagents that run in it, the consumables consumed during analysis, the data management software, and ultimately the CDMO services to manufacture a resulting drug candidate—all under one commercial relationship—creates extraordinary customer stickiness and switching costs. Competitors can match TMO in one or two dimensions; none can match it across all five simultaneously.
Switching Costs
Scientific workflows are deeply instrument-dependent. A pharmaceutical laboratory that has calibrated its assays, trained its scientists, and validated its standard operating procedures on a TMO instrument faces substantial disruption and regulatory re-validation costs if it switches platforms. This creates powerful recurring revenue streams from consumables and service contracts once an instrument is placed.
Cost Advantages Through the PPI Business System
TMO’s proprietary Practical Process Improvement (PPI) Business System methodology – modeled on the Toyota Production System – has driven sustained margin improvement since the Fisher Scientific merger in 2006. It enables the company to continuously identify and eliminate waste, improve quality, and reduce delivery lead times, underpinning adjusted operating margins in the low-to-mid 20% range.
Acquisition Machine
Since CEO Marc Casper took the helm in 2009, TMO has deployed well over $60B on acquisitions including Life Technologies ($13.6B, 2014), Patheon ($7.2B, 2017), PPD ($21B, 2021), Olink ($3.1B, 2024), Solventum Purification & Filtration ($4.1B, 2025), and Clario ($8.875B, 2026).
Each deal has expanded the company’s capabilities, deepened its customer relationships, and added recurring revenue. The acquisition track record is exceptional. In Casper’s 16+ year tenure, TMO has compounded revenues from ~$10B to ~$44.556B.
Pending Divestiture: Microbiology Business
TMO will periodically divest a part of its business deemed to be non-core. In April 2026, it announced a definitive agreement to sell its microbiology business to European private equity firm Astorg for ~$1.075B, consisting of cash and a $50 million seller note. This divestiture sharpens TMO’s portfolio focus on higher-growth segments and is consistent with the company’s philosophy of continuously optimizing its business mix.
Customer Relationships and Trust
The ‘Trusted Partner’ model TMO has cultivated with major pharmaceutical and biotech companies goes beyond transactional purchasing. Through embedded service engineers, site services teams, and co-development partnerships, TMO has embedded itself into the operational fabric of its largest customers in ways that are extraordinarily difficult to dislodge.
Competitive Weaknesses
No moat is without limits. TMO’s vulnerabilities include:
- Low-end competition in analytical instruments: Particularly from Asian manufacturers in basic chromatography, spectroscopy, and laboratory supplies categories where price sensitivity is high.
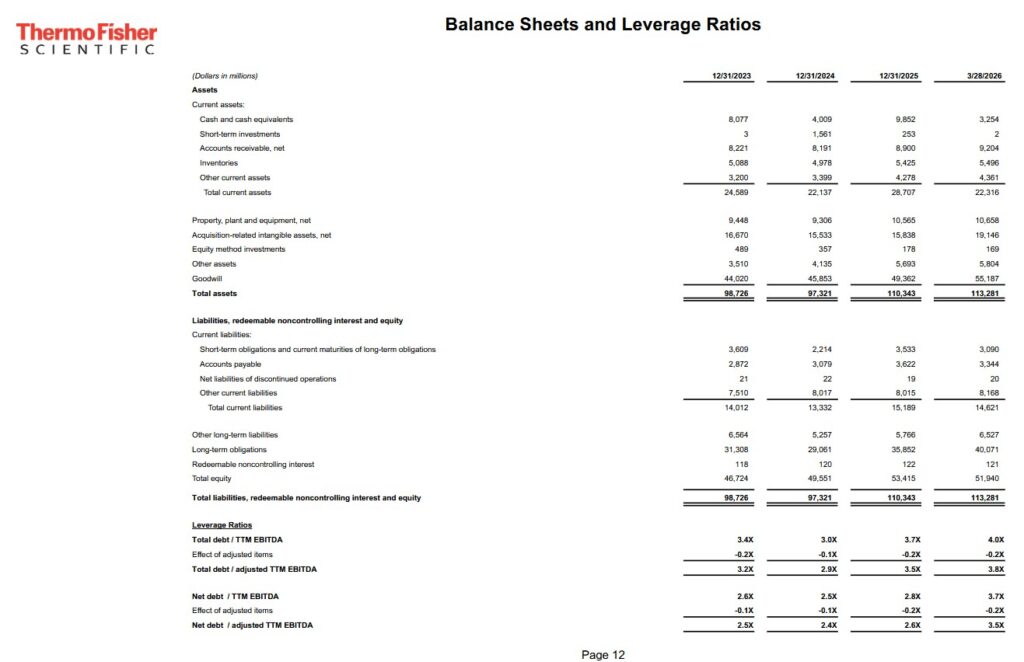
- Post-acquisition leverage: The Clario deal raised gross debt to adjusted EBITDA to 3.8x, above the company’s long-term preferred range of 2.5 – 3.0x. While management has a proven deleveraging track record, elevated leverage limits financial flexibility for near-term opportunistic acquisitions.
- Government and academic funding exposure: Academic and government customers representing a meaningful portion of the Analytical Instruments segment are subject to budget cycles, NIH funding risk, and policy uncertainty.
- China concentration risk (~8% of revenues): US and China trade tensions, including tariffs on TMO’s China-sourced components and retaliatory measures affecting its China sales, present a $400+ million revenue headwind as explicitly acknowledged by management.
- Acquisition integration risk: At $8.875B, Clario is a large and operationally complex acquisition. Integration execution risk is real.
2026 Investor Day
This is a summary of the key messages from TMO’s 2026 Investor Day held on May 20, 2026.
The key messages are:
- Attractive End Markets with Strong Fundamentals
TMO serves an attractive ~$255B market with improving demand trends and strong long-term growth fundamentals. The company said its market has improving demand trends and strong long-term growth fundamentals.
- Proven Growth Strategy Driving Share Gain
Management highlighted three pillars of the growth strategy:
- Innovation – cutting-edge technologies that accelerate customer innovation and enhance productivity.
- Trusted Partner – expertise, scale, and depth of capabilities that make TMO the partner of choice for customers’ most important challenges.
- Commercial Engine – exceptional reach and depth of engagement as a competitive advantage.
The company has a track record of delivering share gain through its proven growth strategy, operational excellence through its PPI Business System, and creating value through disciplined capital deployment.
- The PPI Business System as the Operational Foundation
The PPI Business System is described as the core of TMO’s culture, with a focus on continuous improvement that drives quality, productivity, and customer allegiance. TMO is amplifying the impact of PPI by increasingly integrating artificial intelligence into its way of working, improving operational efficiency, enhancing customer service, and strengthening differentiated product and service offerings.
- AI as a Powerful Long-Term Accelerator
AI will be a long-term driver of growth by accelerating scientific breakthroughs and improving returns on drug discovery, thereby fueling additional investment into TMO’s customers’ drug pipelines. Management also stated that:
- TMO is positioned to capture AI-driven growth through its presence across the full drug development value chain.
- AI and automation are accelerating the impact of PPI across the company as capabilities are deployed at scale.
- Disciplined Capital Deployment
A disciplined combination of strategic M&A and returning capital to shareholders enables TMO to further strengthen its industry leadership and creates significant value for shareholders. In 2025, for example, TMO deployed ~$16.5B, including ~$13B committed to M&A, and returned ~$3.6B to shareholders through stock buybacks and dividends, delivering 11.3% adjusted Return on Invested Capital (ROIC).
- Long-Term Financial Targets — Growth Outlook
TMO’s proven growth strategy and disciplined capital deployment position it to deliver 7% organic revenue CAGR and low-teens adjusted EPS growth over the long term.
Financials
Q1 2026 Results
The Q1 2026 Earnings Materials are accessible here. In addition, I recommend reviewing the Q1 2026 GAAP/Non-GAAP Reconciliation & Financial Information.
Conventional And Modified Free Cash Flow (FCF) Calculations (FY2019 – FY2025 and Q1 2026)
FCF is a non-GAAP measure, and therefore, the manner in which it is calculated is inconsistent. Many investors deduct CAPEX from OCF to arrive at FCF. In my How Stock Based Compensation Distorts Free Cash Flow post, I explain why I now also deduct stock based compensation (SBC) that is found in the Consolidated Statements of Cash Flows to determine FCF.
The following table reflects TMO’s FCF without/with the deduction of SBC.
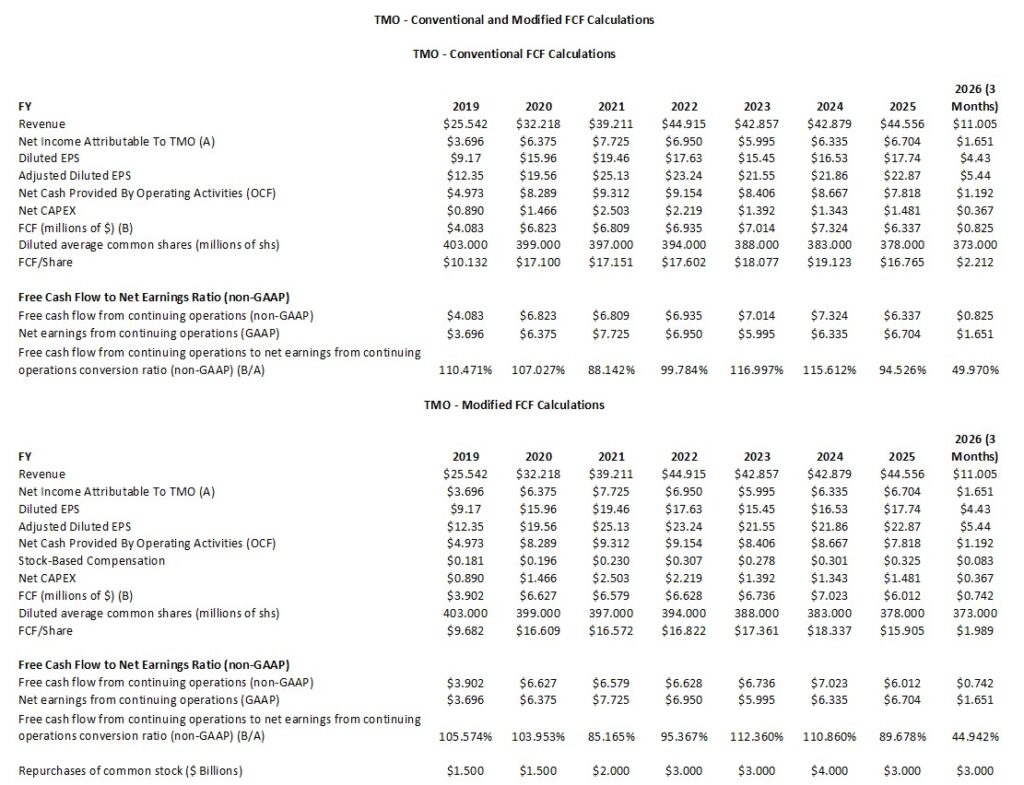
NOTE: The annual Net CAPEX figures deduct ‘proceeds from sale of property, plant and equipment’ from ‘purchases of property, plant and equipment’.
Return Metrics: ROE, ROIC, and WACC
High quality companies often generate a high ROIC. If a company generates a high ROIC, it needs to invest less to achieve a certain growth rate thus reducing the need for external capital.
When a company consistently generates a high ROIC over the long term and it is growing its revenue, it can reinvest a portion of its profits under favorable conditions thereby leading to a compounding effect. I would much rather invest in a growing company that can reinvest to create greater shareholder value than to invest in a company that has limited growth opportunities and thus chooses to distribute a growing dividend.
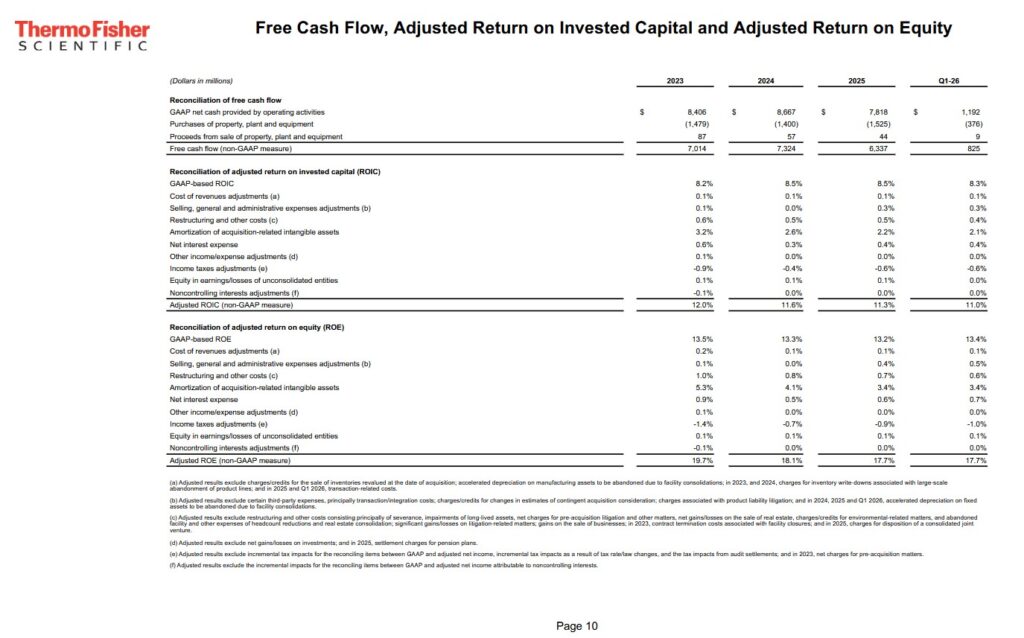
TMO makes various adjustments (see schedule below) to arrive at its adjusted ROIC (%).
Return on Equity (ROE)
TMO’s GAAP-based ROE has trended lower since the COVID peak, declining from ~18.5% in 2020 to ~12.8–13.5% by 2024 – 2025. This decline reflects the substantial equity base expansion from large acquisitions (primarily the $21 billion PPD deal), the post-COVID revenue normalization, and increased amortization of acquisition-related intangibles. On an adjusted basis (excluding intangible amortization and restructuring charges), the underlying profitability picture is materially stronger. Management reports an adjusted ROIC of 11.3% for 2025.
Return on Invested Capital (ROIC)
GAAP-based ROIC trends have also compressed, reflecting the massive capital deployed through acquisitions since 2021. ROIC measured on a GAAP basis declined from ~10.7% in 2020 to ~6.0 – ~8.5% in recent years depending on the methodology applied (NOPAT vs. operating income as the numerator). At ~$82B in invested capital, with substantial goodwill and acquisition-related intangibles embedded in that base, reported ROIC metrics will remain muted relative to the company’s pre-PPD history.
ROIC ex-goodwill is the more instructive metric for assessing organic capital efficiency. Thermo Fisher’s 2024 ROIC ex-goodwill was ~22%, reflecting the underlying cash-generating power of the business when abstracted from acquisition accounting mechanics.
WACC
External estimates of TMO’s WACC range from ~7.6% – ~9.0%, depending on assumptions for the risk-free rate, equity risk premium, and debt weighting. A reasonable mid-point estimate, given the company’s A-/A2-rated investment grade debt structure and defensive earnings characteristics), would be ~8.0 – 8.5%.
Value Spread Assessment
Using reported ROIC of ~8.0 – ~8.5% against a WACC of ~8.0 – ~8.5%, the value spread on an as-reported basis is approximately near zero to slightly positive. This is a reflection of the post-acquisition capital base inflation rather than any fundamental deterioration in business quality. The ROIC ex-goodwill at ~22% versus WACC of ~8 – ~9% represents a substantially positive value creation spread, confirming that the underlying operations generate compelling returns on the tangible capital deployed. As the acquisition-related amortization winds down and earnings grow into the invested capital base, reported ROIC should recover meaningfully over the next three to five years.
Q2 and FY2026 Guidance
During its Q1 2026 earnings conference call on April 23, 2026, TMO provided updated financial guidance for FY2026 and specific qualitative markers for Q2 2026.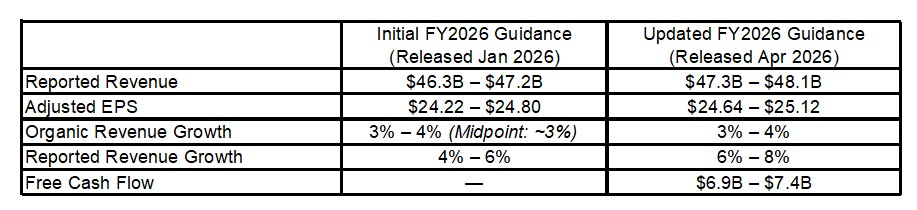
The update was driven by:
- a strong Q1 earnings beat;
- the acquisition of Clario; and
- solid execution in core segments like bioproduction.
TMO typically manages near-term performance through full-year framing rather than tight quarterly guidance ranges. Management, however, flagged specific expectations for Q2:
- Muted Near-Term Organic Growth: Full-year organic growth is tracking to its 3% – 4% target. Q2, however, is likely to feature lighter, sequential organic expansion (~3% organic growth).
- The ‘Second-Half Ramp’: Because Q1 organic growth was soft at 1%, the updated full-year numbers rely on a proven acceleration in the back half of 2026 as biopharma capital spending and academic research budget pressures ease.
The key drivers of the FY2026 revision are:
- The Clario Acquisition which is expected to contribute ~$0.9B in revenue and $0.32 to adjusted EPS net of financing costs for the full year.
- Q1 Outperformance: Q1 reported revenue was ~$11.01B (up 6% YoY) and adjusted EPS of $5.44, outpacing initial internal modeling and Wall Street consensus.
Supporting Financial Assumptions for 2026
- Adjusted Operating Margin to expand by 70 bps over the full year;
- Net CAPEX projection of ~$1.9B – ~$2.1B;
- Share Repurchases of $3B planned for FY2026; and
- Adjusted Tax Rate of 11.5%.
Risk Assessment
There are no changes to TMO’s domestic unsecured long-term debt ratings from the time of my prior review.
- Moody’s upgraded the rating to A2 from A3 on November 17, 2025.
- S&P Global continues to assign an A- rating with a stable outlook. Last reviewed June 24, 2025.
- Fitch continues to assign an A- rating with a stable outlook. Last reviewed September 30, 2025.
Moody’s rating is the middle tier of the upper-medium investment-grade tier. S&P’s and Fitch’s rating is the bottom tier of the upper-medium investment-grade tier. The ratings define TMO as having a STRONG capacity to meet its financial commitments. It is, however, somewhat more susceptible to the adverse effects of changes in circumstances and economic conditions than obligors in higher-rated categories.
These ratings satisfy my conservative investment profile.
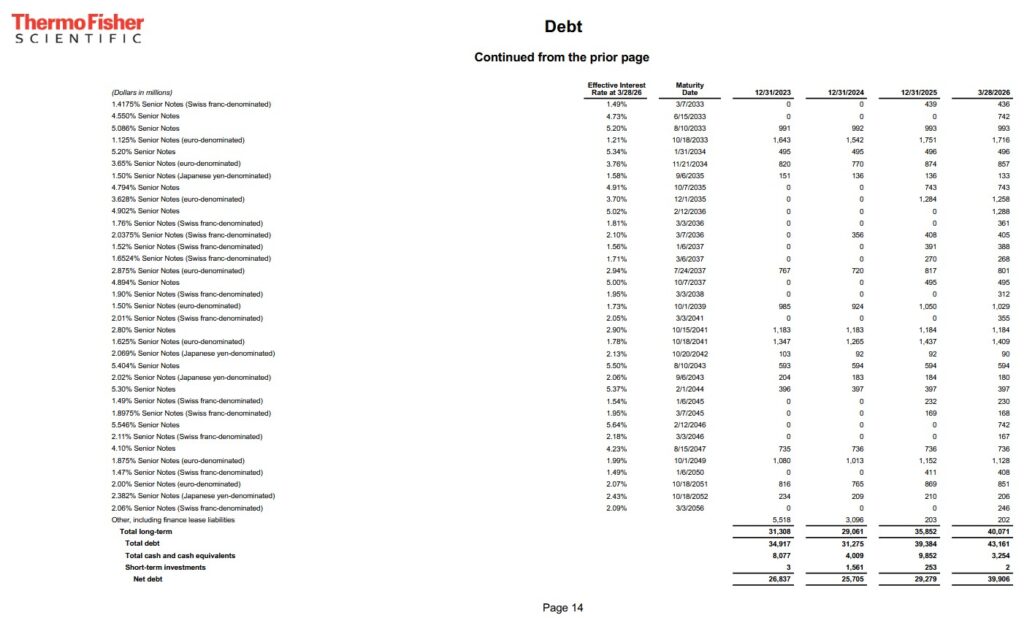
The following schedule reflects TMO’s net debt/adjusted trailing 12 month EBITDA ratio for FY2023 – FY2025 and Q1 2026.
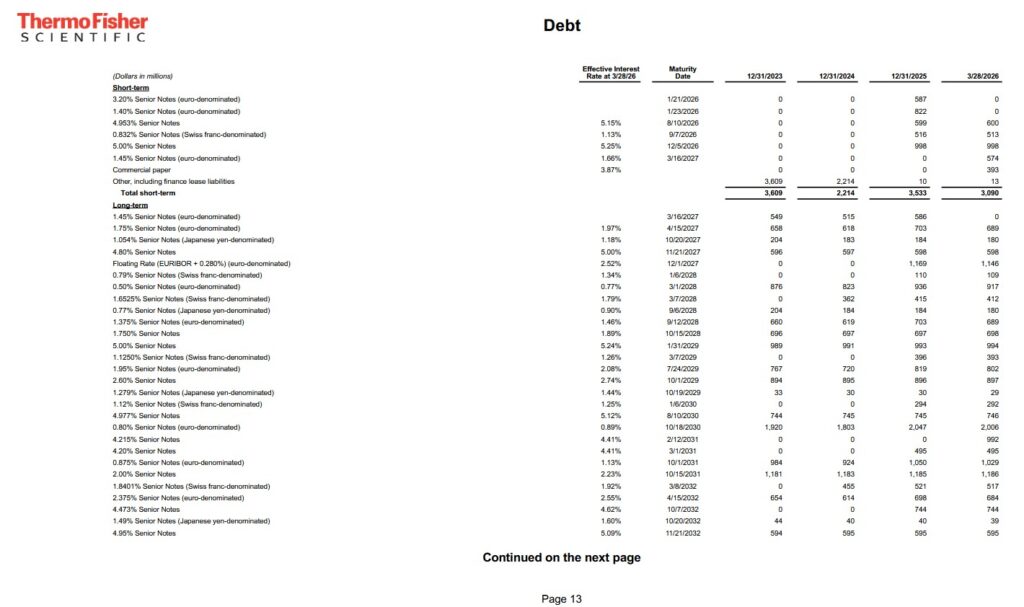
The following is TMO’s current debt maturity schedule.
Dividend and Dividend Yield
TMO’s dividend history is accessible here.
Past performance is not necessarily indicative of future performance. Dividends, however, are a low capital allocation priority. This is unlikely to change in the foreseeable future.
When considering TMO as a potential investment, disregard the dividend metrics.
The following table reflects TMO’s share buybacks in FY2023 – FY2025 and Q1 2026.
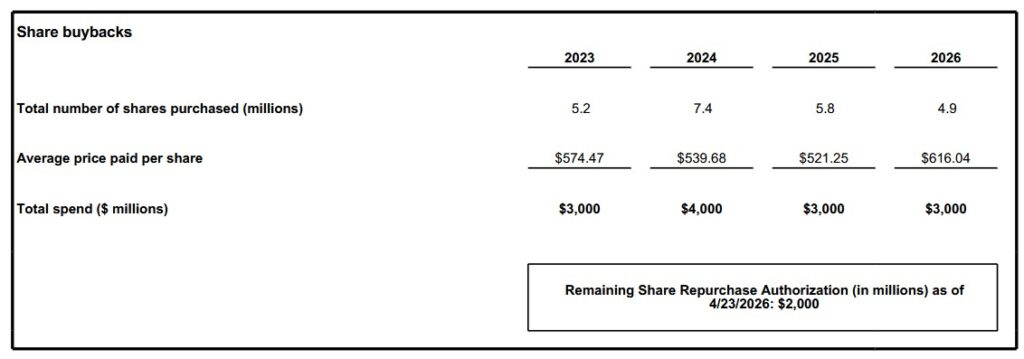
The weighted average diluted shares outstanding in FY2013 (in millions) was 366. TMO, however, issues equity to assist in the funding of some of its acquisitions. This explains why 377 million shares are outstanding in FY2025 despite a considerable level of share repurchases in recent years.
Since 2020, Thermo Fisher has returned over $18B to shareholders through combined dividends and share repurchases. The company’s share count has declined from approximately 398 million shares in 2019 to ~370 – ~377 million shares. Given the magnitude of acquisition spending, this is a measured but consistent buyback program. Management’s $5B authorization in November 2025 signals continued commitment to shareholder returns.
Stock Splits
TMO had three 3 for 2 stock splits in the 1990s (1993, 1995, and 1996).
Valuation
On May 21, I acquired 50 additional shares @ ~$448.83. Using this share price and management’s FY2026 $24.64 – $25.12 adjusted diluted EPS guidance, the forward adjusted diluted PE range of ~17.87 – ~18.22.
Using the currently available broker estimates, TMO’s forward-adjusted diluted PE levels are:
- FY2026 – 25 brokers – a forward-adjusted diluted PE of ~18.1 using a mean of $24.87 and low/high of $24.63 – $25.05.
- FY2027 – 25 brokers – a forward-adjusted diluted PE of ~16.4 using a mean of $27.30 and low/high of $26.25 – $29.07.
- FY2028 – 16 brokers – a forward-adjusted diluted PE of ~14.9 using a mean of $30.13 and low/high of $28.58 – $31.71.
Management’s FY2026 FCF outlook is ~$6.9B – ~$7.4B. If FY2026 SBC is ~$0.335B, the modified FCF outlook for FY2026 is ~$6.565B – ~$7.065B.
The FY2026 full year average diluted share count forecast is 370 – 375 million shares.
Using the 372.5 million shares mid-point the FY2026 FCF/share should be:
- ~$7.065B/372.5 million = ~$18.97
- ~$6.565B/372.5 million = ~$17.62
Using my ~$448.83 purchase price, the forward P/FCF range is ~23.7 – ~25.5.
In my January 30, 2026 post I wrote:
As I compose this post on January 30, 2026 the share price is ~$577.50. Using this share price and management’s FY2026 $24.22 – $24.80 adjusted diluted EPS guidance, the forward adjusted diluted PE range of ~23.3 – ~23.8.
Using the currently available broker estimates, TMO’s forward-adjusted diluted PE levels are:
- FY2026 – 25 brokers – a forward-adjusted diluted PE of ~23.5 using a mean of $24.56 and low/high of $24.00 – $25.00.
- FY2027 – 23 brokers – a forward-adjusted diluted PE of ~21.4 using a mean of $26.95 and low/high of $26.37 – $27.65.
- FY2028 – 11 brokers – a forward-adjusted diluted PE of ~19.4 using a mean of $29.78 and low/high of $28.85 – $31.00.
Management’s FY2026 FCF outlook is ~$6.8B – ~$7.3B. If FY2026 SBC is ~$0.335B, the modified FCF outlook for FY2026 is ~$0.6465B – ~$6.965B.
The FY2026 full year average diluted share count forecast is 370 – 375 million shares.
Using the 372.5 million shares mid-point the FY2026 FCF/share should be:
- ~$6.965B/372.5 million = ~$18.70
- ~$6.465B/372.5 million = ~$17.36
With shares trading at ~$577.50 the forward P/FCF range is ~30.9 – ~33.3.
Final Thoughts
TMO represents one of the highest-quality franchises in the global healthcare and life sciences sector. The current market price reflects cyclical headwinds, temporary leverage elevation, and macro noise rather than any deterioration in the company’s fundamental competitive position. For investors with a 3 – 5 year time horizon, the current valuation offers an unusually attractive combination of quality, growth, and value.
At ~18x FY2026 consensus adjusted EPS, TMO trades at a discount to its 10-year median forward P/E of ~20 – ~24x. This discount is attributable to:
- near-term organic growth uncertainty;
- elevated post-Clario leverage; and
- macro/tariff noise.
None of these represent structural impairments to the business franchise.
When I completed my 2025 Year-End Investment Holdings Review, TMO was my 11th largest holding. I held 358 shares in ‘Core’ accounts and 100 shares in a ‘Side’ account in the FFJ Portfolio. At the time of that year-end review, shares were trading at ~$579.50.
I consider a current fair value to be ~$550 – ~$570. As noted earlier, I acquired an additional 50 shares @ $448.8324 on May 21. My exposure now consists of 408.40111 shares in ‘Core’ accounts and 100 shares in a ‘Side’ account in the FFJ Portfolio.
I wish you much success on your journey to financial freedom!
Note: Please send any feedback, corrections, or questions to finfreejourney@gmail.com.
Disclosure: I am long TMO.
Disclaimer: I do not know your circumstances and do not provide individualized advice or recommendations. I encourage you to make investment decisions by conducting your research and due diligence. Consult your financial advisor about your specific situation.
I wrote this article myself and it expresses my own opinions. I do not receive compensation for it and have no business relationship with any company mentioned in this article.