![]()
On May 5, 2026, Arista Networks (ANET) released its Q1 2026 results, Q2 outlook, and revised FY2026 guidance. The Q1 revenue and operating margin came in ahead of guidance and management raised its full-year outlook for total revenue and artificial intelligence revenue. Despite decent results and guidance, ANET’s share price softened so I acquired an additional 100 shares on May 6 @ $142.02 in a ‘Core’ account in the FFJ Portfolio bringing my exposure to 600 shares.
Business Overview
I reference my December 3, 2025 post in which I provide a high level company overview.
The company’s website and in Part 1 Item 1 in the FY2025 Form 10-K accessible through the SEC Filings section of the company’s website are great sources of information.
The May 2026 Investor Presentation is another excellent source of information.
Financials
Q1 2026 Results
ANET’s Q1 2026 results are accessible here.
On the Q1 earnings call, ANET’s Chairperson and CEO states:
Our demand is actually the best I have ever seen in my Arista tenure. The supply, however, is a slightly different and opposite tale. We are experiencing industry-wide shortages across the board, be it wafers, silicon chips, CPUs, optics, and of course, memory that I referred to last quarter, coupled with elevated costs to procure these. Clearly, our demand is outstripping our supply this year. While we hope the supply chain will ease in the next year or two, the Arista operations team has been diligently engaging with our vendors in strengthening supply agreements and engaging in multi-year purchase commitments. We anticipate gross margin pressure due to mix and trade-offs we are making to pay more to assure supply continuity to our customers. Nevertheless, it gives us confidence to increase our forecasted growth slightly to 27.7%, aiming now for $11.5 billion for 2026. We also increased our AI target now to $3.5 billion this year, thereby more than doubling our AI sales annually.
On the earnings call, ANET’s CFO states:
We generated approximately $1.69 billion of cash from operations in the period, the strongest in the history of Arista. This was driven by a robust earnings performance coupled with an increase in deferred revenue. DSOs came in at 64 days, down from 70 days in Q4 due to the linearity of shipments within the quarter. Our inventory turns improved slightly, landing at 1.7 versus 1.5 in the prior quarter. We ended the quarter with $2.38 billion in inventory, up from $2.25 billion last quarter. This marginal increase is a calculated investment in the mix of raw materials to fulfill our growing demand. Our purchase commitments at the end of the quarter were $8.9 billion, up from $6.8 billion at the end of Q4.
As mentioned in prior quarters, this expected activity mostly represents purchases for chips related to new products and AI deployments. We will continue to have some variability in future quarters as a reflection of the combination of demand for our new products, component variability, and the lead times from our key suppliers. This could also result in quarters of elevated inventory balances ahead of the deployments. Our total deferred revenue balance was $6.2 billion, up from $5.37 billion in the prior quarter. The majority of the deferred revenue balance is product related. Our product deferred revenue increased approximately $643 million versus last quarter. We remain in a period of ramping our new products, winning new customers, and expanding new use cases, including AI.
These trends have resulted in increased customer specific acceptance clauses and an increase in the volatility of our product deferred revenue balances. As mentioned in prior quarters, the deferred balance can move significantly on a quarterly basis independent of underlying business drivers. Accounts payable days were 54 days, down from 66 days in Q4, reflecting the timing of inventory receipts and payments. Capital expenditures for the quarter were $54.5 million. We continue the construction work to build expanded facilities in Santa Clara. In Q1, we incurred approximately $40 million in CapEx related to this program and estimate it will reach $180 million in 2026. These Q1 results have provided a strong start to our fiscal year 2026.
At the end of Q1 2026, ANET’s cash and cash equivalents and marketable securities was ~$12.354B versus ~$10.743B at FYE2025 (December 31, 2025) and ~$8.304B at FYE2024 (December 31, 2024).
Total liabilities at the end of Q1 2026 was ~$8.169B of which ~$4.91B was current deferred revenue and ~$1.289B was non-current deferred revenue. Comparable data at FYE2025 was ~$7.078B, ~$4.003B, and ~$1.370B. Deduct deferred revenue (funds received from customers prior to services being rendered) and liabilities at the end of Q1 2026 amount to ~$1.97B versus ~$1.705B at FYE2025.
At FYE2024, total liabilities were ~$4.049B of which ~$1.727B was current deferred revenue and ~$1.064B was non-current deferred revenue. Liabilities amount to ~$1.258B when we deduct deferred revenue.
Annual CAPEX is relatively low but developing products (research and development (R&D)) is expensive. In FY2019 – FY2025, ANET’s R&D expenses were ~$0.463B, ~$0.487B, ~$0.587B, ~$0.729B, ~$0.855B, ~$0.997B, and ~$1.237B. In Q1 2026, R&D was ~$0.344B. Furthermore, the investment in product development typically involves a long payback cycle. These investments may take several years to generate positive returns, if ever.
ANET expects to continue to invest heavily in software development to expand the capabilities of its cloud networking platform and to introduce new products and features. Results of operations will likely be impacted by the timing and size of these investments. Investors should anticipate ‘lumpy’ quarterly results.
Contract Liabilities, Deferred Revenue and Other Performance Obligations
The deferred revenue (current and long-term) is typically reserved for Performance Obligations where the customer has paid and ANET simply needs to ‘earn’ the money by providing a service (eg. technical support, software updates/maintenance and CloudVision subscriptions) over a period of time.
Other current liabilities of ~$0.601B represents transaction-based obligations such as sales rebates, customer credits, and return reserves that represent a potential cash outflow or credit rather than earned work.
Other long-term liabilities of ~$0.32B represent time-based/legal obligations such as long-term warranty obligations beyond the standard period and the non-current portion of operating lease liabilities.
Operating Cash Flow (OCF), Free Cash Flow (FCF), and CAPEX (FY2019 – FY2025 and Q1 2026)
In prior posts I touch upon my rationale for deducting stock-based compensation (SBC) to calculate FCF. I, therefore, dispense with explaining this again.
The following compares ANET’s FCF using the ‘conventional’ and ‘modified’ calculation methods. The data takes into account a 4:1 stock split on November 18, 2021 and another 4:1 stock split on December 4, 2024.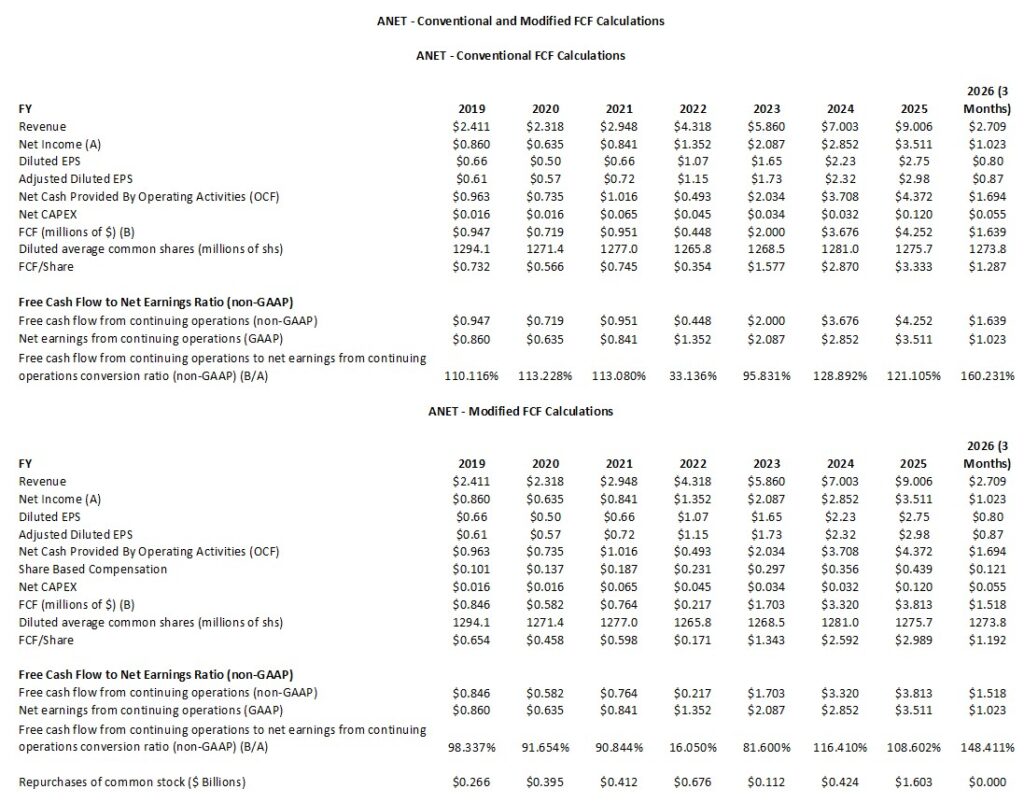
Capital Allocation
ANET’s capital allocation strategy focuses on maintaining its operational model while fueling the aggressive 25% growth target for 2026. With ~$12.354B in cash and cash equivalents and marketable securities, it has significant ‘dry powder’.
ANET’s priorities for FY2026 fall into four main categories:
Aggressive R&D and ‘Co-Engineering’
The primary priority is organic growth through innovation and the company is shifting capital toward the 1.6T (Terabit) switching transition.
Significant capital is being allocated to the “Ethernet for Scale-Up” initiative and the development of AI rack systems.
Funding for software (EOS and NetDL) to improve AI workload performance, ensuring they remain the ‘standard’ for the back-end AI network.
Strategic M&A (The ‘VeloCloud’ Blueprint)
Management is looking for more ‘technology-tuck-ins’ following the July 2025 acquisition of VeloCloud from Broadcom. ANET is specifically looking for acquisitions in Network Identity, Cybersecurity, and Cognitive Campus technologies. The company is not interested in ‘distressed assets’ but rather high-quality technologies that can be integrated into the single-image EOS (Extensible Operating System) architecture.
Supply Chain Inventory and Purchase Commitments
Due to ongoing constraints in the High Bandwidth Memory (HBM) and advanced optics markets, ANET is using its cash to secure its future. It has increased its purchase commitments to ensure they can meet the $11.5B revenue goal for 2026. In addition, ANET is intentionally maintaining higher-than-normal inventory levels (~$2.25B at FYE2025) to insulate against potential supply shocks in the AI sector.
Opportunistic Buybacks
ANET continues to prefer share buybacks over dividends. Although there is no set schedule for buybacks, management’s policy is to opportunistically repurchase shares to offset dilution from stock-based compensation.
The company remains in a high-growth phase where reinvesting in the business yields the highest return.
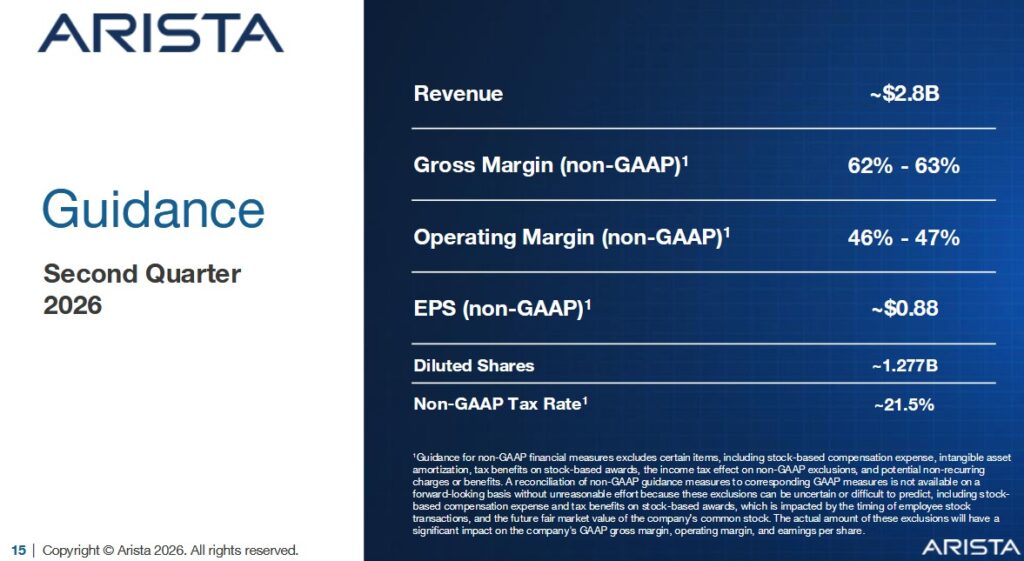
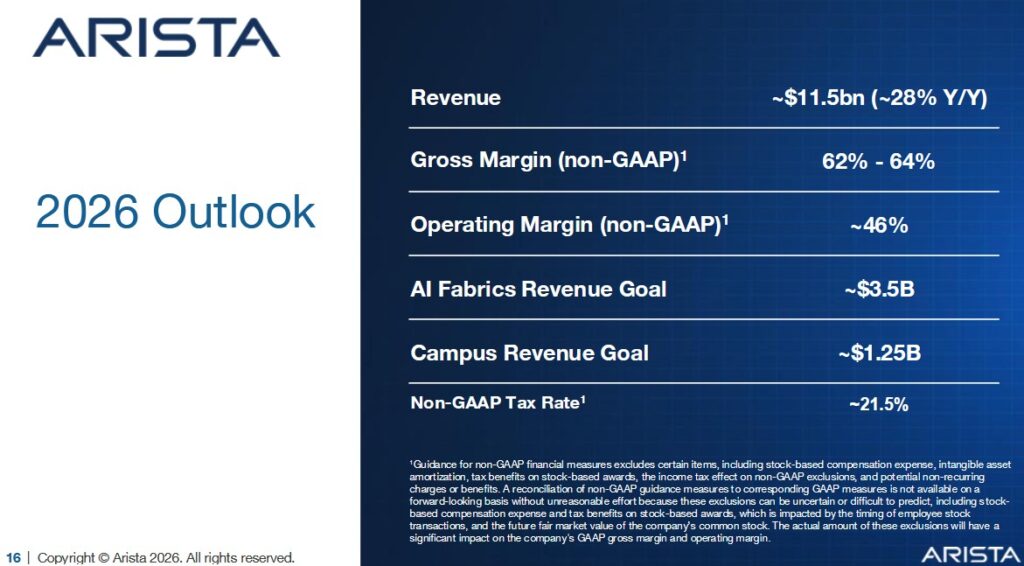
Q2 Guidance and FY2026 Outlook
The following is ANET’s current Q2 2026 guidance and FY2026 outlook.
The following is ANET’s Q1 2026 guidance and FY2026 outlook released in early May 2026.
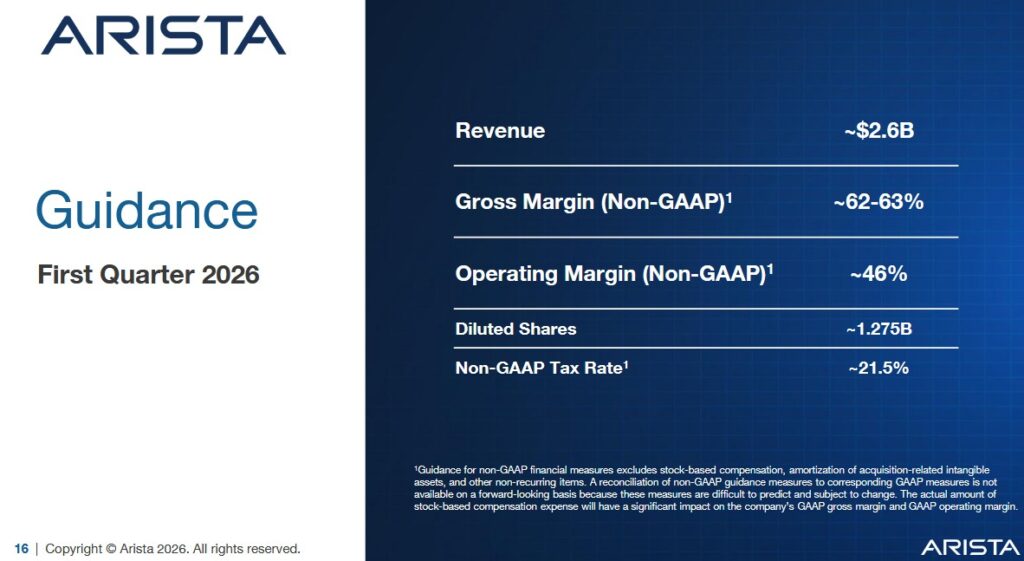
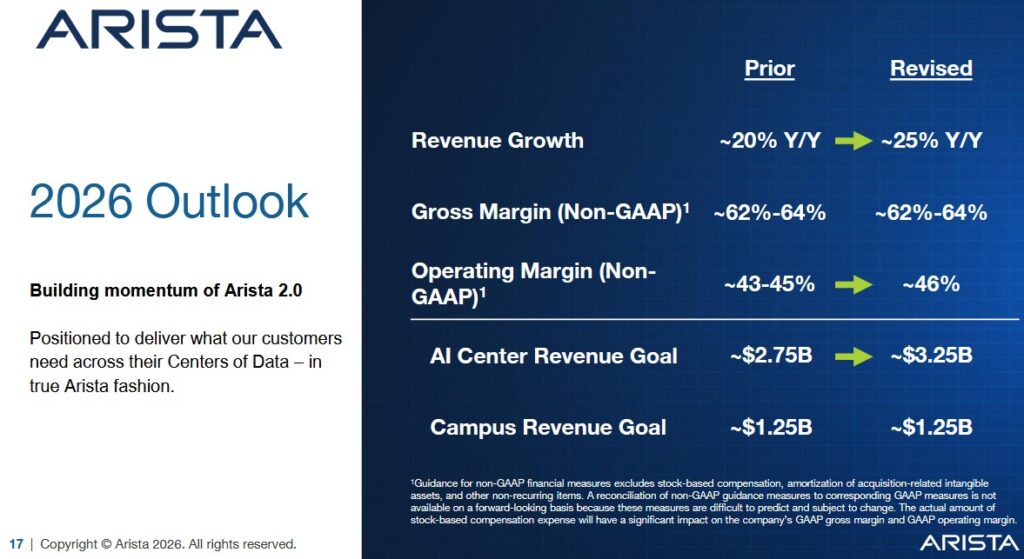
The preliminary outlook when I published my December 3, 2025 post was:
- Revenue growth of ~20%;
- Revenue growth of ~20%, or ~$10.65B.
- Gross margin of ~62% – ~64%; and
- Operating margin of ~43% – ~45%.
ROIC and WACC
Return on Invested Capital (ROIC) provides an indication of a company’s efficiency. In essence, is a company actually creating value or ‘burning’ cash for the sake of growth?
A company with a higher ROIC is mathematically worth more because it requires less reinvestment to achieve that growth.
A good indication of how well a company is performing is to compare ROIC to the Weighted Average Cost of Capital (WACC). WACC, however, is not a metric ANET officially reports. A rough estimate is possible using the company’s credit profile and market conditions.
The generally accepted high-level formula used by Wall Street is:
ROIC = NOPAT/Average Invested Capital
with the Net Operating Profit After Tax (NOPAT) formula being Operating Income (EBIT) x (1-tax rate)
This shows how much profit the core business makes while ignoring how much debt the company has.
The Average Invested Capital is the total money tied up in the business.
- The Operating Approach formula is
- The Financing Approach is
One shortcoming with ROIC is that it is a non-GAAP metric meaning the input data plugged into the ROIC formula is inconsistent.
Analyzing ANET’s ROIC and WACC reveals a company that is not just growing, but generating massive ‘excess returns’. It remains one of the most efficient capital allocators in the technology sector with most analyst models placing ANET’s ROIC between 35% – 45% (adjusted for excess cash). This is exceptionally high for a hardware-adjacent company.
Its WACC, on the other hand, is ~9% – ~11% because the company has no debt on its balance sheet.
Given these metrics, the spread between ANET’s ROIC and WACC is~25% – ~35%.
Calculating a precise ROIC, however, is difficult because of ANET has ~$12.354B in cash and cash equivalents and marketable securities on its Q1 2026 Balance Sheet.
In a standard ROIC formula (NOPAT / Total Assets – Current Liabilities), the cash and cash equivalents and marketable securities is included in the denominator. Cash, however, earns a low rate of return compared to the core business (selling 800G switches). This, therefore, negatively affects the reported ROIC.
If we want to determine the true efficiency of the business, analysts use Invested Capital (excluding cash). Removing this cash from the denominator leads to an increase in ANET’s ROIC from the mid-teens to over 40%.
The other complication is the level of deferred revenue (~$6.2B at the end of Q1 2026).
Deferred revenue is cash ANET has already collected from customers (for services like CloudVision or maintenance) but has not yet earned as accounting revenue.
Because this is a ‘non-interest bearing liability’, it is a source of free capital. ANET is essentially using its customers’ money to fund its own R&D.
Unless we treat deferred revenue as an operating liability rather than capital, we will overestimate the amount of equity/debt actually needed to run the business, thereby understating the ROIC.
ANET’s high ROIC is a direct result of its ‘asset light’ model. ANET outsources all manufacturing this keeping Invested Capital very low. Furthermore, its EOS software is a single image across all products so their R&D is highly efficient because they do not need to reinvent the wheel for every new switch speed.
Risk Assessment
ANET has no debt to rate.
Dividends and Share Repurchases
Dividend and Dividend Yield
Page 17 of 128 in the FY2025 Form 10-K reflects the following:
We have not paid dividends in the past and do not intend to pay dividends for the foreseeable future.
Stock Splits
ANET initiated a 4:1 stock split on November 18, 2021 and another 4:1 stock split on December 4, 2024.
Share Repurchases
When I initiated a position in ANET I indicated one area of concern was the growth in its annual SBC. The company, however, repurchases shares that more than offset the number of shares being issued as part of its various employee compensation packages (see table presented in the Operating Cash Flow (OCF), Free Cash Flow (FCF), and CAPEX section of this post). The exception is FY2023 when SBC exceeded share repurchases by ~$0.185B.
In Q1 2026, ANET repurchased no shares. Of the $1.5B repurchase program approved in May 2025, $817.9 million remains available for repurchase in future quarters. If ANET’s share price remains undervalued, I anticipate the company will repurchase shares over the remainder of FY2026.
Valuation
As I finalize this post on May 8, ANET’s share price is ~$140.34.
The following broker adjusted diluted earnings estimates are likely to change slightly over the coming days.
- FY2026 – 27 brokers – ~38.9 using a mean of $3.61 and low/high of $3.45 – $3.77.
- FY2027 – 26 brokers – ~31.9 using a mean of $4.40 and low/high of $4.03 – $5.20.
- FY2028 – 17 brokers – ~26.3 using a mean of $5.33 and low/high of $4.62 – $6.32.
ANET’s FCF/share exceeds GAAP EPS the past couple of years. I anticipate this will be the case in FY2026.
If ANET generates $2.97 of GAAP EPS and we use a ~110% FCF conversion ratio, the FY2026 FCF should be ~$3.27 (modified calculation method). Divide ~$140.34 by $3.27 and the P/FCF is ~43.
My February 14, 2026 post reflects my previous valuation estimates.
Final Thoughts
My Final Thoughts are the same as in my February 14, 2026 post.
ANET has moved from a conservative growth stance to an aggressive expansion phase. It is widely recognized as a dominant leader in the networking industry, particularly within the high-speed data center and cloud networking segments. As of Q1 2026, it has successfully transitioned from being a disruptor to the primary incumbent in the most advanced parts of the networking market and it often outperforms legacy giants like Cisco in specific high-performance tiers.
ANET’s revenue outlook for FY2026 is ~$11.5B or ~27.7% YoY growth from FY2025’s revenue of $9.006B. However, in November 2023, ANET viewed the total addressable market as being $60B by 2027. In June 2024, it increased this to $70B by 2028 and in September 2025 this was increased to $105B by 2029.
Given that ANET is currently the benchmark against which all other vendors are measured, I think there is a reasonable probability that ANET’s projected FY2026 annual revenue could double within the next 3 – 5 years. Even if I ‘slightly overpay’ to acquire ANET shares, I think there is a reasonable probability that my ANET investment could be worth considerably more within the next few years.
Following my recent purchase, my ANET exposure is only 600 shares. I intend to opportunistically add to my exposure.
I wish you much success on your journey to financial freedom!
Note: Please send any feedback, corrections, or questions to finfreejourney@gmail.com.
Disclosure: I am long ANET.
Disclaimer: I do not know your circumstances and do not provide individualized advice or recommendations. I encourage you to make investment decisions by conducting your research and due diligence. Consult your financial advisor about your specific situation.
I wrote this article myself and it expresses my own opinions. I do not receive compensation for it and have no business relationship with any company mentioned in this article.