
On August 27, 2015 I initiated an ‘experiment’ to determine which company would generate the best investment returns over a 20+ year time frame – Chevron (CVX) or Exxon Mobil (XOM).
As at November 3, 2018, the value of my current CVX holdings is ~$10,000 greater than the value of the XOM holdings; dividends are automatically reinvested.
I currently view CVX as a more attractive investment opportunity than XOM.
Summary
- On August 27 2015 I initiated an ‘experiment’ to see whether CVX or XOM would be a superior investment over the long-term.
- It is critical that investors take into consideration the risk aspect of their investment and not just focus on potential return.
- The ‘experiment’ has only been running for 3.19 years but the CVX investment is, so far, much better than the XOM investment.
Introduction
I fully recognize 6 months is definitely not long-term when it comes to investing in equities…even more so when the companies are cyclical in nature. I do, however, view semi-annual/annual updates as a worthwhile exercise otherwise I will completely forget about my little ‘experiment’ which I started August 27, 2015. That is the day when I acquired 300 shares of Chevron Corporation (NYSE: CVX) and Exxon Mobil Corporation (NYSE: XOM) so I could see which company would generate the best investment return over a 20+ year timeframe.
Before proceeding further you may wish to read this article in which I provided my thought process regarding this ‘experiment’.
I also want to proactively address the point some investors may have when it comes to my decision to invest in these two companies…that point being that oil and gas companies are likely very poor long-term investments because they face significant headwinds as the automobile industry transitions from gas powered to electric vehicles.
I am fully aware of this risk. I also know that oil and gas has far more applications than to merely power vehicles.
‘Section 1A Risk Factors’ in CVX’s 2017 10-K and XOM’s 2017 10-K highlights multiple risks over and above the move away from gas powered vehicles. I appreciate these risks, understand them, and am willing to live with the consequences should some/all of these risks all hit at once. In exchange for taking on this risk I have looked at the reward aspect of my CVX and XOM investments and view the risk/reward trade-off as acceptable.
Another point I wish for you to take into consideration is that the results generated from my CVX and XOM holdings will likely differ from your results if you try to replicate my ‘experiment’ using my metrics. The reason you may note a variance is that these shares are held in non tax advantageous accounts. The reason for this is that I am a Canadian citizen and hold the shares being used in this ‘experiment’ in non-registered accounts; I have no contribution room available in our various retirement accounts. As a result, I incur a 15% withholding tax on dividend income generated from our US listed holdings. As a result, the amount automatically reinvested to acquire additional CVX and XOM shares is lower than what US residents receive.
FULL DISCLOSURE: In addition to being long the CVX and XOM shares included in this ’experiment’, I hold additional CVX shares in the FFJ Portfolio and I also own XOM and CVX shares in accounts for which I do not disclose details for privacy reasons.
Q3 Financial Results
The intent of this article is certainly not to delve into the details of how each company has performed from a financial perspective. I am, however, providing you with links to CVX’s and XOM’s Q3 Earnings Releases in the event you quickly want to look at how they have recently performed; the Q3 10-Q reports are unavailable as at the time I compose this article.
CVX Q3 Results
Various downloadable files related to CVX’s Q3 results can be found here. I also provide a few key images from CVX’s Q3 Earnings Presentation.


Source: CVX – Q3 2018 Earnings Presentation – November 2 2018
This CVX – November 2018 Investor Presentation provides additional information not reflected in the Q3 2018 Earnings Presentation.
XOM Q3 Results
Various downloadable files related to XOM’s Q3 results can be found here. I also provide a few key images from XOM’s Q3 Earnings Presentation.


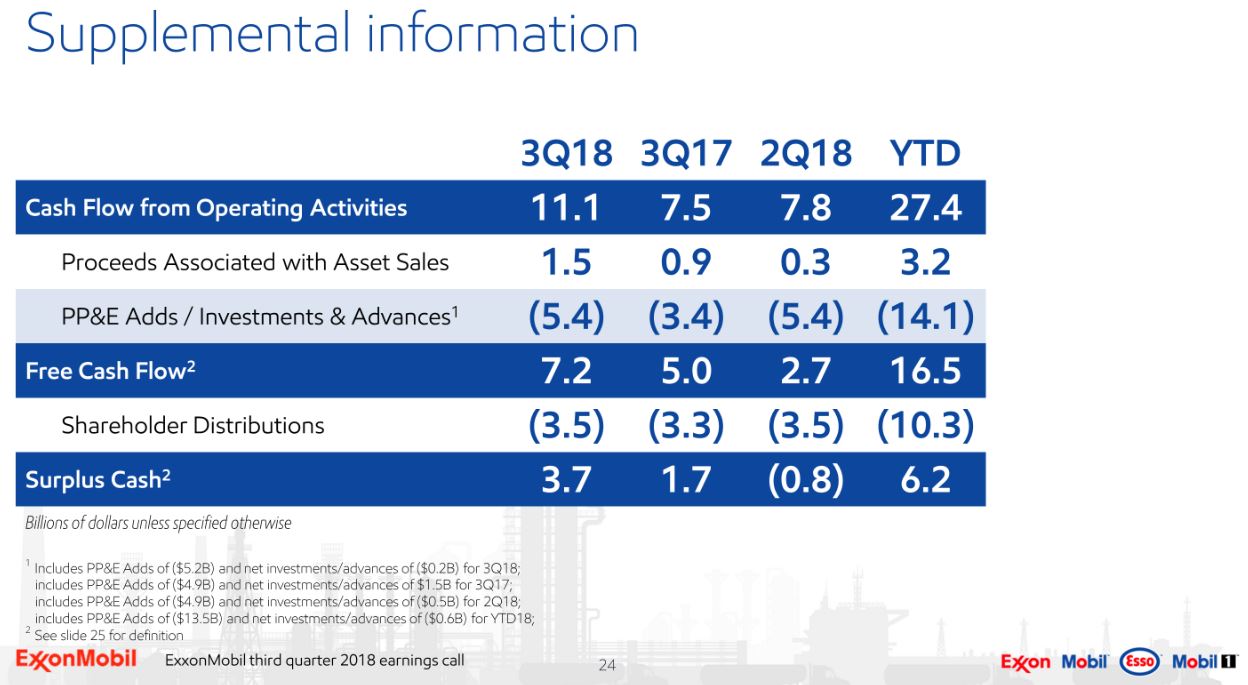
Source: XOM – Q3 2018 Earnings Presentation – November 2 2018
Credit Ratings
I think there are far too many investors who neglect to look at the level of risk they are assuming when making an investment. This was clearly borne out when I received feedback on my Owens & Minor (OMI) article. OMI is essentially a company:
- whose Free Cash Flow has been negligible for years;
- has increased its dividend by $0.01/year in 2014, 2015, 2016, 2017;
- had a ratings cut by Moody’s (April 2018) and S&P Global (May 2018) – Moody’s cut OMI to B1 ‘Highly Speculative’ from Ba1 (the company’s financials were so bad that Moody’s skipped the Ba2 and Ba3 ratings) and S&P Global downgraded OMI’s long-term debt to BB (middle tier of the non-investment grade speculative category) in May 2018;
- has experienced a gradual deterioration in its Receivables, Inventory, and Payables turnover for several years.
In my opinion, far too many investors look at the reward side of the coin and either totally neglect the risk side of the equation or perhaps they just have a far higher tolerance for risk than me. NOTE: This is NOT meant to be derogatory. I am just too far on in life to want to assume an inordinate level of risk.
CVX Credit Ratings
My assessment of a company’s credit risk includes the credit ratings assigned by major ratings agencies.
FULL DISCLOSURE: I own shares in Moody’s (MCO) and S&P Global (SPGI).
MCO rates CVX’s unsecured long-term debt Aa2; it was downgraded from Aa1 in April 2016. The Aa2 rating is the middle tier of the ‘High Grade’ category and is 2 notches lower than the coveted AAA rating.
SPGI rates CVX’s unsecured long-term debt AA- which is the lowest tier of the ‘High Grade’ category and is 3 notches lower than the coveted AAA rating.
XOM Credit Ratings
Moody’s rates XOM’s unsecured long-term debt AAA which is the top tier.
S&P Global rates XOM’s unsecured long-term debt AA+ (top tier of the High Grade category) which is one notch below the coveted AAA rating.
These are the types of ratings which give me some reassurance that I won’t wake up in the morning to learn of a dividend cut…or worse.
Valuation
Let’s compare CVX’s and XOM’s valuation based on full year earnings estimates for FY2018.
CVX is currently trading at $114.73 and YTD diluted earnings amount to $5.79. Adjusted earnings estimates from multiple analysts for FY2018 are $6.29 – $8.68. Using YTD results and analyst estimates I think adjusted EPS for the year will be ~$8. Using the current market price and my projected adjusted EPS estimate I get a forward adjusted PE of ~14.3. This level is certainly lower than the 5 year average PE of ~26.4 but you need to keep in mind that CVX’s results have fluctuated widely in the last 3 fiscal years; this distorts the 5 year average.
XOM is currently trading at $81.95 and YTD diluted earnings amount to $3.47. Adjusted earnings estimates from multiple analysts for FY2018 are $4.42 – $5.09. Using YTD results and analyst estimates I think adjusted EPS for the year will be ~$4.70. Using the current market price and projected adjusted EPS of $4.70 I get a forward PE of ~17.4. This level is certainly lower than that of the last couple of years but is only slightly lower than the 5 year average PE of ~20.
I view CVX as more attractively valued at the moment.
Dividend and Dividend Yield
CVX’s dividend history can be found here. I acquired the 300 CVX shares used for this ‘experiment’ when CVX’s quarterly dividend had stagnated at $1.07/share/quarter. I just could not fathom CVX keeping its quarterly dividend constant at this level in perpetuity and I certainly did not expect a dividend cut.
XOM’s dividend history can be found here. XOM didn’t hold its dividend constant like CVX.
When you compare how both companies have performed during the relatively short timeframe of this ‘experiment’, CVX is much further ahead even though its quarterly dividend was $1.07 Q2 2014 through Q3 2016.
CVX’s current dividend yield is ~3.90% and that for XOM is ~4.00%. I find this interesting because on the few occasions where I have looked at CVX and XOM over the past 2 -3 years, CVX’s dividend yield has typically been higher.
I know the dividend yield variance is negligible but some ‘yield chasers’ will opt to invest in XOM because of the nominally higher dividend yield.
If you look at the historical dividend payout ratios for both companies over the last few years using EPS figures you will likely get heart palpitations. Let’s however, look at how these companies have performed over the most recent 9 months.
CVX has generated $5.79 in diluted EPS and has paid out $3.36 in dividends YTD2018. Its Free Cash Flow is also very strong (refer CVX Q3 Results section of this article).
XOM has generated $3.47 in diluted EPS and has paid out $2.41 in dividends YTD2018. Its Free Cash Flow is also very strong (refer XOM Q3 Results section of this article).
CVX vs XOM Performance
As previously noted, I acquired 300 shares in each company on August 27, 2015.
 The CVX investment now stands at 325 shares and is valued at $37,280.75. That’s a $15,532.76 increase from my purchase price.
The XOM investment now stands at 324 shares and is valued at $26,535.60. That’s a $5,840.61 increase from my purchase price.
That’s a $9,692.15 variance!
I recognize 3.19 years is not ‘long-term’ but so far CVX has a pretty big lead on XOM!
If you own CVX or XOM and are interested in seeing how your investment has performed you may wish to access Tickertech where you can input your own start/end dates.
Using my purchase date and the most recent business date, a $10,000 investment in each company’s stock would look like the graph found below.

Source: Tickertech
NOTE: I am fully aware that my returns will differ from that reported by Tickertech since I incur a 15% withholding tax on all dividend payments.
Final Thoughts
I fully recognize that both companies have considerable debt on their respective Balance Sheet. I am not, however, concerned in that both are generating significant Free Cash Flow and are making headway when it comes to debt reduction. The 2 major ratings agencies also do not seem to be concerned given the attractive credit ratings accorded.
CVX is certainly a more volatile stock with a current beta of 1.1 versus XOM’s current beta of 0.86. I am not concerned about CVX’s higher volatility and have lived through their ‘highs’ and the ‘lows’.
Based on my opinion as to how both companies will likely perform over the next several years I hold 390 more CVX shares than XOM shares.
I have a full position in both companies and at the moment have no intention of acquiring additional shares other than the shares acquired through the automatic reinvestment of dividends. Were this not the case I would be acquiring CVX shares.
I wish you much success on your journey to financial freedom.
Thanks for reading!
Note: I sincerely appreciate the time you took to read this article. Please send any feedback, corrections, or questions to charles@financialfreedomisajourney.com.
Disclaimer: I have no knowledge of your individual circumstances and am not providing individualized advice or recommendations. I encourage you not to make any investment decision without conducting your own research and due diligence. You should also consult your financial advisor about your specific situation.
Disclosure: I am long CVX and XOM.
I wrote this article myself and it expresses my own opinions. I am not receiving compensation for it and have no business relationship with any company whose stock is mentioned in this article.