While low risk CME Group (CME) benefits from volatility, its share price is less volatile than the broad market. Its beta is just under 0.5!
Beta measures the expected move in a stock relative to movements in the overall market. If a stock’s beta exceeds 1.0, it suggests the stock is more volatile than the broader market. A beta less than 1.0 indicates a stock has a lower volatility. Investors, however, should keep in mind that Beta is a better indicator of short-term rather than long-term risk and provides no information about a company’s underlying fundamentals.
When I last reviewed CME in my December 10, 2023 post, the most currently available financial information was for Q3 and YTD2023. We now have Q1 2024 results thus prompting me to revisit this existing holding.
Business Overview
CME operates a derivatives marketplace which offers a range of futures and options products for risk management. Given the nature of its product offering, CME benefits from a volatile environment as investors increase their risk mitigation efforts in a higher risk environment.
I encourage you to review the company’s website and Part 1 of the FY2023 Form 10-K.
Financials
Q1 2024 Results
Revenue increased 3.2% from Q1 2023 to $1.49B, while EPS fell to $2.35 from $2.43. The drop in EPS was entirely due to a decrease in non-operating investment income.
The adjusted operating margin for Q1 2024 was 68.9%, up from 68.2% in Q1 2023.
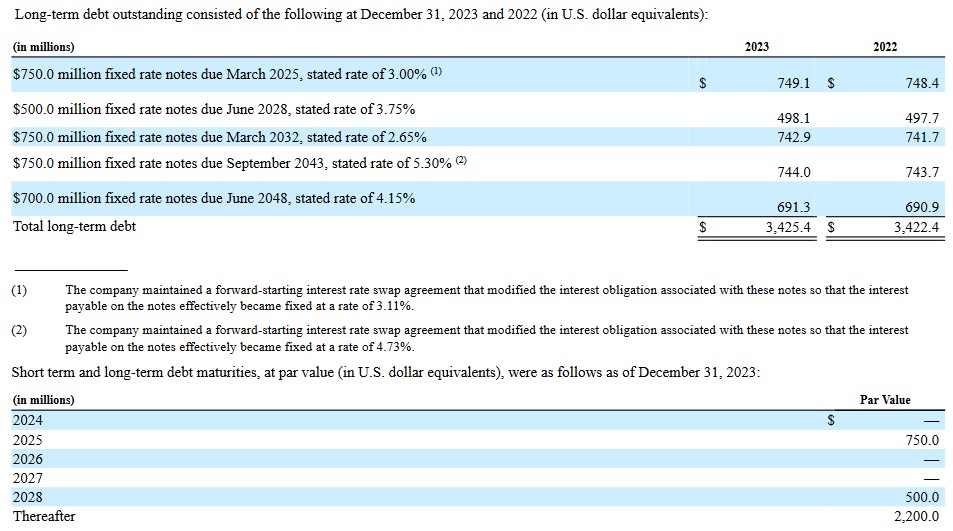
The following reflects the maturity dates of CME’s long-term debt at FYE2022 and FYE2023. At the end of Q1 2024, the the $0.75B fixed rate notes due March 2025 moved from a long-term to a short-term liability. This explains why CME’s short term debt is ~$0.75B higher than at the end of Q1 2024 than at FYE2023.
As noted earlier, CME benefits from market volatility and its performance in Q1 came about from the ever-growing need for risk management globally.
The Q1 average daily volume (ADV) of 26.4 million contracts was the 3rd highest quarterly ADV in CME’s history; general uncertainty around interest rates and inflation is likely acting as a temporary tailwind to CME’s results. The only higher quarters were Q1 2020 (the onset of the COVID pandemic) and Q1 2023 (significant bank turmoil in March 2023).
Despite no specific macro event or change in Federal Reserve rates occurring in Q1, CME had the highest January ADV to date, up 16% YoY. In February CME reported the highest monthly interest rate ADV in its history with 17.2 million contracts. Furthermore, it achieved quarterly ADV records for treasuries (7.8 million contracts) and overall options (5.9 million contracts). Both equity index and energy options reached all-time high levels.
CME’s non-U.S. ADV also reached a record level of 7.4 million contracts. This was driven largely by 38% growth in energy, 29% in agricultural products, and 7% in metals. In total, CME delivered 14% ADV growth across its physical commodity products to 4.7 million average daily volume, which included 16% YoY growth for both energy and agricultutal products.
On the Q1 earnings call, management reported that April’s activity has continued to build on many of these trends.
FY2024 Guidance
CME does not issue any guidance.
Credit Ratings
CME’s senior unsecured long-term debt ratings are the lowest tier of the high-grade category and are investment grade. These ratings define CME as having a VERY STRONG capacity to meet its financial commitments. It differs from the highest-rated obligors only to a small degree.
- Moody’s: Aa3 with a stable outlook (affirmed November 13, 2023)
- S&P Global: AA- with a stable outlook (affirmed January 22, 2024)
- Fitch: AA- with a stable outlook (affirmed February 13, 2024)
These ratings are acceptable for my risk tolerance.
Dividend and Dividend Yield
CME’s dividend history is accessible here.
CME has a somewhat unique dividend policy in that it distributes a variable dividend every mid-January. The amount distributed is dependent on the prior year’s results and what are the capital allocation priorities. If CME were planning to make a major acquisition, it would likely scale back the amount of the variable dividend.
When I wrote my prior post, CME had just declared a $5.25 annual ‘special dividend’ payable payable January 18, 2024 to shareholders of record on December 28, 2023.
I also stated that I anticipated CME would increase its $1.10 quarterly dividend to $1.15 when it declared its next dividend in early February; this did occur.
CME’s variable annual ‘special dividend’ is often comparable to the sum of the regular quarterly dividend payments in a given fiscal year. Since the value of the ‘special dividend’ is dependent on company performance and is not declared until early December, it is very difficult to calculate a forward dividend yield.
If CME distributes 3 more $1.15 quarterly dividends, increases the quarterly dividend in January 2025 to $1.20, and declares another $5.25 ‘special dividend in December for distribution in January 2025, investors can expect to receive $9.90 in dividends between now and the end of March 2025. With shares trading at ~$212.50, my estimate of the forward diluted dividend yield is ~4.66%.
In FY2014 – FY2023, the weighted average outstanding diluted dividends (in millions of shares rounded) was 336, 338, 339, 340, 344, 358, 359, 359, 359, and 360. In Q1, it was still ~360.
It is evident from CME’s dividend policy that dividend distributions take precedence over share repurchases.
Valuation
CME’s diluted PE in FY2011 – FY2023 is 12.92, 18.77, 27.53, 29.45, 24.22, 26.89, 33.12, 14.20, 35.28, 30.34, 33.70, 22.94, and 25.13.
When I wrote my October 30 post, CME’s forward adjusted diluted PE ratios (using the ~$209 share price) were:
- FY2023 – 16 brokers – mean of $9.15 and low/high of $8.97 – $9.33. Using the mean estimate, the forward adjusted diluted PE is ~22.8.
- FY2024 – 16 brokers – mean of $9.39 and low/high of $8.84 – $10.48. Using the mean estimate, the forward adjusted diluted PE is ~22.2.
- FY2025 – 13 brokers – mean of $9.72 and low/high of $8.97 – $10.53. Using the mean estimate, the forward adjusted diluted PE is ~21.5.
CME’s valuation at the time of my December 10, 2023 post, using a $211.62 share price and the current broker earnings estimates, were:
- FY2023 – 16 brokers – mean of $9.17 and low/high of $8.98 – $9.33. Using the mean estimate, the forward adjusted diluted PE is ~23.1.
- FY2024 – 16 brokers – mean of $9.40 and low/high of $8.84 – $10.48. Using the mean estimate, the forward adjusted diluted PE is ~22.5.
- FY2025 – 14 brokers – mean of $9.67 and low/high of $8.97 – $10.44. Using the mean estimate, the forward adjusted diluted PE is ~21.9.
CME’s current valuation using a ~$212.50 share price and the current adjusted diluted broker estimates are:
- FY2024 – 16 brokers – mean of $9.74 and low/high of $9.30 – $10.29. Using the mean estimate, the forward adjusted diluted PE is ~22.
- FY2025 – 16 brokers – mean of $9.97 and low/high of $9.31 – $10.92. Using the mean estimate, the forward adjusted diluted PE is ~21.3.
- FY2026 – 9 brokers – mean of $10.60 and low/high of $9.86 – $11.64. Using the mean estimate, the forward adjusted diluted PE is ~20.
I consider CME to currently be fairly valued.
Final Thoughts
There are no changes to the final thoughts reflected in my December 10 post.
CME was my 18th largest holding when I completed my 2023 Year End FFJ Portfolio Review.
I currently hold 461 shares in a ‘Core’ account and 340 shares in a ‘Side’ account within the FFJ Portfolio.
As noted in several recent posts, I am looking to acquire shares in great companies that have temporarily fallen out of favor with investors. It is, therefore, not my intention to increase my CME exposure other than through the automatic reinvestment of dividend income.
I wish you much success on your journey to financial freedom!
Note: Thanks for reading this article. Please send any feedback, corrections, or questions to finfreejourney@gmail.com.
Disclosure: I am long CME.
Disclaimer: I do not know your circumstances and am not providing individualized advice or recommendations. I encourage you not to make any investment decisions without conducting your research and due diligence. You should also consult your financial advisor about your specific situation.
I wrote this article myself and it expresses my own opinions. I am not receiving compensation for it and have no business relationship with any company whose stock is mentioned in this article.