
When I last reviewed West Pharmaceutical (WST) in my February 17 post, it had just released its Q4 and FY2023 results and FY2024 guidance. Despite management’s expectation of a challenging FY2024, I continued to like WST’s long term thesis and acquired another 50 shares @ ~$340.92 in a ‘Core’ account within the FFJ Portfolio.
I now revisit this existing holding given the recent release of Q1 2024 results and revised guidance.
Business Overview
I highly recommend referring to the company’s website and the FY2023 Form 10-K.
Financials
Q1 2024 Results
Please refer to WST’s Q1 Earnings Release and Earnings Presentation that are accessible from the company’s website.
In Q1 2024, WST reported:
- a ~3% reduction in net sales;
- adjusted operating profit margin of 17.7% which was a 530 bps decrease from Q1 2023;
- a ~16.2% decline in reported diluted EPS and a ~21.2% decline in adjusted-diluted EPS;
- a consolidated gross profit margin of 33.1%, down from 37.9% in Q1 2023; and
- an EPS decrease of ~23%, excluding a stock-based compensation tax benefit.
The Q1 Proprietary Products segment gross profit margin of 37% was 550 bps lower than in Q1 2023. The key drivers for the decline were lower sales volume and an unfavorable mix of products sold, partially offset by increased sales prices.
In Q1, Contract Manufacturing’s gross profit margin of 17% was 60 bps lower than in Q1 2023. This was primarily due to inflationary labor costs and an unfavorable mix of products sold, partially offset by increased sales prices.
WST continues to see inventory management or destocking by its larger mature customers that are working down their inventory closer to pre-pandemic levels.
This destocking is expected to persist in Q2. Customer order trends, however, continue to indicate a stronger second half of 2024 with a return to more typical order patterns in Q4.
On the capital expenditure front, WST is having an active year of capital expansion projects. These projects, once completed, will increase capacity to meet growing demand for both WST’s proprietary products and contract manufacturing segments.
In the Proprietary Products segment, there are expansion projects in several High Value Product (HVP) components manufacturing sites (ie. Jersey Shore (US), Kinston (US), Waterford (Ireland) and Eschweiler (Germany)). Here are WST’s locations.
These projects will provide a combination of increased manufacturing capacity, especially HVP processing, washing and sterilization and will bring a higher level of global standardization throughout WST’s network. Management is confident that once completed, these projects will position WST to address anticipated growing demand for HVP components from:
- volume growth of legacy drugs;
- recently launched or to be launched drugs; and
- potential conversions from legacy customers to higher levels of quality in response to the global regulatory changes.
In the near term, WST is layering in capacity through productivity optimization programs. Longer term, capacity is being added that incorporates automation to complement manual processes.
In WST’s Contract Manufacturing segment, WST continues to build out capacity at its Grand Rapids (US) site and there is significant expansion at its Dublin (Ireland) facility. Both expansions are in support of WST’s customer’s injection device platform. These expansions are critical to the overall volume growth that WST continues to experience given the growing demand for certain components associated with drugs for diabetes and obesity.
FY2024 Guidance
WST’s FY2024 guidance is:
- Consolidated Net Sales: $3B – $3.025B
- Adjusted-Diluted EPS: $7.63 – $7.88
Prior guidance was:
- Consolidated Net Sales: $3B – $3.025B
- Adjusted-Diluted EPS: $7.50 – $7.75
The first half of FY2024 is certainly challenging. Management, however, continues to expect improved growth along with stronger gross and operating margins in the second half of the year, with Q4 projected to be the strongest quarter.
For the full year, it is maintaining general core cost discipline while reinvesting into new growth initiatives.
Once the major expansion projects are completed, consistent top line growth of at least 5% is very possible. A core driver of this growth is the market for injectable drugs which is increasing due to the growing usage use of biologic drugs.
Operating Cash Flow (OCF) and Free Cash Flow (FCF)
When WST released its Q4 and FY2023 results, it provided FY2024 CAPEX guidance of ~$0.35B. Management is confident the long-term growth prospects remain intact. This explains why it is making capital investments to increase WST’s high-value product manufacturing capacity and/or contract manufacturing capacity.
Depreciation often serves as an indicator of how much needs to be invested to maintain assets in good operating condition. If, however, a company’s CAPEX greatly exceeds depreciation, it is fair to assume that management is investing to grow the business.
Looking at WST’s annual depreciation (in millions of $) of 133.7, 116.9, 116.9 versus annual CAPEX (in millions of $) 362.0, 284.6, 253.4 in FY2023 – FY2021 it is evident WST is investing for growth.
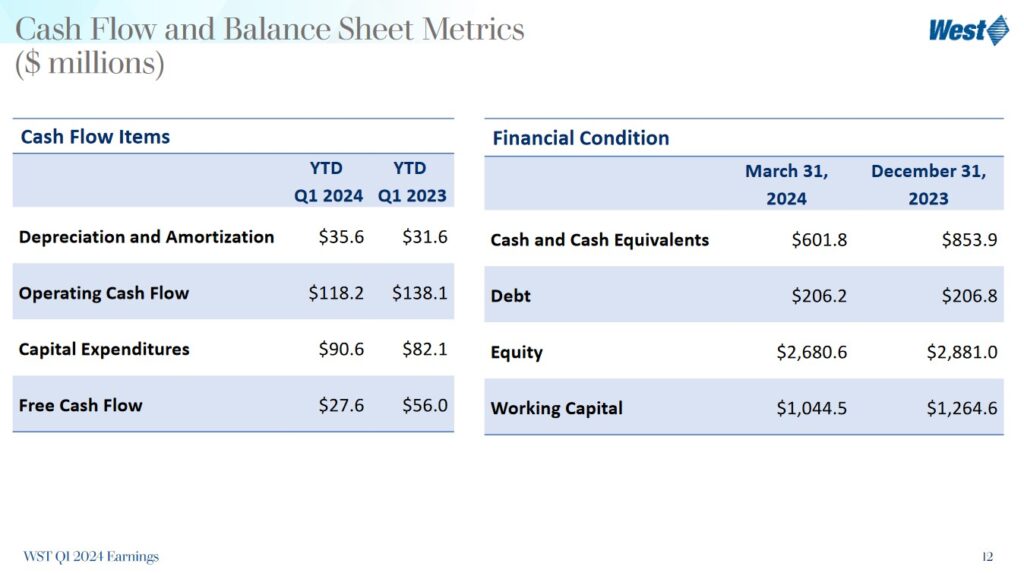
In Q1, CAPEX was $90.6 million which was $8.5 million higher than Q1 2023.
In FY2012 – FY2023, WST generated OCF of (in millions of $ approx): 183, 212, 219, 263, 289, 367, 473, 584, 724, and 777. OCF of ~$118.2 million in Q1 was a decrease of $19.9 million compared to Q1 2023. The 14.4% decrease was primarily due to a decline in operating results.
In FY2012 – FY2023, WST generated FCF of (in millions of $ approx): 55, 65, 71, 81, 49, 133, 184, 241, 298, 331, 439, and 415. Free cash flow in Q1 was $27.6 million, a decrease of 50.7%.
While WST’s weak Q1 OCF and FCF might alarm some investors, we need to step back and look at the long-term. WST is clearly investing for growth and weak results in the very short-term should not be cause for concern.
Return On Invested Capital (ROIC)
High quality companies generate a high ROIC. If a company generates a high ROIC, it needs to invest less to achieve a certain growth rate thus reducing the need for external capital.
In FY20214 – FY2023, WST’s ROIC (%) was 10.61, 8.05, 11.14, 10.98, 13.82, 14.05, 17.23, 27.6, 20.77, and 18.66. We also see that WST’s Revenue growth during the same time frame is (in billions of $) 1.421, 1.400, 1.509, 1.599, 1.717, 1.840, 2.147, 2.832, 2.887, and 2.950.
A company that generates $0.15/profit for every $1 invested, for example, achieves a ROIC of 15%. I consider a ~15%+ ROIC to be a reasonable minimum threshold because most of the time, a company’s cost of capital will be lower than this level. In the last few years, WST’s ROIC has exceeded 15%.
When a company consistently generates a high ROIC over the long term and it is growing its revenue, it can reinvest a portion of its profits under favorable conditions thereby leading to a compounding effect. I would much rather invest in a growing company that can reinvest to create greater shareholder value than to invest in a company that has limited growth opportunities and thus chooses to distribute a growing dividend.
Risk Assessment
No rating agency rates WST’s debt. However, WST’s cash flow and balance sheet metrics reflect a prudent use of debt.
By the beginning of FY2025, WST should have fully repaid $0.134B of its long-term debt leaving it with only the Series C notes that are due July 5, 2027.
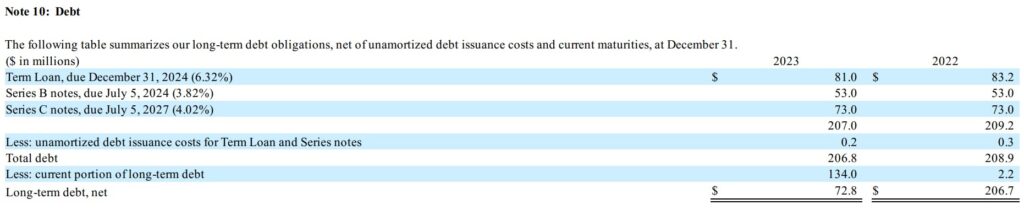
Various financial covenants in WST’s debt agreements include the need to maintain established interest coverage ratios and to not exceed established leverage ratios. The agreements also contain other customary covenants, none of which are restrictive to WST’s operations. At the end of Q1 2024, WST complied with all debt covenants.
The March 31, 2024 cash balance is ~$252.1 million lower than at FYE2023. The decrease is primarily due to $267 million of share repurchases and/or capital expenditures offset by cash from operations.
Dividends, Share Repurchases, and Stock Splits
Dividend and Dividend Yield
WST does have a dividend history. A WST investment, however, is typically not made for dividend income. This is a low dividend yielding company and the bulk of WST’s total long-term investment return is likely to continue to be derived from capital appreciation.
Share Repurchases
WST’s weighted average shares outstanding in FY2012 – FY2023 are (in millions of shares) 71.8, 71.4, 72.8, 73.8, 75, 75.8, 75.4, 75.4, 75.8, 76.3, 75.8, and 75.3. The diluted weighted average shares outstanding in Q1 2024 was ~74.3.
During the three months ended March 31, 2024 and 2023, there were 0.2 million and 0.3 million shares, respectively, from stock-based compensation plans not included in the computation of diluted net income per share because their impact was anti-dilutive.
In February 2023, the Board approved a share repurchase program under which WST may repurchase up to $1.0B of common stock. The share repurchase program does not have an expiration date. Furthermore, the number of shares to be repurchased and the timing of such transactions will depend on a variety of factors, including market conditions.
During the three months ended March 31, 2024, WST purchased 729,679 shares of its common stock under the program at a cost of $267.0 million, or an average price of $365.87/share.
Stock Splits
WST initiated a 2-for-1 stock split in September 2013.
Valuation
WST’s FY2012 – FY2023 diluted PE levels are 23.80, 31.65, 32.46, 47.05, 45.85, 39.47, 47.82, 49.29, 68.60, 58.12, 28.53, and 47.46.
I reference my August 3, 2023 post in which I calculated WST’s valuation at different points in time.
When I wrote my February 17 post, WST had just reported $7.88 and $8.08 of diluted EPS and adjusted diluted EPS in FY2023, respectively. With shares trading at ~$362, the diluted PE and adjusted diluted PE levels were ~46 and ~44.8.
It generated ~$414.5 million in FCF. With a weighted average number of diluted shares outstanding in FY2023 of 75.3 million, WST generated ~$5.50 of FCF/share. This gave us a P/FCF of ~65.8.
Management’s FY2024 adjusted diluted EPS guidance was $7.50 – $7.75. Using the ~$362 share price, the forward adjusted diluted PE range was ~46.7 – ~48.3.
The forward-adjusted diluted PE levels using the ~$362 share price and the current broker estimates were:
- FY2024 – 9 brokers – mean of $7.62 and low/high of $7.50 – $7.89. Using the mean estimate, the forward-adjusted diluted PE was ~47.5.
- FY2025 – 9 brokers – mean of $9.03 and low/high of $8.54 – $9.50. Using the mean estimate, the forward-adjusted diluted PE was ~40.
- FY2026 – 5 brokers – mean of $10.12 and low/high of $9.64 – $10.80. Using the mean estimate, the forward-adjusted diluted PE was ~35.8.
I anticipated that WST would generate a similar level of FCF in FY2024 as in FY2023. In addition, I anticipated the diluted weighted average outstanding shares would be similar to that in FY2023. I, therefore, expected WST’s P/FCF in FY2024 to be similar to the ~65.8 in FY2023. Having purchased additional shares @ ~$340, however, I acquired shares at a slightly more favorable valuation.
Management’s FY2024 adjusted diluted EPS guidance is now $7.63 – $7.88. Using April 26’s ~$360.50 closing share price, the forward adjusted diluted PE range is ~45.7 – ~47.2.
The forward-adjusted diluted PE levels using the ~$360.50 share price and the current broker estimates are:
- FY2024 – 9 brokers – mean of $7.73 and low/high of $7.63 – $8.13. Using the mean estimate, the forward-adjusted diluted PE is ~46.6.
- FY2025 – 9 brokers – mean of $9.04 and low/high of $8.31 – $9.50. Using the mean estimate, the forward-adjusted diluted PE is ~40.
- FY2026 – 5 brokers – mean of $10.02 and low/high of $9.38 – $10.75. Using the mean estimate, the forward-adjusted diluted PE is ~36.
I think WST’s FY2024 FCF might fall short of the $0.415B generated in FY2023. If it generates $0.39B and the diluted weighted average outstanding shares amount to ~74.5 million, WST should generate FCF/share of ~$5.23. Using the current ~$360.50 share price, I estimate a ~69 P/FCF in FY2024.
WST is spending a considerable amount on CAPEX to fuel its growth. Once the current projects are completed, we should see stronger OCF and FCF results because its annual maintenance CAPEX is closer to $130 million versus the ~$300 million it has been spending in recent years. I, therefore, think that WST’s annual FCF could exceed $0.5B within the next couple of fiscal years. If this happens, debt repayment coupled with share buybacks could result in a significant improvement in the current very high P/FCF ratio. Should this happen, we could see a significant uptick in WST’s share price.
West Pharmaceutical – Final Thoughts
As noted in several previous posts, I am looking to increase my exposure in great companies that appear to have fallen out of favor.
WST’s results are less than impressive when compared to Q1 2023. Investors, however, need to recognize that the weaker results are because WST’s customers are working down their inventory closer to pre-pandemic levels. In the second half of the current fiscal year, WST expects to generate superior results.
If I am correct, WST is very likely to have a much lower debt level by the beginning of FY2025 and it should generate a much higher level of FCF. This opens up various capital allocation possibilities that should reward shareholders.
On April 29, I intend to acquire an additional 50 shares in a ‘Core’ account within the FFJ Portfolio bringing my total exposure to 200 shares.
I wish you much success on your journey to financial freedom!
Note: Please send any feedback, corrections, or questions to finfreejourney@gmail.com.
Disclosure: I am long WST.
Disclaimer: I do not know your circumstances and do not provide individualized advice or recommendations. I encourage you to make investment decisions by conducting your research and due diligence. Consult your financial advisor about your specific situation.
I wrote this article myself and it expresses my own opinions. I do not receive compensation for it and have no business relationship with any company mentioned in this article.