Contents
![]()
There are some companies in the universe of publicly traded companies which should be avoided. Owens & Minor (NYSE: OMI) is one of them.
The company's financial performance has been deteriorating over the past few years and on October 31, 2018 it released Q3 and YTD 2018 results. Part of its earnings announcement included a ~71% dividend cut.
This dividend cut should not have come as a surprise as OMI's cash flow efficiency has been deteriorating and its credit rating was cut a few notches by Moody's just a few months ago.
Summary
- OMI released its Q3 results on October 31st much to the chagrin of its shareholders; the stock dropped ~44% on October 31st.
- OMI announced a $0.185/share reduction in its quarterly dividend effective with the upcoming Q4 dividend.
- The company’s financial performance has been dismal for several years and its death spiral has provided astute investors with ample time to exit their OMI position.
- With multiple companies in which one can possibly invest there is absolutely no reason why anyone should invest in OMI.
Introduction
I typically like to write articles about companies which I view as attractive long-term investments. Occasionally, however, I will write an article about a company where (after my analysis) I deem it to be the type of company that has absolutely no place in a portfolio of a relatively conservative investor such as me. I previously wrote an article well before General Electric’s (NYSE: GE) dividend cut in 2017.
This article is about one such company I think should not be in anyone’s portfolio. Given that there is a vast universe of high quality publicly traded companies, I can’t for the life of me fathom why anyone would even consider investing in Owens & Minor, Inc. (NYSE: OMI); the deterioration in this company’s performance has transpired over several years giving investors ample time to exit their position.
I am fully cognizant that we each have unique personal goals and objectives when it comes to investing, and therefore, not everyone reading this article desires to invest in the high quality profitable companies that appeal to me. Some investors are willing to go a bit further out on the risk scale but at this stage of a lengthy bull market I am of the opinion that investors should be dialing down the level of risk they are willing to assume.
I restrict full access to most of my articles to subscribers to my site but in this case, I am so adamant that investors should not invest in OMI that I am not restricting full access to this article.
Business Overview
Investors unfamiliar with OMI can learn more about the solutions it provides by accessing this segment of the company’s website.
I also very strongly recommend that readers access OMI’s most recent 10-K (FY2017) and review Item 1. Business in which OMI’s provides a comprehensive overview of the business, customers, asset management, competition, etc.
After reviewing this section of the 10-K I think you may come away with a similar observation as I have which is that OMI is akin to something in a vice.
This is a highly regulated industry both in the US and in Europe. In the US, OMI as well as two major nationwide manufacturers (Cardinal Health, Inc. and privately-held Medline, Inc.) also provide distribution services.
OMI also competes with a number of regional and local distributors that distribute products to patient's homes and which have customer self-distribution models.
Its major logistics competitors serving healthcare manufacturers in the US and in Europe include UPS, FedEx, FedEx, DHL, and Alloga, as well as local competitors in specific countries.
I have no details re: Medline and Alloga as they are not publicly traded companies. All the other companies referenced above, however, are far bigger than OMI and have far greater bargaining power than OMI.
Let’s look at the supply side of the ‘vice’. OMI’s supplier and manufacturer customers represent the largest and most influential healthcare manufacturers in the industry. While it has relationships with ~1,100 supplier and manufacturer customers, the domestic side of OMI’s business counts Medtronic, Johnson & Johnson, and Becton Dickinson as the largest suppliers. These companies accounted for ~11%, 9% and 9%, respectively of OMI’s consolidated net revenue for 2017. These companies are FAR larger than OMI!
So…you have a highly regulated industry, a highly price sensitive customer base, and much larger competitors (not sure why McKesson, CVS Health, AmerisourceBergen and others are not mentioned in OMI’s annual report). I am not quite sure what OMI brings to the table and judging from OMI’s stock price performance over the past several years I am not the only person thinking this way!
Q3 2018 Financial Results
On October 31st, OMI released its Q3 results. In a nutshell…BRUTAL!
This is a company that essentially trades dollars. Gross margin is in the low teens; for the 9 months ending September 30, 2018 gross margin was ~13.7% (it used to be lower).
This quarter’s Net Profit…negative as it recognized a ~$165.5 million Goodwill and Intangible Asset impairment charge.
As far as this company’s typical Operating Margin (when it isn’t incurring a Goodwill and Intangible Asset impairment charges)…sub 2%.
That really does not leave much margin for error and Q3 is a testament to that.
The all important Free Cash Flow metric (I view this as one of the key metrics when I make an investment decision)…say what? Look at this Free Cash Flow track record and you answer that question (2008 – 2017): 29, 143, 202, 32, 180, 80, -75, 233, 157, and 6; these figures are expressed in millions of dollars. How does that compare with a company that has been reporting over $9B in revenue annually for the past several years? Not to good in my opinion!
Cash Flow Efficiency
I typically don’t analyze companies as bad as OMI so I don’t have this section in my articles. In this case, I think this section is warranted.
I have looked at every OMI annual report going back to 2008. You can most certainly do so but chances are your time is far more valuable than mine so let me share the following with you.

Source: Morningstar – OMI Efficiency ratios
That is not a good trend. The only reason OMI has been able to keep its cash conversion cycle reasonably constant over the last few years is because the ‘Payables Period’ is being stretched. If you are an OMI supplier this is not sitting well with you. If someone used to pay you in ~27 days and now they are paying you in ~38+ days are you about to extend the same level of service or pricing to them?
Folks, this is NOT good.
Valuation
As I compose this article I see that OMI has dropped over 60% from its 52 week high. Quite frankly, I am surprised the drop is not greater than this.
In its Q3 Earnings Release, OMI indicated that based on expectations for the remainder of the year, as well as YTD financial results, adjusted net income per diluted share for FY2018 is expected to be $1.20 -$1.25. In its 3 page Q2 Earnings Presentation released August 7th the range was $1.40 - $1.50. At the time of the August 7th Press Release, OMI closed ~$15.41.
Using the mid-point of these earnings ranges, OMI had a forward adjusted PE of ~10.63 on August 7th. Now that OMI has released lower guidance and is trading at ~$8 as I compose this article, the forward adjusted PE is ~6.53.
While the valuation has improved, such a low PE ratio suggests to me that most astute investors know that OMI is pretty close to being on life support.
Credit Ratings
If you’re not in the habit of looking at how the major ratings agencies rate a company may I suggest you incorporate this as part of your analysis. You may not totally agree with the currently assigned rating but there are sophisticated investors who pay a ton of money for the comprehensive analysis performed by the likes of Moody’s and S&P Global. You may, therefore, want to at least look at how they currently rate a company and how those ratings are trending. (FULL DISCLOSURE: I own shares in both these companies).
Let’s have a look at how Moody’s rates OMI.
Whoa! OMI’s long-term debt rating was rated Ba1 (top tier of the non-investment grade speculative category) as recently as early November 2017 at which time the rating was placed under review with negative implications; the Ba1 rating had been upgraded from Ba2 in February 2012.
What happened in mid-April 2018? The rating was cut to B1.
How severe was that ratings downgrade? Well, Moody’s skipped Ba2 and Ba3 and went all the way to B1 which is the top tier of the ‘highly speculative ratings category’.
S&P Global downgraded OMI’s long-term debt to BB (middle tier of the non-investment grade speculative category) in May 2018. Given the recent results I anticipate S&P will place OMI’s ratings under review again.
Historical Performance
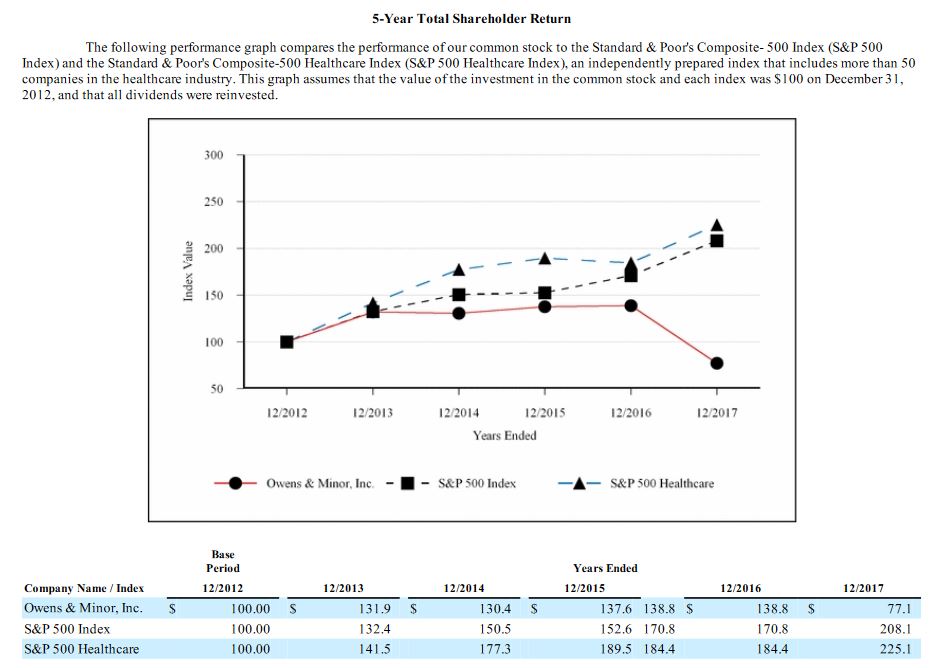
Perhaps OMI was a decent investment relative to the S&P500 at one point in time but have a look at how it has performed relative to the S&P500 over 5, 10, and 20 years. Investors have had ample time to exit their OMI exposure!


Source: Tickertech
Here is another nice chart extracted from page OMI’s FY2017 10-K (page 15 of 82).
Dividend, Dividend Yield, and Dividend Payout Ratio
OMI’s dividend history can be found here. I strongly suspect OMI has lulled investors into investing in the company with its reputation as being a company which has continually increased its dividend annually for many years in a row. Look closely at the dividend increases and you will see the dividend growth has been negligible for the past several years.
Heck, in 2013 – 2017 OMI’s annual dividend was $0.96, $1.00, $1.01, $1.02, and $1.03!
On October 31st, OMI’s Board of Directors approved a Q4 dividend payment of $0.075/share, representing a reduction of $0.185/share with the dividend being payable on January 2, 2019 to shareholders of record as of December 17, 2018. In essence the FY2018 dividend is $0.855/share.
Not quite sure why anyone would have been sticking around for OMI’s dividend. Sure, the dividend yield was above 7% just prior to the October 31st release of Q3 results but that alone should have been a warning sign for any investor that OMI was a high risk investment with a risk of a dividend cut.
You would think that the results on an individual share basis might have improved given that OMI’s weighted average shares outstanding (diluted) has dropped from 62,117 million in FY2015 to 60,022 million for the 6 months ending June 30, 2018!
If you look at OMI’s share price over a 3 year period you will see that the share repurchases made over in recent years at elevated prices has essentially destroyed shareholder value.
Final Thoughts
At the end of all my articles I either indicate whether I hold shares in the company covered, intend to acquire shares, or intend to acquire shares when more fairly valued.
In the case of OMI I am at a loss as to why anyone would want to invest in this company given how the company has performed in recent years. I will confess, however, that every investor is unique so if you elect to be an OMI investor I, truly and sincerely, wish you all the very best.
As for me…I do not intend to acquire shares in OMI during my lifetime.
I wish you much success on your journey to financial freedom.
Thanks for reading!
Note: I sincerely appreciate the time you took to read this article. Please send any feedback, corrections, or questions to [email protected].
Disclaimer: I have no knowledge of your individual circumstances and am not providing individualized advice or recommendations. I encourage you not to make any investment decision without conducting your own research and due diligence. You should also consult your financial advisor about your specific situation.
Disclosure: I do not currently hold a position in OMI and do not intend to initiate a position within the next 72 hours.
I wrote this article myself and it expresses my own opinions. I am not receiving compensation for it and have no business relationship with any company whose stock is mentioned in this article.