 Summary
- Making money in equities involves finding well managed companies that are undervalued.
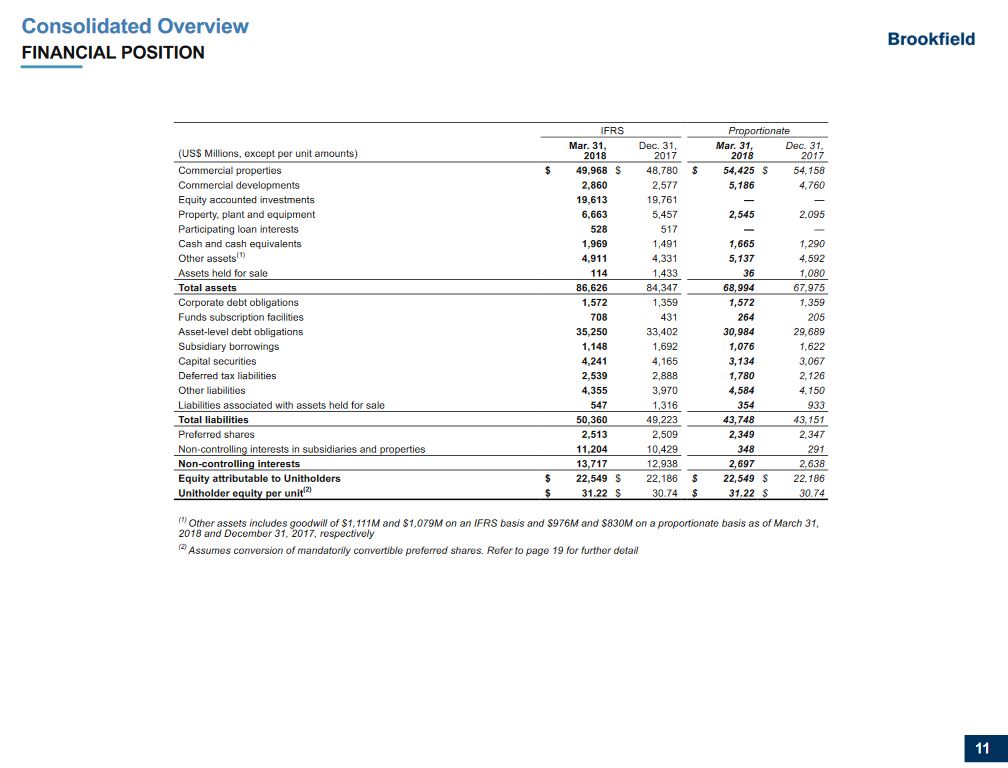
- As at the end of Q1 2018, this entity had a ‘unitholder equity per unit’ value roughly 1.6xs that of the market price per unit.
- Sometimes companies can remain undervalued for extended periods, and therefore, an attractive and sustainable dividend yield allows you to be a patient investor.
Introduction
I recently attended the Annual General Meeting (‘AGM’) of a company in which I hold shares in various accounts and in the FFJ Portfolio; the company in question is one for which I have written various articles.
This company is a leading global alternative asset manager, focused on investing in long-life, high-quality assets across real estate, renewable power, infrastructure and private equity. It provides a wide variety of investment products to its investors including private funds, listed issuers, and public securities.
The subject company has certainly rewarded shareholders over the long-term. I am also impressed that the company’s interests are aligned with its investors because it invests large amounts of its own balance sheet capital in its funds; the company is typically the largest investor in its private funds and the largest investor in each of its four flagship publicly listed partnerships.
During this AGM, the Senior Managing Partner, CEO and Director specifically commented on the unit value of one of its 4 publicly listed partnerships. The subject partnership continues to generate strong operational results and attractive returns from capital recycling initiatives from both balance sheet assets and private real estate funds. Management, however, is of the opinion investors are undervaluing the units of this partnership.
This flagship publicly listed partnership’s ongoing asset sales program continues to yield strong returns. It is very active in the capital markets with strategic exits out of both stabilized core properties in high-demand markets and from assets in maturing private funds. It also continues to recycle capital within its opportunistic funds strategy.
This partnership generates substantial cash returns from its fund investments when assets or businesses are sold, and these amounts are not reflected in funds from operations (FFO). These cash returns represent a major portion of the 18% target returns on capital and are a key factor in determining the distribution policy which has established a track record of annual growth of between 5 – 8%.
In this article I present my rationale as to why I will be acquiring additional units in this publicly listed partnership which currently provides investors with a dividend yield of ~6.65%.
Business Overview
Brookfield Asset Management (TSX: BAM.a and NYSE: BAM) owns and operates property assets primarily through its 64% fully diluted economic ownership interest in Brookfield Property Partners, L.P. (TSX: BPY.un and NYSE: BPY) which it spun off in April 2013. BPY owns property assets directly as well as through privately managed funds.
A comprehensive overview of BPY’s business can be found on page 50 of 334 in BPY’s 2017 Annual Report. Risk factors identified by BPY can be found in section 3.D. Risk Factors which commences on page 24.
This chart found on page 60 of the 2017 Annual Report provides a high level overview of BPY’s ownership and organizational structure.

I typically compare the performance of the company I am analyzing with the S&P500 over various time periods on the basis of reinvested dividends / no dividends reinvested. In the case of BPY I think a better comparison is by comparing the stock’s performance over a 5 year timeframe with the performance of various REIT ETFs.
None of the following ETFs have exposure to BPY since it is not truly a REIT. The ETFs with which I have chosen to compare BPY’s stock chart are:
- SPDR Dow Jones REIT ETF (NYSE: RWR)
- Schwab U.S. REIT ETF (NYSE: SCHH)
- Wilshire US REIT ETF (NYSE: WREI)
- First Trust S&P REIT Index Fund (NYSE: FRI)
- iShares Cohen & Steers REIT ETF (NYSE: ICF)
Looking at the 5 year stock chart does not put BPY in a positive light.

Source: Yahoo Finance
If we look at the following table, however, BPY’s 1-year performance is not that far out of line to that of the above noted ETFs. At least with BPY you don’t incur nearly as much volatility as with the ETFs.

Source: Capital Cube
BPY’s properties are classified under 3 areas of operation.
Core Office
BPY owns interests in and operates commercial office portfolios, consisting of 147 properties totaling 100 million square feet of office space. The properties are located primarily in the world’s leading commercial markets, such as New York, London, Los Angeles, Washington, D.C., Sydney, Toronto and Berlin.
It also develops office properties on a selective basis; active development projects consist of interests in six sites totaling 6 million square feet.
Core Retail
The core retail portfolio consists of interests in 125 regional malls and urban retail properties totaling 122 million square feet in the United States and Brazil, which are held primarily through a 34% equity interest in GGP (see GGP Transaction section below).
The retail mall portfolio has a redevelopment pipeline that exceeds $0.513B of development costs on a proportionate basis.
Opportunistic
BPY owns and operates global portfolios of property investments through opportunistic real estate funds, which are targeted to achieve higher returns than the core office and retail portfolios. The opportunistic portfolios consist of high-quality assets with operational upside across the office, retail, multifamily, industrial, hospitality, triple net lease, self-storage, manufactured housing and student housing sectors.
BPY is focused on increasing the value of properties through proactive leasing and select redevelopment initiatives, as well as recycling capital from mature properties, primarily core office assets, to fund new higher yielding investments, particularly in its opportunistic real estate business.
As at FYE2017 (December 31), there was a $6.8B capital backlog which gives BPY the opportunity to deploy additional capital throughout the portfolio for planned capital expansion that should continue to increase earnings for the next several years as these projects are completed. This includes development projects in progress across premier office buildings, retail malls, and mixed-use complexes located primarily within North America and Europe.
The retail sector has been experiencing considerable upheaval as consumers increasingly resort to online shopping. This has resulted in the decimation of several malls as tenants close stores.
BPY, however, focuses on operating and developing high-quality shopping centers. These destinations continue to provide an attractive physical location for retailers and continue to demonstrate meaningful outperformance, relative to lower tier malls, despite the changing retail landscape.
Plans are to continue to acquire properties through global opportunistic private funds as these generally produce higher returns relative to core strategies. These funds have a wide scope in terms of real estate asset classes and geographic reach. Funding for these transactions will continue to include proceeds from asset sales as part of the capital recycling program.
GGP Transaction
As evidence of its confidence in its Core retail growth strategy, BPY and GGP Inc. (NYSE: GGP) announced on March 26, 2018 a definitive agreement for BPY to acquire all of the outstanding shares of common stock of GGP other than those shares currently held by BPY and its affiliates for a total purchase price is $15B. Over a period of time, BPY acquired a ~34% ownership in GGP when GGP filed for bankruptcy protection in April 2009.
GGP owns 125 retail properties in the U.S., including Fashion Show in Las Vegas, Park Meadows in Lone Tree, Colorado, Water Tower Place in Chicago, Oakbrook Center in Oak Brook, Illinois, and the Shops at Merrick Park in Coral Gables, Florida.
The $15B purchase price is comprised of a fixed amount of $9.25B of cash and approximately 254 million units of BPY or an equivalent equity instrument that will be issued on the close of the transaction.
Funding of the cash component of the transaction is expected to be made through approximately $4B of asset sales, with the balance funded through debt at the GGP level; this debt will be non-recourse to BAM or BPY.
Following closure of this transaction, BAM expects its ownership of BPY to be ~50%. Management is of the opinion that privatizing GGP through this transaction will provide it with the opportunity to optimize the use of GGP’s top tier malls thus enabling it to maximize value to investors.
Details about the GGP transaction can be found on page 3 of 5 in BAM’s Q1 Letter to Shareholders.
Q1 2018 Results
BPY’s Q1 2018 Earnings Release can be found here and its Letter to Unitholders can be found here.
I strongly recommend you review BPY’s highly detailed Q1 2018 presentation. Having said this, here are key pages extracted from the presentation.


 Source: BPY Q1 2018 Supplemental Information
BAM and its four flagship publicly listed partnerships have built business around assets and businesses that are resilient through market cycles and deliver robust returns. The BAM group’s extensive experience investing in, owning, and operating real assets has enabled it to successfully underwrite acquisitions and to enhance returns through expertise in operational improvements, financing strategies and execution of development projects.
Financial returns are represented primarily by the combination of fees earned as an asset manager as well as capital appreciation and distributions from its invested capital.
The primary performance measure is funds from operations (“FFO”) which is used to evaluate operating performance. A description of FFO can be found in BPY’s 2017 Annual Report on page 67 of 334.
Looking at the supplemental information images provided above, we see that BPY generated USD $0.38 and USD $0.34 in FFO in Q1 2018 and Q1 2017, respectively. When we include realized gains (BPY is opportunistic and sells properties when it feels it can redeploy sale proceeds into other assets which will generate superior returns), then these figures increase to USD $0.87 and USD $0.63 in Company FFO and realized gains per unit in Q1 2018 and Q1 2017, respectively.
Looking at the following page from the presentation, we see that the ‘unitholder equity per unit’ as at the end of Q1 2018 is USD $31.22. Each BPY unit, however, is trading at USD$ 18.96 (CDN$24.97) which would suggest that each unit is currently undervalued by USD $12.26.
 Source: BPY Q1 2018 Supplemental Information
Dividend, Dividend Yield, Dividend Payout Ratio
BPY’s dividend history can be found here.
Distributions in Q1 2018 and Q1 2017 were USD $0.315 and USD $0.295. Company FFO and realized gains per unit more than adequately covered these payouts.
At the recent AGM, Bruce Flatt (Senior Managing Partner, CEO and Director) indicated that Company FFO and realized gains per unit is expected to continue to grow over the long-term. This is because an increasing number of sovereign and institutional investors are becoming aware of BAM’s and its publicly listed partnerships abilities to invest money very astutely. As more money is attracted for deployment into assets which will generate long-term favorable returns, this should translate into increases in FFO and realized gains per unit.
Investors should not expect any significant growth in the quarterly distribution. The reasoning for this is that management is confident it can generate superior returns for shareholders by retaining funds for future deployment.
The current USD $1.26 annual dividend yields ~6.65% on the basis of the July 2nd closing stock price of USD $18.96. I don’t see any risk of BPY being unable to continue to service its dividend hence the title of my article ‘Get Paid to Wait for This Undervalued Company to Appreciate in Value’.
Credit Ratings
Both Moody’s and S&P Global rate BAM’s long-term debt but not BPY.
Moody’s rates BAM’s long-term debt Baa2 (mid-lower medium grade) and S&P Global rates it A- (low upper medium grade).
Final Thoughts
Making money by investing in companies is achieved by investing in well-managed companies when they are undervalued / fairly valued.
In my opinion the long-term outlook for BPY is attractive. I also like that BPY is currently undervalued by USD $12.26.
I have no idea when BPY will become fairly valued but until such time as this occurs, I will gladly accept a ~6.65% dividend yield and will be acquiring additional BPY units (the TSX listed units) within the next 72 hours.
Thanks for reading!
Note: I sincerely appreciate the time you took to read this article. Please send any feedback, corrections, or questions to charles@financialfreedomisajourney.com
Disclaimer: I have no knowledge of your individual circumstances and am not providing individualized advice or recommendations. I encourage you not to make any investment decision without conducting your own research and due diligence. You should also consult your financial advisor about your specific situation.
Disclosure: Long BPY.un.
I wrote this article myself and it expresses my own opinions. I am not receiving compensation for it and have no business relationship with any company whose stock is mentioned in this article.