
In my May 10 post, I disclose my decision to initiate a 200-share Agilent Technologies (A) position @ ~$127/share in a ‘Core’ account within the FFJ Portfolio.
On June 9 and July 6, I acquired an additional 100 shares @ ~$115.96/share and ~$118.48/share. These purchases lowered my average cost to ~$122.35 and brought my total exposure to 400 shares.
When I initiated my A exposure, the most current financial information was as of February 28 (end of Q1). Now that A has released Q3 and YTD2023 results following the August 15 market close, I revisit this holding.
Business Overview
A history timeline is accessible here.
A is a global leader in life sciences, diagnostics and applied chemical markets. It provides application-focused solutions that include instruments, software, services and consumables for the entire laboratory workflow.
It consists of 3 business groups:
- life sciences and applied markets;
- diagnostics and genomics; and
- Agilent CrossLab.
A comprehensive overview of each group is provided in Item 1 – Business in A’s FY2022 Form 10-K.
A good company overview is also found in A’s 2023 JP Morgan Healthcare Conference presentation.
Annual revenue in FY2013 – FY2022 (in Billions of USD) was $3.894, $4.048, $4.038, $4.202, $4.472, $4.914, $5.163, $5.339, $6.319, and $6.848.
FY2023 revenue guidance is currently $6.8B – $6.85B, down from the $7.03B – $7.1B guidance at the time of my prior review.
CEO and NEO Compensation
Please refer to my May 10 post.
Financials
Q3 and YTD2023 Results
Material related to A’s Q3 2023 earnings release on August 15 is accessible here.

A’s Q3 revenue of ~$1.67B is at the top end of management’s expectations. However, the business environment in China is weakening thus translating into a more challenging market environment than anticipated.
With the softer market conditions in China and continued global macroeconomic challenges, A is not assuming any improvement in the China market for the remainder of the year.

Source: A – Q3 2023 Earnings Presentation – August 15, 2023
Asset Impairment
In March 2021, A announced its intent to acquire Resolution Bioscience for $0.55B in cash at closing and up to an additional $0.145B based on achieving future performance milestones.
The market for kitted Next Generation Sequencing (NGS) based companion diagnostics, however, has not developed as expected. Furthermore, A does not see a realistic path to profitability. It is, therefore, shutting down the business. This explains the $0.291B pre-tax charge in Q3 ($0.277B asset impairments + $0.14B transformational initiatives). This charge, which is excluded from non-GAAP results, includes an impairment write-down along with charges associated with the wind-down and exit of the business; the wind-down is expected to continue through Q4 and into early FY24.
Were it not for ~$0.98/share in adjustments related to these two line items, A’s Q3 diluted EPS would be ~$1.36 ($0.38 + $0.94 + $0.04) and its YTD diluted EPS would be ~$3.57 ($1.19 + $1.02 + $1.36).

Free Cash Flow (FCF)
In FY2013 – FY2022, A generated FCF of (in millions of $): 957, 526, 414, 654, 713, 910, 865, 802, 1,297, and 1,021. In Q3, A’s cash flow from operations was ~$0.562B and CAPEX was ~$0.081B. YTD, FCF is ~$1.042B ($1.256B net cash provided by operating activities minus $0.214B investments in property, plant and equipment).
FY2023 Guidance
Looking at the Q1 and Q2 2023 guidance (see below), we see that A increased its FY2023 guidance following a strong start to FY2023.
A, however, is now encountering its most difficult quarterly comparison in China where it grew ~44% in Q4 2022. This upcoming Q4, A expects to decline in the mid 30’s YoY. For FY2023, A expects China to decline by mid-single digits versus mid-single-digit growth. This has led to a lowering of FY2023 guidance with the release of Q2 and Q3 earnings.
Despite a reduction in adjusted diluted EPS guidance, A has posted strong year-to-date FCF results. A is, therefore, increasing its FY2023 FCF forecast to $1.2B. This is comprised of ~$1.5B of operating cash flow and ~$0.3B of CAPEX resulting in a ~$0.25B increase million from the midpoint of previous guidance.

Source: A – Q3 2023 Earnings Presentation – August 15, 2023


Credit Ratings
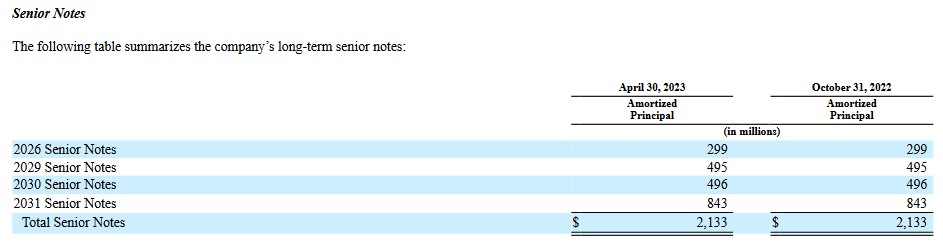
A does not have debt maturities until April 15, 2025 at which time a $0.6B Term loan matures.
A’s Q3 2023 Form 10-Q is unavailable as I compose this post. The liabilities at the end of Q2 and Q3, however, are relatively similar. I, therefore, reference A’s Q2 2023 Form 10-Q in which we see the maturity dates of A’s Senior Notes (commences on page 26).
As I compose this post, A’s website reflects the following credit ratings.
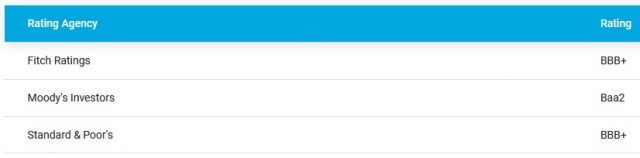
Moody’s website, however, indicates that it upgraded A’s assigned credit rating from Baa2 to Baa1 on May 3, 2023. Now, all three ratings are the top tier of the Lower Medium Grade investment grade credit rating.
S&P Global completed its most recent review on July 21 and upgraded A’s outlook from Stable to Positive.
Fitch completed its most recent review on June 30 and affirmed A’s BBB+ rating with a Stable outlook.
All three rating agencies define A as having an adequate capacity to meet its financial commitments. However, adverse economic conditions or changing circumstances are more likely to lead to a weakened capacity of A to meet its financial commitments.
Dividends, Share Repurchases, and Stock Splits
Dividend and Dividend Yield
A distributes a quarterly dividend. The dividend yield, however, is typically under 1% so investors who fixate on dividend metrics may deem A to be an unattractive investment.
Dividend metrics are of little importance in my investment decision-making process. My interest lies in an investment’s total potential investment return.
I envision the bulk of A’s future total investment return will continue to be predominantly capital appreciation.
Share Repurchases
A’s weighted average shares outstanding in FY2013 – FY2022 are (in millions of shares) 345, 338, 335, 329, 326, 325, 318, 312, 307, and 300. The diluted weighted average shares outstanding in Q1, Q2, and Q3 are 297, 297, and 295.
Despite the challenging macroeconomic conditions, A maintains its balanced capital allocation strategy. In Q3, it repurchased shares worth $0.335B for a YTD total of ~$0.495B.
In Q2 2023, A repurchased and retired 606,089 shares for ~$85 million.

Source: A – Q2 2023 Form 10-Q
In Q1 2023, A repurchased and retired 499,349 shares for ~$75 million.

Source: A – Q1 2023 Form 10-Q
Stock Splits
A’s 1 historical stock split occurred on November 3, 2014. The split consisted of 1398 for 1000.
Valuation
A’s FY2013 – FY2022 diluted PE levels are 27.23, 27.48, 31.92, 32.54, 31.89, 69.55, 25.31, 51.52, 40.52, and 35.80.
When I last reviewed A, management’s FY2023 adjusted diluted EPS guidance was $5.65 – $5.70 with $5.675 being the mid-point. I acquired shares at ~ $127. Using the $5.675 mid-point and my share price, the forward adjusted diluted PE was ~22.4.
I also determined, A’s forward-adjusted diluted PE using my purchase price and broker estimates.
- FY2023 – 18 brokers – mean of $5.69 and low/high of $5.66 – $5.75. Using the mean estimate, the forward-adjusted diluted PE is ~22.3.
- FY2024 – 18 brokers – mean of $6.30 and low/high of $6.14 – $6.53. Using the mean estimate, the forward-adjusted diluted PE is ~20.2.
- FY2025 – 13 brokers – mean of $7.04 and low/high of $6.80 – $7.56. Using the mean estimate, the forward-adjusted diluted PE is ~18.
When A released its Q2 and YTD2023 results and revised FY2023 guidance, I used management’s revised FY2023 guidance of $5.60 – $5.65 ($5.625 mid-point) to determine if I should average down.
Using my ~$115.96 June 9 purchase price, the forward adjusted diluted PE level was ~20.6.
Using my ~$118.48 July 6 purchase price, the forward adjusted diluted PE level was ~21.1.
The current mid-point of management’s FY2023 adjusted diluted EPS guidance is $5.415. With shares trading at ~$122, the forward adjusted diluted PE is ~22.5.
Using current broker estimates, A’s forward adjusted diluted PE is:
- FY2023 – 19 brokers – mean of $5.36 and low/high of $3.77 – $5.62. Using the mean estimate, the forward-adjusted diluted PE is ~22.8.
- FY2024 – 19 brokers – mean of $5.70 and low/high of $4.04 – $6.19. Using the mean estimate, the forward-adjusted diluted PE is ~21.4.
- FY2025 – 15 brokers – mean of $6.29 and low/high of $4.12 – $6.82. Using the mean estimate, the forward-adjusted diluted PE is ~19.4.
Looking at A’s valuation from an FCF perspective, we have management’s revised FY2023 guidance of ~$1.2B. The diluted weighted average shares outstanding for the quarter ended July 31 is ~295 million. Divide the guidance by the shares outstanding and we arrive at ~$4.07. Using the current ~$122 share price, we get a forward P/FCF value of ~30. In comparison, A’s P/FCF in FY2013 – FY2022 is 17.1, 19.5, 28.5, 18.9, 24.6, 20.2, 26.6, 40.2, 33.0, and 34.2.
Final Thoughts
In several recent posts, I state my desire to acquire shares in high-quality companies that have fallen out of favour. A strikes me as such a company.
If A’s dividend history is a precursor of what we can expect, negligible dividend increases are what shareholders can likely expect going forward. A, however, is generating strong FCF and with no significant debt maturities until 2025, I expect further share repurchases as part of A’s capital allocation…especially if A’s shares are undervalued; A has reduced the weighted average of outstanding shares by ~50 million from FY2013 and Q3 2023.
I remain confident about the long-term growth prospects of A’s end markets and think the near-term challenges are transitory. While A’s undervalued shares present a buying opportunity, I am eyeing other existing holdings in which I wish to increase my exposure. I am not, therefore, adding to my exposure at this stage. If, however, A’s share price were to plunge, I would consider acquiring additional shares. Naturally, much would depend on the valuation of other companies I am eyeing.
I wish you much success on your journey to financial freedom!
Note: Please send any feedback, corrections, or questions to finfreejourney@gmail.com.
Disclosure: I am long A.
Disclaimer: I do not know your circumstances and do not provide individualized advice or recommendations. I encourage you to make investment decisions by conducting your due diligence and research. Consult your financial advisor about your specific situation.
I wrote this article myself and it expresses my own opinions. I do not receive compensation for it and have no business relationship with any company mentioned in this article.