I regret not having requested approval from my employers’ compliance teams to permit me to invest in many of the companies with which I had dealings over the years as many of these companies have gone on to generate extremely attractive total investment returns.
Agilent Technologies (A) is one such company.
I initially became aware of Agilent Technologies (A) in 1999 when I was part of the team tasked with working with Hewlett-Packard Company to create new Canadian banking and cash management arrangements in preparation for the A spin-off.
A $10,000 investment in A when it became a publicly traded company would now be valued at ~$47,000 (assuming I reinvested the quarterly dividends).
Fast forward almost a quarter of a century and I finally have A exposure! On May 10, I initiated a 200 share position @ ~$127/share in one of the ‘Core’ accounts within the FFJ Portfolio.
When I previously reviewed A in this July 20, 2019 post, I considered shares to be fairly valued. However, I concluded that I would wait for a better entry point.
Big mistake!
Fast forward almost 4 years and A’s current valuation is once again almost identical to when I wrote my previous post.
Business Overview
A history timeline is accessible here.
A is a global leader in life sciences, diagnostics and applied chemical markets. It provides application-focused solutions that include instruments, software, services and consumables for the entire laboratory workflow.
It consists of 3 business groups:
- life sciences and applied markets;
- diagnostics and genomics; and
- Agilent CrossLab.
A comprehensive overview of each group is provided in Item 1 – Business in A’s FY2022 Form 10-K.
A good company overview is also found in A’s 2023 JP Morgan Healthcare Conference presentation.
Annual revenue in FY2013 – FY2022 (in Billions of USD) was $3.894, $4.048, $4.038, $4.202, $4.472, $4.914, $5.163, $5.339, $6.319, and $6.848. FY2023 Revenue guidance is currently $7.03B – $7.1B.
CEO and NEO Compensation
I reference A’s 2023 Proxy Statement which includes an explanation of how A’s CEO and Named Executive Officers (NEO) are compensated.
I am particularly interested in understanding how these senior executives are compensated. If the long-term incentive component makes up a large percentage of their compensation, I envision that decisions will be made that are closely aligned with the interests of long-term shareholders.
The chart below illustrates the percentage weighting of each compensation element that comprises the 2022 compensation for the CEO and the average for the other NEOs.
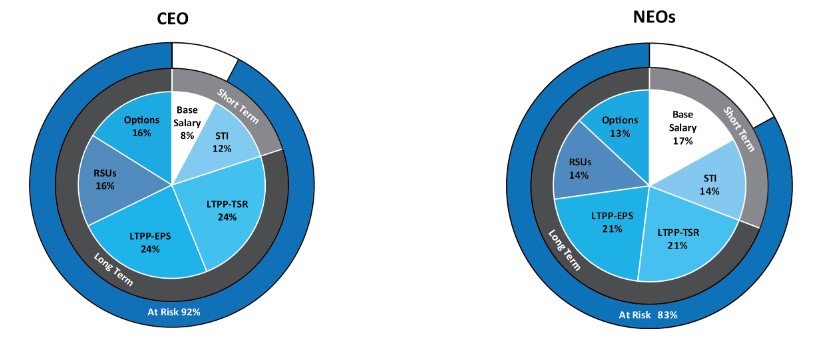
For 2022, 92% of A’s CEO’s pay was at risk and subject to the attainment of specific performance goals.
The Performance-Based Compensation Plan’s financial goals were based on:
- A’s adjusted operating margin percentage and revenue;
- the operating margin percentage and revenue goals for each of the business units.
The Compensation Committee chose those metrics because:
- operating margin keeps the focus on expense discipline and meeting efficiency measures; and
- revenue places focus on delivering strong top-line growth results.
The financial targets that must be met to receive the target payout are based on A’s financial plan. Non-GAAP adjusted operating margin is used because it excludes the ongoing impact of certain mergers and acquisitions, currency, hedging and interest costs related to mergers and acquisitions.
Further details are found in the 2023 Proxy Statement.
Financials
Q1 2023 Results
Material related to A’s Q1 2023 earnings release on February 28 is accessible here.
I dispense with a review of Q1 results since Q2 and YTD2023 results are scheduled to be released within the next 10 business days.
Capital Deployment
The following provides a high-level overview of how A has deployed its capital since FY2015.

Free Cash Flow (FCF)
In FY2013 – FY2022, A generated FCF of (in millions of $): 957, 526, 414, 654, 713, 910, 865, 802, 1,297, and 1,021. In Q1 2023, it generated ~$220.
FY2023 Guidance
The following reflects A’s Q2 and FY2023 guidance.

Guidance was increased following a strong start to FY2023. The current guidance reflects marginally higher revenue, Y/Y Core Revenue Growth, and adjusted diluted EPS from the guidance provided at FYE2022. This is despite a dynamic macroeconomic environment and volatile interest rates and currencies.
CAPEX was increased from $0.3B to $0.5B given the company’s Nucleic Acid-Based Therapeutics (NASD) expansion announcement whereby the company expects to double A’s oligo manufacturing capacity.

Credit Ratings
The company’s website currently reflects the following credit ratings.
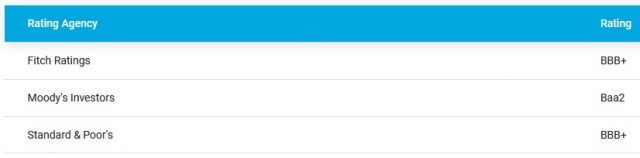
This is not entirely correct as Moody’s upgraded the assigned credit rating from Baa2 to Baa1 on May 3, 2023. Now, all three ratings are the top tier of the Lower Medium Grade investment grade credit rating.
All three rating agencies define A as having an adequate capacity to meet its financial commitments. However, adverse economic conditions or changing circumstances are more likely to lead to a weakened capacity of A to meet its financial commitments.
While A’s Q1 2023 Form 10-Q has a description of existing short-term and long-term debt (commences on page 23), it lacks some of the detail that is included in the FY2022 Form 10-K (commences on page 48).
Dividends, Share Repurchases, and Stock Splits
Dividend and Dividend Yield
Investors who fixate on dividend metrics will likely disregard A as a potential investment. While A distributes a quarterly dividend that has grown at a high single percentage in recent years, the dividend yield is typically under 1%.
The company deems the retention of funds in the company for growth purposes and the repurchase of shares to be a superior method by which to increase total long-term shareholder value.
I envision the bulk of A’s future total investment return will continue to be predominantly in the form of capital appreciation.
Share Repurchases
A’s weighted average shares outstanding in FY2013 – FY2022 are (in millions of shares) 345, 338, 335, 329, 326, 325, 318, 312, 307, and 300. The diluted weighted average shares outstanding in Q1 2023 is 297.
In Q1 2023, A repurchased and retired 499,349 shares for $75 million; the following schedule reflects the share repurchases.

Source: A – Q1 2023 Form 10-Q
In Q1 FY2022, it repurchased and retired 2.9 million shares for $447 million.
As of January 31, 2023, there was a remaining authorization to repurchase up to ~$363 million of common stock under the 2021 repurchase program. On March 1, 2023, the 2021 repurchase program was terminated and the remaining authorization of $339 million expired.
On January 9, 2023, A announced that its Board had approved a share repurchase program. This program is designed, among other things, to reduce or eliminate dilution resulting from the issuance of stock under the company’s employee equity incentive programs. This 2023 repurchase program authorizes the purchase of up to $2B of common stock at the company’s discretion and has no fixed termination date.
Stock Splits
A’s 1 historical stock split occurred on November 3, 2014. The split consisted of 1398 for 1000.
Valuation
A’s FY2013 – FY2022 diluted PE levels are 27.23, 27.48, 31.92, 32.54, 31.89, 69.55, 25.31, 51.52, 40.52, and 35.80.
In FY2022, A generated $5.22 in adjusted diluted EPS versus $4.18 in diluted EPS. A reconciliation of the variance between GAAP and non-GAAP EPS is found below.

In Q1 2023, A generated $1.19 in adjusted diluted EPS versus $1.37 in diluted EPS.

Management’s current forward adjusted diluted EPS guidance for FY2023 is $5.65 – $5.70 with $5.675 being the mid-point. I have just acquired shares at ~ $127. Using the $5.675 mid-point and my share price, the forward adjusted diluted PE is ~22.4.
If A generates $4.65 in diluted EPS in FY2023, the forward diluted PE is ~27. This compares favourably with historical levels.
The current forward adjusted diluted broker estimates and valuation using my purchase price are:
- FY2023 – 18 brokers – mean of $5.69 and low/high of $5.66 – $5.75. Using the mean estimate, the forward-adjusted diluted PE is ~22.3.
- FY2024 – 18 brokers – mean of $6.30 and low/high of $6.14 – $6.53. Using the mean estimate, the forward-adjusted diluted PE is ~20.2.
- FY2025 – 13 brokers – mean of $7.04 and low/high of $6.80 – $7.56. Using the mean estimate, the forward-adjusted diluted PE is ~18.
Final Thoughts
A has generated impressive Revenue growth over the past few years. Equally impressive is its consistent track record of strong FCF and profitability.
Shares were reasonably valued when I last reviewed it in July 2019. After that review, A has, for the most part, been overvalued. While shares are currently only fairly valued, Agilent has now been added to the FFJ Portfolio.
I wish you much success on your journey to financial freedom!
Note: Please send any feedback, corrections, or questions to finfreejourney@gmail.com.
Disclosure: I am long A.
Disclaimer: I do not know your circumstances and do not provide individualized advice or recommendations. I encourage you to make investment decisions by conducting your research and due diligence. Consult your financial advisor about your specific situation.
I wrote this article myself and it expresses my own opinions. I do not receive compensation for it and have no business relationship with any company mentioned in this article.