 Summary
- WST has been in business for 95 years and has developed a strong reputation. The top 50 injectable biologics rely on WST and also supplies the top 75 pharmaceutical and biotech injectable companies.
- The company’s common stock cumulative total return has far exceeded the cumulative total return of the following Standard & Poor’s (“S&P”) indices (500, MidCap 400 Index, and the 400 Health Care Equipment & Supplies Industry) over the past 5 years.
- WST is certainly an attractive company which operates in a highly competitive industry but I view shares as being currently overvalued.
Introduction
Recently, a reader inquired about my opinion on West Pharmaceutical Services, Inc. (NYSE: WST). Given this inquiry I decided to undertake an analysis to determine whether this member of the Medical Instruments and Supplies industry would be a worthwhile addition to the FFJ Portfolio.
Here is a performance graph for 5 years ending December 31, 2017 which compares WST’s common stock cumulative total return versus the cumulative total return of the following Standard & Poor’s (“S&P”) indices (500, MidCap 400 Index, and the 400 Health Care Equipment & Supplies Industry).
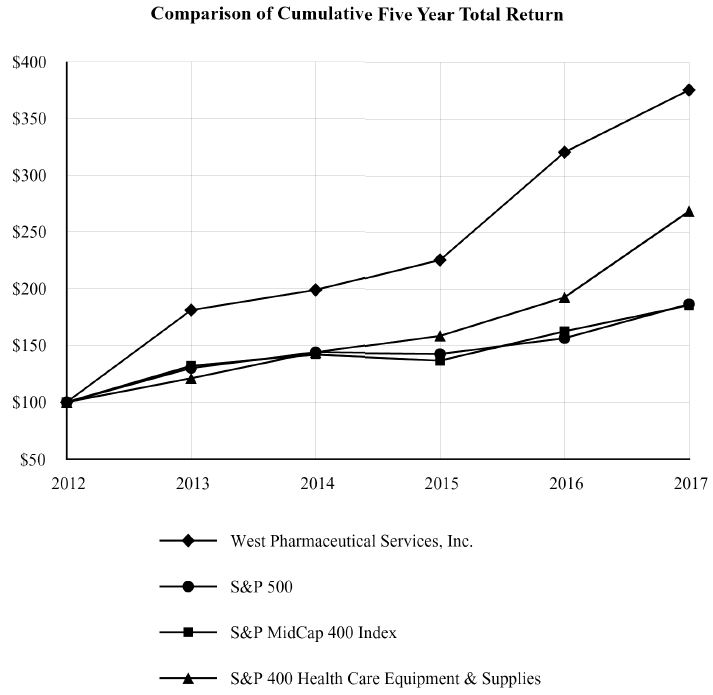
Source: WST 2017 Annual Report
Cumulative total return to shareholders is measured by dividing total dividends (assuming dividend reinvestment) plus the per-share price change for the period by the share price at the beginning of the period. The cumulative shareholder return is based on an investment of $100 on December 31, 2012.
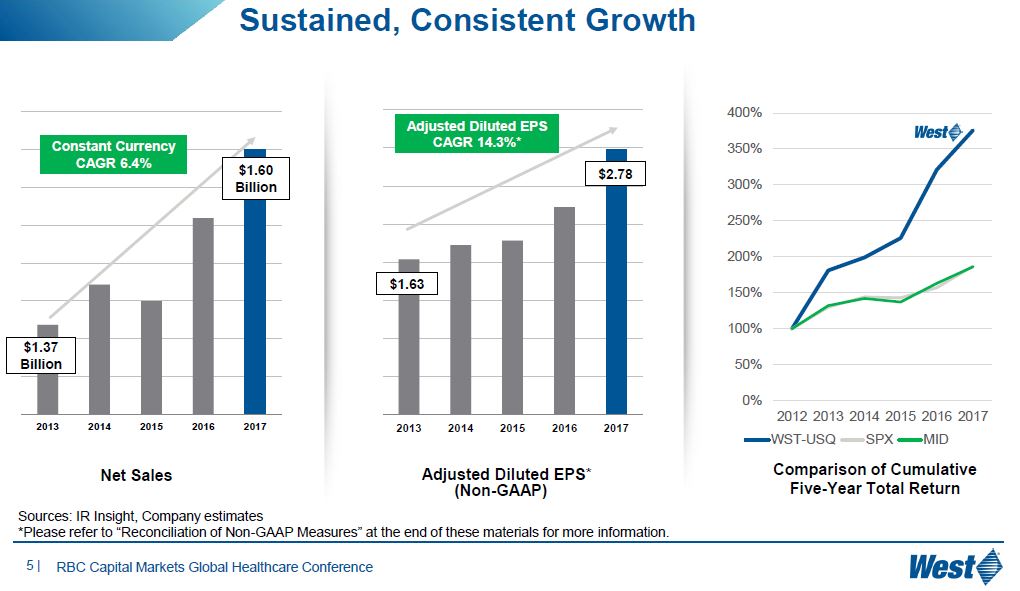 Source: WST – RBC Capital Markets Global Healthcare Conference February 21 2018 Presentation
WST has certainly outperformed during the most recent 5 year period. An attractive company, however, is not necessarily an attractive investment if shares are overvalued. Let’s see whether it would be worthwhile to initiate a position in WST.
Industry Analysis
WST, with a current market cap of ~$6.44B, is the 8th largest member of the Medical Instruments and Supplies industry from a market cap perspective.
The following is a list of the larger members within this industry ranked by market cap.
- Becton Dickinson (BDX)
- Baxter International (BAX)
- Waters Corporation (WAT)
- Mettler-Toledo (MTD)
- Teleflex (TFX)
- Dentsply Sirona (XRAY)
- The Cooper Companies (COO)
This growth industry is divided into the Medical Supplies Invasive and the Medical Supplies Non Invasive groups. Avenues of expansion, such as new products with next-generation technologies and overseas markets, are constantly being sought.
Companies manufacture and distribute a broad range of items, from surgical and dental instruments to elective laser surgery equipment to orthopedic products. The two major classes of customers served are hospitals and doctor’s offices.
Members of this industry which supply low-tech items (eg. surgical gloves and syringes) do not incur substantial CAPEX. These participants depend upon volume for profitability.
Participants with highly complex operations (eg. orthopedic and interventional cardiology device manufacturers) require extensive capital spending. Cash generation is critical since products are high-tech, and substantial research and development spending is needed to maintain a steady rollout of new offerings.
This is a competitive industry with the primary drivers of demand being demographics and advanced, effective products.
The larger industry participants are geared toward the manufacturing and distribution of top-quality products across a broad territory. Smaller peers are more likely to specialize in a particular market segment.
Shares of the larger companies typically offer investors solid long-term growth and income potential. Shares in smaller participants, which often rely on one or a few very complex or specialized product lines, are more apt to appeal to investors with a higher tolerance for risk and who may be seeking above-average appreciation potential.
The need for medical treatments is constant. This means industry participants are somewhat insulated from negative macroeconomic factors. They are, however, impacted during significant cyclical downturns when hospitals are inclined to delay purchases of the most expensive capital equipment.
Another factor is that during periods of high unemployment, patients with limited disposable income and who are impacted by rising health insurance costs or loss of coverage, might defer medical treatment. Companies which provide products and services for elective surgeries (e.g., laser, cosmetic) are most likely to be impacted the hardest.
Barriers to entry can be overcome in that competitors will develop improvements to products currently available. Given this, companies will frequently cut prices on legacy products in order to retain business and to support production volume and net profit.
Product recalls are one of the hazards of competing in this industry. They can have a substantial impact on results, especially if the recalled products cause patient injuries or fatalities. In some cases companies will voluntarily pull products from the market. In other cases, regulators may mandate the suspension of sales. This impacts sales and earnings in the short-term until the issue(s) are resolved. Secondly, sales can be impacted long-term if hospitals, doctors and patients are wary of returning to a previously recalled product.
Product development and market expansion, most notably in developing nations, are key for sales and net-income growth. In this regard, acquisitions can assist with growth. Examples include BDX’s acquisitions of CareFusion and C.R. Bard in the last few years.
Intense competition can also significantly pressure operating performance especially if products are not protected by patents.
Business Analysis
Incorporated in 1923, WST is a leading global manufacturer in the design and production of technologically advanced, high-quality, integrated containment and delivery systems for injectable drugs and healthcare products. Products include a variety of primary packaging, containment solutions, reconstitution and transfer systems, and drug delivery systems, as well as contract manufacturing and analytical lab services. Customers include the leading biologic, generic, pharmaceutical, diagnostic, and medical device companies in the world.
WST has 2 Operating segments, the Proprietary Products Segment and the Contract-Manufactured Products Segment through which it manufactures ~41 billion components annually from 3.3 million square feet of manufacturing space in 28 manufacturing facilities around the world.
The top 50 injectable biologics rely on WST and Daikyo components; some key value-added and proprietary products and processes are licensed from Daikyo.
WST also supplies the top 75 pharmaceutical and biotech injectable companies.
WST’s ten largest customers accounted for 37.5% of FY2017 consolidated net sales but no single customer accounted for greater than 10% of consolidated net sales.
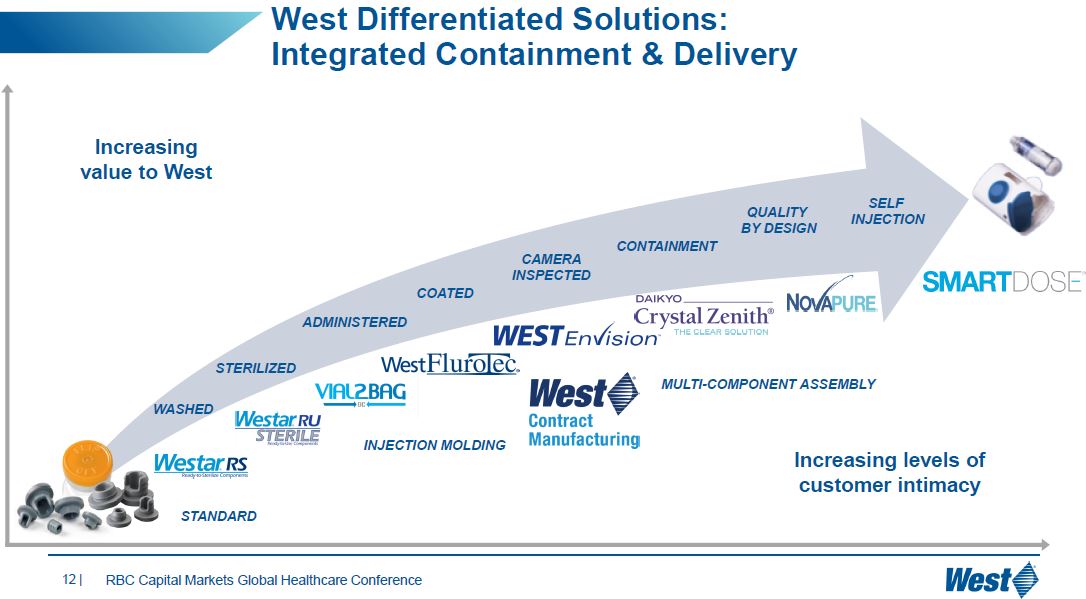
 Source: WST – RBC Capital Markets Global Healthcare Conference February 21 2018 Presentation
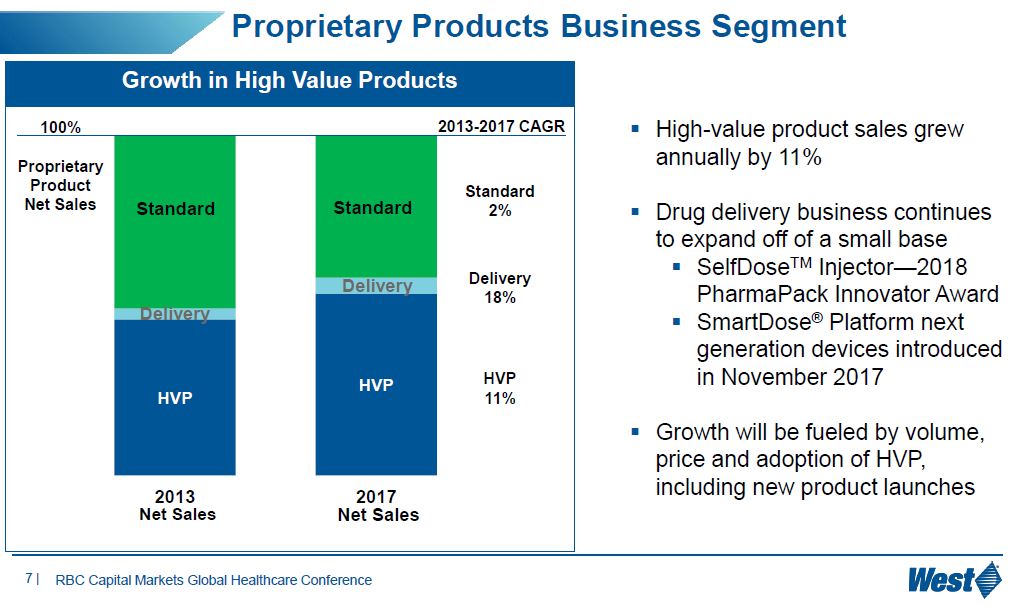
Proprietary Products Segment (~77% of net sales)
This segment offers:
- proprietary packaging
- containment and drug delivery products
- analytical lab services
to biologic, generic and pharmaceutical drug customers. Packaging products include stoppers and seals for injectable packaging systems. These are designed to help ensure drug compatibility and stability with active drug products.
Source: WST – RBC Capital Markets Global Healthcare Conference February 21 2018 Presentation
The product portfolio includes syringe and cartridge components, custom solutions for the specific needs of injectable drug applications, and administration systems that can enhance the safe delivery of drugs through advanced reconstitution, mixing and transfer technologies.
In order to enhance the quality of packaging components and to mitigate the risk of contamination and compatibility issues, WST also provides films, coatings, washing and sterilization processes and services.
In addition to the above, this segment produces drug containment solutions, including CZ, a cyclic olefin polymer, in the form of vials, syringes and cartridges. The advantage these products offer is that, unlike glass products, they can withstand cold storage environments and they significantly reduce the risk of breakage that exists with glass.
A variety of self-injection devices, designed to address the need to provide at-home delivery of injectable therapies is also part of the product portfolio. These devices are easy-to-use patient-centric technologies.
This segment includes analytical lab services which provide specialized testing for drug packaging, devices and administration systems.
Proprietary Product manufacturing facilities are located in North and South America, Europe, and Asia Pacific, and there are affiliated companies in Mexico and Japan.
While this segment is not inherently seasonal, sales and operating profit in the second half of WST’s fiscal year are typically lower than the first half. This is primarily due to scheduled plant shutdowns in conjunction with WST’s customers’ production schedules and the year-end impact of holidays on production. This can, however, vary from year-to-year, depending upon customer inventory management programs and customer product launches and other factors.
WST competes with several companies across this segment. Total cost is becoming increasingly important as pharmaceutical companies continue with aggressive cost-control programs across their operations.
There are a number of competitors supplying medical devices and medical device components. WST competes in this market on the basis of its reputation for quality and reliability in engineering and project management, as well as its knowledge of, and experience in, compliance with regulatory requirements.
WST has a wide range of proprietary technologies and aims to differentiate itself from competitors by being an integrated drug containment and delivery systems global supplier that can provide pre-approval primary packaging support and engineering development, analytical services, regulatory expertise and after-sale technical support. An added advantage is that its manufacturing operations are located throughout various regions globally and many products can be produced at multiple sites.
Contract-Manufactured Products Segment (~23% of net sales)
This reporting segment serves as a fully integrated business, focused on the design, manufacture, and automated assembly of complex devices, primarily for pharmaceutical, diagnostic, and medical device customers. Products include a variety of custom contract-manufacturing and assembly solutions, which use such technologies as multi-component molding, in-mold labeling, ultrasonic welding and clean room molding and device assembly.

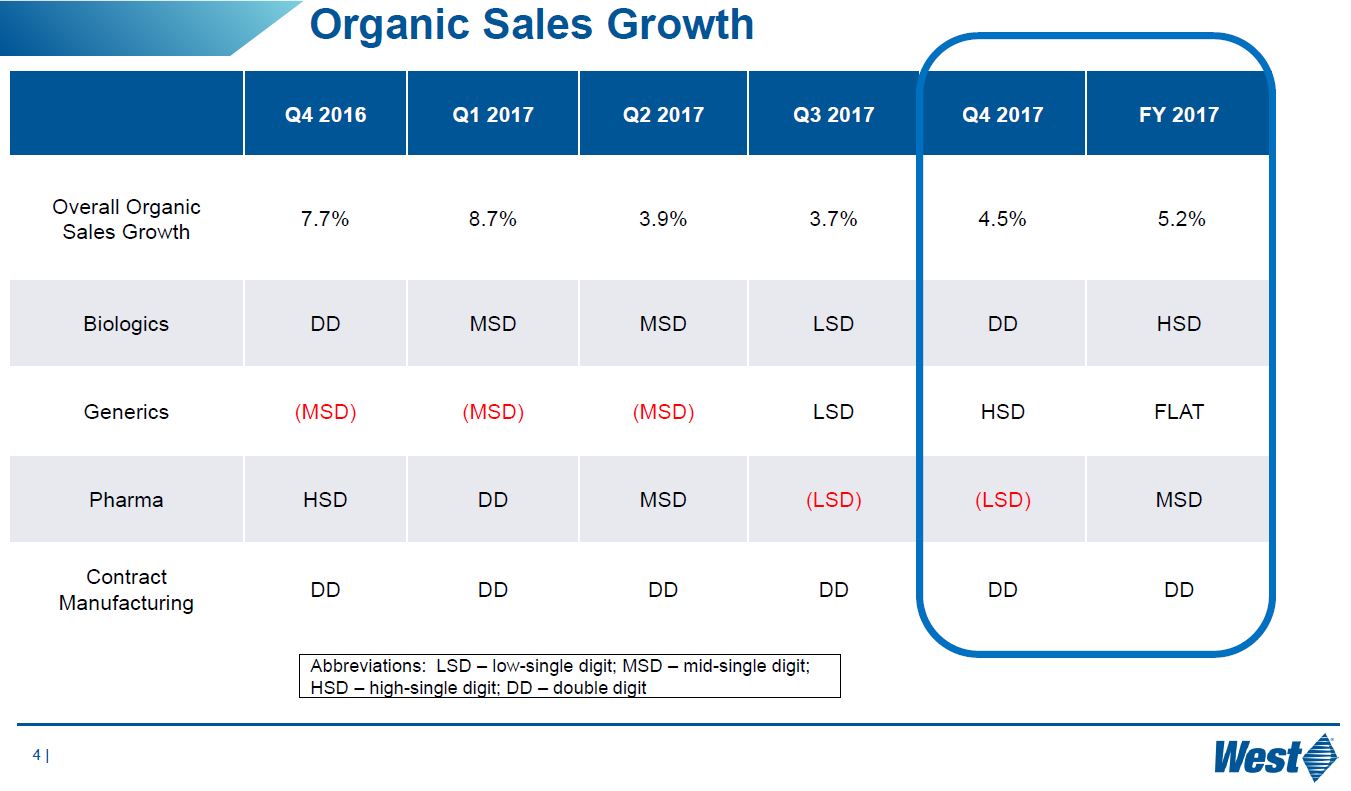
Source: WST – RBC Capital Markets Global Healthcare Conference February 21 2018 Presentation
WST manufactures customer-owned components and devices used in surgical, diagnostic, ophthalmic, injectable, and other drug delivery systems, as well as consumer products.
This segment is not inherently seasonal.
Manufacturing operations are located in North America and Europe.
Source: WST – RBC Capital Markets Global Healthcare Conference February 21 2018 Presentation
Competition in this segment varies from smaller regional companies to large global molders. Its customers face increasing cost pressures, and therefore, customers look off-shore to reduce cost. WST aims to differentiate itself by leveraging its global capabilities and by employing new technologies such as high-speed automated assembly, insert-molding, multi-shot molding and expertise with multiple-piece closure systems.
International
WST’s international operations are also managed through the Proprietary Products and Contract-Manufactured Products segments. Sales outside the U.S. accounted for 54.1% of consolidated net sales in 2017.
The following table presents net sales and property, plant and equipment, net, by the country in which the legal subsidiary is domiciled and assets are located.
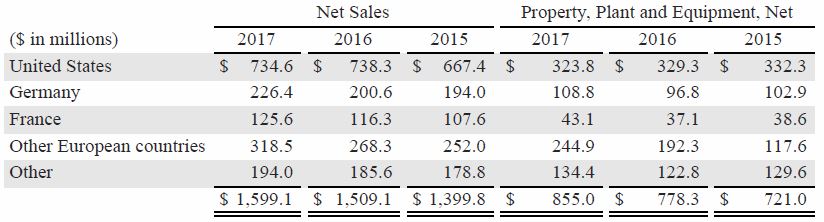
Source: WST 2017 Annual Report
Impact of the Tax Cuts and Jobs Act (TCJ) on WST
Q4 2017 was impacted by a $48.8 million tax charge related to the US tax reform legislation that reduced EPS by $0.64. This was the estimated impact of U.S. tax reform, including the repatriation tax on accumulated foreign earnings and the remeasurement of deferred tax assets and other tax liabilities, as well as the impact of changes in enacted international tax rates on previously-recorded deferred tax asset and liability balances.
WST currently expects its effective tax rate will decrease by ~3% – 4% as a result in the new US tax legislation. The 2018 effective tax rate is expected to be ~26%; this excludes the effects of excess tax benefits from option exercises.
WST has indicated its tax rate is highly dependent on the geographic mix of earnings.
Q4 and FY2017 Results
On February 15, 2018 WST released its Q4 and FY2017 results and provided guidance for FY2018.
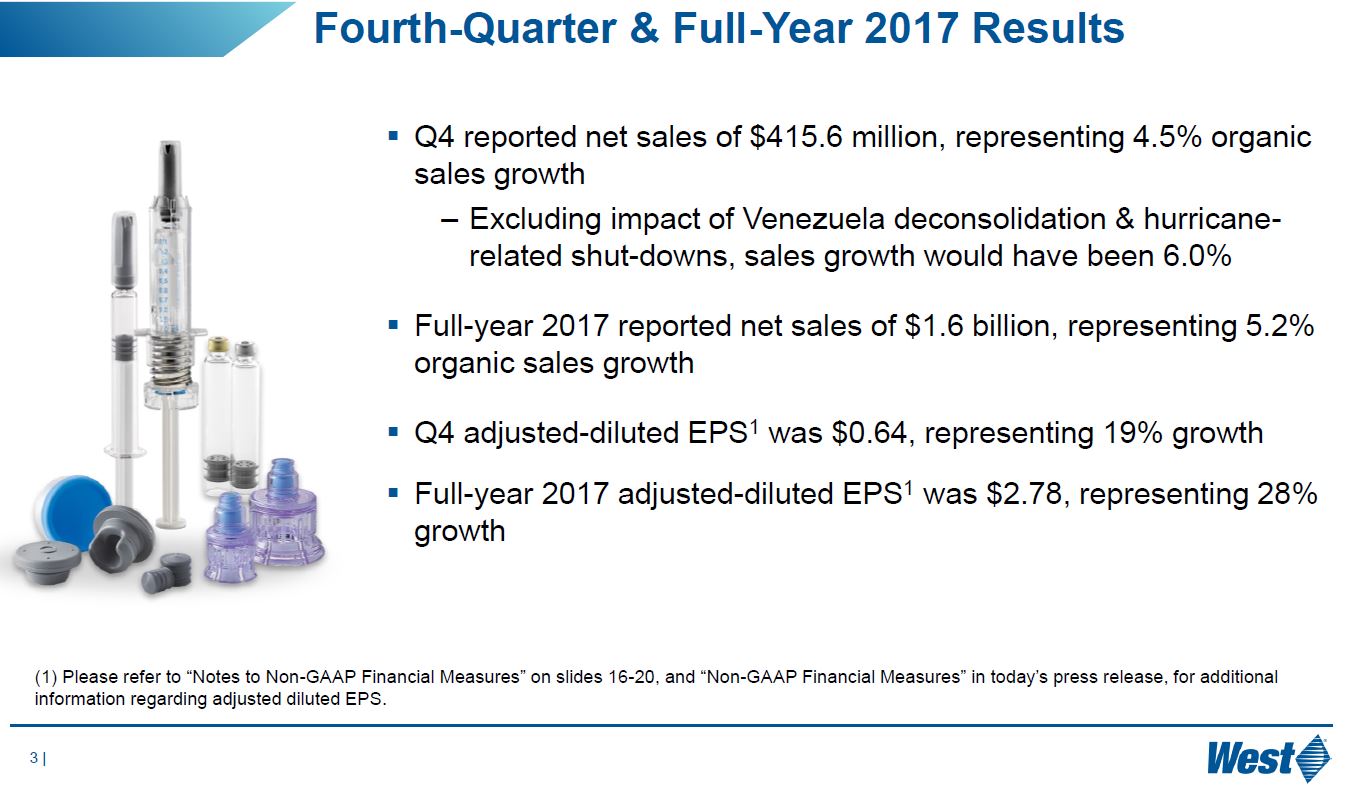
Source: WST – Q4 2017 Earnings Conference Call February 15 2018 Presentation
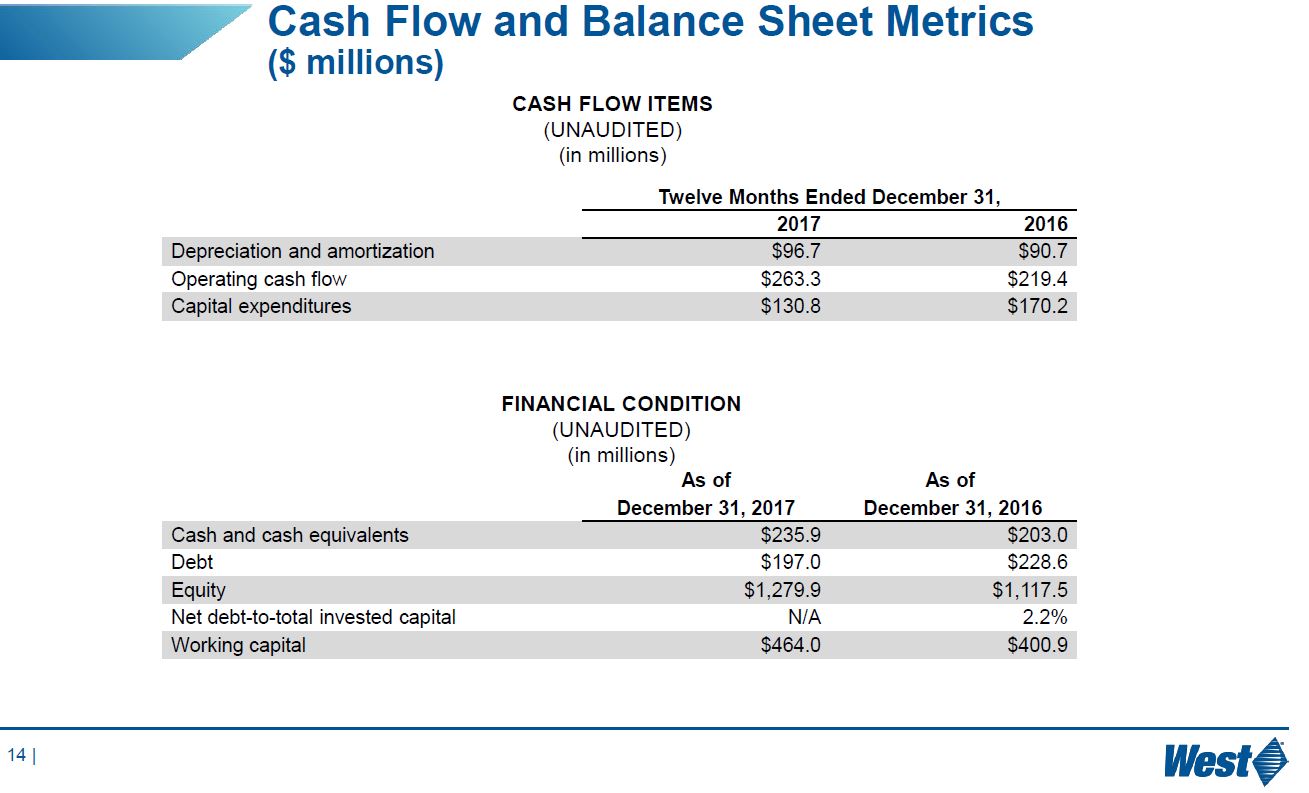
WST carries a significant amounts of inventory ($215.2 million as at December 31, 2017 which is ~13.5% of 2017 Net Sales) in order to meet customer requirements. Some of WST’s supply agreements also require it to purchase inventory in bulk orders. This increases inventory levels but decreases the risk of supply interruption. Inventory levels are also influenced by the seasonal patterns noted earlier in this article.
WST has an attractive balance sheet in that it employs a conservative amount of leverage and it maintains an attractive working capital position. Gross profit margins are typically in the low 30% range.
2018 Forecast
In February 2018, WST’s Board approved a restructuring plan designed to realign manufacturing capacity with demand. These changes are expected to be implemented over the next 12 – 24 months. Restructuring and related charges are expected to be in the range of $8 – $13 million and capital expenditures of $9 – $14 million are anticipated. Upon completion of the restructuring, WST anticipates annualized savings of $17 – $22 million.
WST’s FY2018 guidance calls for adjusted diluted EPS of $2.66 – $2.76.
Cash Flow
The following table presents WST’s cash flow data for FY2015 – FY2017.
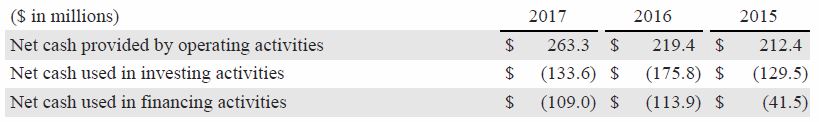
Source: WST 2017 Annual Report
Net cash provided by operating activities increased by $43.9 million in 2017, due to improved operating results.
 Source: WST – Q4 2017 Earnings Conference Call February 15 2018 Presentation
Net cash used in investing activities decreased by $42.2 million in 2017, mostly due to a $39.4 million decrease in CAPEX due to the completion of several major projects, including certain components of WST’s new facility in Waterford, Ireland. This facility will continue to undergo validation procedures during 2018, with commercial production expected to begin in the second half of 2018.
Net cash used in financing activities decreased by $4.9 million in 2017, due to a decrease in net debt repayments which was partially offset by an increase in purchases under our WST’s share repurchase programs.
Credit Ratings
WST has no debt which is rated by Moody’s and S&P Global.
Valuation
Please refer to the Q4 and 2017 results and the 2018 Forecast sections of this article wherein you will find WST’s adjusted EPS results and guidance.
On February 16, 2017, WST had forecast diluted EPS of $2.45 – $2.57 for FY2017. At the time, WST was trading at ~$85 thus giving us a forward PE range of ~33.07 – 34.7. Actual FY2017 diluted EPS came in at $1.99 but after various adjustments WST reported FY2017 adjusted diluted EPS of $2.34. Readers must keep in mind these beginning of the year projections were set before the TCJ was introduced.
With WST currently trading at ~$87, its trailing PE is ~43.72, its trailing adjusted PE is ~37.18, and its forward PE range, based on diluted EPS guidance of $2.66 – $2.76, is ~31.52 – 32.71.
While WST is a fine company which may justify an elevated PE level, I view its current valuation as somewhat elevated. I recognize I might be waiting for quite some time before WST retraces to a level where I view it as being reasonably valued. I am, however, very reluctant to initiate a position for any level higher than ~$75. At this level, WST would be trading at a PE multiple of ~27.7 based on a $2.71 mid-point of the projected diluted EPS guidance of $2.66 – $2.76. Even this level is high but I think I would need to wait for another Financial Crisis to occur for WST to retrace to PE levels in the teens or low 20s.
Dividend, Dividend Yield, Dividend Payout Ratio, Stock Splits, and Share Repurchases
WST’s dividend and stock split history can be found here.
While WST does reward investors with dividend increases, the annual dividend growth is inconsistent when viewed over the 2000 – 2018 period. As a result, I chose to also analyze WST’s dividend growth for 2008 – 2018. As you can see, the CAGR is not that much different over these two timeframes.
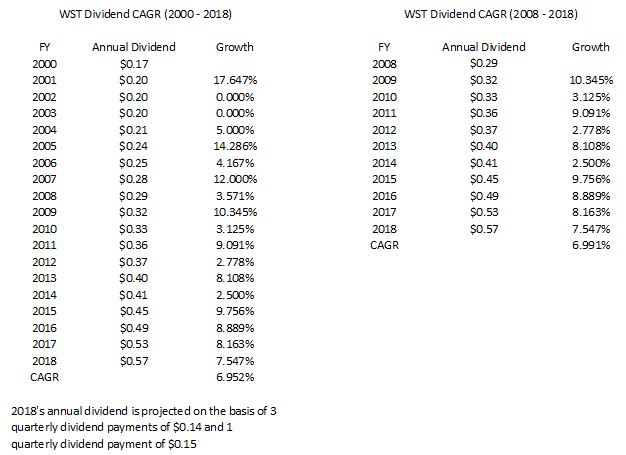
The dividend payout ratio over the past ~10 years has been below 38%. In FY2017, WST’s $0.53 annual dividend represented ~26.7% of $1.99 in diluted EPS.
WST has not split its shares subsequent to the 2 for 1 stock split in June 1987.
In February 2018, WST announced a share repurchase program of up to 800,000 common shares for calendar-year 2018. Shares can be purchased from time to time on the open market or in privately-negotiated transactions.
While WST repurchases shares, the weighted average number of diluted shares outstanding has risen from 71.4 million in 2013 to 75.8 million in 2017.
Final Thoughts
WST strikes me as a well managed company which has managed to carve out a niche in a highly competitive industry; you don’t stay in business for 95 years unless you are a well managed company which offers products and services clients appreciate and value.
While WST’s stock price has retraced from a high of ~$103 set in October 2017, I view its stock price as still being somewhat elevated in the upper $80s. I will, therefore, pass on investing in WST at current levels.
I wish you much success on your journey to financial freedom.
Thanks for reading!
Note: I sincerely appreciate the time you took to read this article. Please send any feedback, corrections, or questions to charles@financialfreedomisajourney.com
Disclaimer: I have no knowledge of your individual circumstances and am not providing individualized advice or recommendations. I encourage you not to make any investment decision without conducting your own research and due diligence. You should also consult your financial advisor about your specific situation.
Disclosure: I do not currently hold a position in WST and do not intend to initiate a position within the next 72 hours.
I wrote this article myself and it expresses my own opinions. I am not receiving compensation for it and have no business relationship with any company whose stock is mentioned in this article.