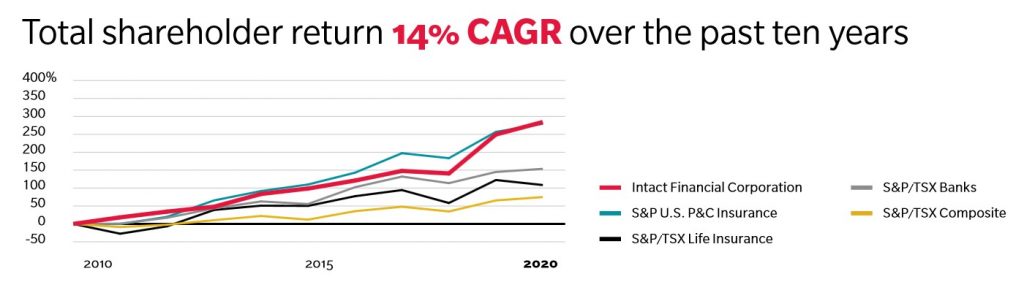
Intact Financial (IFC), Canada’s largest provider of property and casualty (P&C) insurance with an estimated market share of 21%, has generated a 14% CAGR total shareholder return between 2010 – 2020. Intact Financial continues to impress having posted strong Q4 and FY2021 financial results.
NOTE: All dollar values expressed in this post are Canadian currency.
I last reviewed IFC in this November 11, 2021 post at which time I disclosed the purchase of an additional 100 shares @ $165.82 on November 8 to increase my exposure in a ‘Core’ account in the FFJ Portfolio.
On January 10, 2022, I acquired additional shares @ $162.59 in accounts for which I do not disclose details. I only disclosed these purchases when I published my FFJ Portfolio – January 2022 Report.
The January purchase was made after I published my Investment Holdings Review on January 7, 2022. At the time of that review, IFC was my 26th largest holding. It was not a top 30 holding when I completed my mid-April 2021 and mid-August 2020 reviews.
With the February 8, 2022 release of Q4 and FY2021 results and a surge in IFC’s share price to $185 on February 9, 2022, I revisit IFC to determine if its valuation supports the purchase of additional shares.
Business Overview
IFC’s February 8, 2022 Annual Information Form provides a good overview of the company. Further information, including the company’s history, is found on the company’s website and in the FY2020 Annual Report.
RSA Acquisition
I have addressed IFC’s acquisition of RSA in previous posts.
In the Q3 2021 Review of Performance, RSA was reported to have contributed 8% accretion to Q3 2021 Net operating income per share (NOIPS) and 9% accretion since the June 1, 2021 closing of the RSA Insurance Group plc acquisition. This has since increased to 16% and 12%, respectively.

Financial Results
Q4 and FY2021 Results
Please refer to IFC’s Q4 Press Release, Management’s Discussion and Analysis, and Presentation which is accessible here.
The Operating Combined Ratio (OCR), typically expressed as a percentage, is a measure of profitability used by an insurance company to gauge how well it is performing in its daily operations. Many insurance companies believe that the combined ratio is the best way to measure success because it does not include investment income and only includes profit earned through efficient management. It is calculated by taking the sum of incurred losses and expenses and then dividing them by the earned premium.
A ratio below 100% indicates the company is making an underwriting profit whereas a ratio above 100% means the company is paying out more money in claims than it is receiving from premiums.
IFC’s OCR in FY2017 – FY2021 is 94.3%, 95.1%, 95.4%, 89.1%, and 88.8%. Its OCR in Q4 2021 was 87.8% versus 91.3% in Q3 2021.

Source: IFC – Q4 2021 Earnings Presentation – February 8, 2022
Capital Structure
IFC has a proven and consistent capital management strategy. Its target capital structure is:
- Equity: 70% (currently ~67%)
- Preferred shares and hybrid debt: 10% (currently ~10%)
- Debt excluding hybrid debt: 20% (currently ~23%)
Further details are found in section 28.3 (Managing Leverage) on page 67 of 123 in Management’s Discussion and Analysis for FY2021.
Following the RSA acquisition, IFC’s debt–to–capital was 24.1% and IFC stated the plan was to reduce debt–to–capital to 20% within 36 months of closing the acquisition. By the end of Q3 2021, this had been reduced to 23.9%. This has since been reduced to 23% at FYE2021.

Source: IFC – Q4 2021 Earnings Presentation – February 8, 2022
Credit Ratings
IFC’s credit ratings are accessible here. While we see multiple ratings, I focus on the senior unsecured debt ratings assigned to Intact Financial Corporation because this is the publicly-traded company in which I have acquired shares.
The assigned ratings differ slightly but all are investment grade.
- DBRS’s rating is the middle tier of the upper-medium grade investment-grade category.
- A. M. Best’s and Fitch’s rating is the bottom tier of the upper-medium grade investment-grade category.
- Moody’s rating is the top tier of the lower-medium grade investment-grade category.
DBRS, A. M. Best, and Fitch define IFC as having a STRONG capacity to meet its financial commitments. Moody’s rating defines IFC as having an ADEQUATE capacity to meet its financial commitments.
Despite the slight variance in ratings, all ratings are acceptable for my conservative nature.
Dividends and Share Repurchases
Dividend and Dividend Yield
When we look at IFC’s dividend history, we see that IFC has increased its dividend for 17 consecutive years despite 7 consecutive quarterly dividends of $0.83.
IFC declared a ~9.6% increase in its quarterly dividend from $0.83 to $0.91 when it released its Q3 2021 results on November 9, 2021. The forward dividend yield based on my $165.82 purchase price was ~2.2%.
IFC has now announced an increase in its quarterly dividend from $0.91 to $1.00 to shareholders of record on March 15; the dividend is payable on March 31. With shares trading at ~$185, the forward dividend yield is ~2.16%.
Share Repurchases
Share repurchases rank 5th in capital priorities behind:
- Manage volatility
- Manage leverage ratio
- Increase dividends
- Invest in growth opportunities
IFC’s weighted-average number of common shares outstanding in FY2011 – FY2021 (in millions) is 115, 131, 132, 132, 132, 131, 133, 139, 140, 143, and 162.4. The increase in FY2021 is attributed primarily to shares issued for the RSA acquisition.
There was no share buyback during FY2020 and FY2021.
Since 2009, $0.627B has been returned to shareholders, with an average buyback share price of $50.91.
As part of IFC’s capital deployment strategy and in expectation of the receipt of the proceeds from the sale of RSA’s Danish operations, IFC intends to reinstate its share buyback program in FY2022, subject to TSX approval.
Valuation
IFC’s PE in FY2011 – FY2020 is 15.86, 14.96, 18.50, 16.64, 16.86, 23.10, 19.41, 20.97, 27.43, and 24.00.
In FY2021, it generated $12.40 in diluted EPS and the current share price is ~$185 for a diluted PE of ~15.
I purchased shares at $165.82 on November 8, 2021. By the time I wrote my November 11 post, the share price had risen to $170. Using the forward adjusted diluted EPS guidance from the brokers which cover IFC and my purchase price, the forward adjusted diluted PE levels were:
- FY2021 – 14 brokers – mean of $10.78 and low/high of $9.45 – $11.95. The forward adjusted diluted PE was ~15.4.
- FY2022 – 14 brokers – mean of $10.98 and low/high of $9.48 – $12.23. The forward adjusted diluted PE is ~15.1.
- FY2023 – 9 brokers – mean of $12.28 and low/high of $10.21 – $13.03. The forward adjusted diluted PE is ~13.5.
I did not record the guidance from the brokers when I acquired additional shares at $162.59 on January 10, 2022. I imagine the guidance was not that much different from early November so the forward adjusted diluted PE levels were probably fairly similar.
Now shares are trading at ~$185 and current guidance is higher.
- FY2022 – 13 brokers – mean of $11.27 and low/high of $10.33 – $12.11. The forward adjusted diluted PE is ~16.4.
- FY2023 – 13 brokers – mean of $12.28 and low/high of $10.53 – $13.33. The forward adjusted diluted PE is ~15.
At the time I compose this post, only 1 broker has provided an estimate for 2024; this estimate is $12.85.
Final Thoughts
IFC’s current valuation based on broker estimates is not that significantly different from when I purchased shares in November and January despite the ~$20 run-up in the share price.
I stand by my Final Thoughts reflected in my November 11 post and intend to add to my existing exposure over time.
I wish you much success on your journey to financial freedom!
Note: Please send any feedback, corrections, or questions to finfreejourney@gmail.com.
Disclosure: I am long IFC.
Disclaimer: I do not know your circumstances and do not provide individualized advice or recommendations. I encourage you to make investment decisions by conducting your own research and due diligence. Consult your financial advisor about your specific situation.
I wrote this article myself and it expresses my own opinions. I do not receive compensation for it and have no business relationship with any company mentioned in this article.