 Summary
- This CDK Global stock analysis is based on Q2 2017 results and its outlook for the remainder of fiscal 2017.
- CDK’s stock price has doubled to almost $64 since it was spun-off from ADP in 2014.
- CDK’s sub 1% dividend yield will not appeal to investors seeking income from their investments.
- CDK is expensive and I am of the opinion a $17 drop in price to approximately $46 – $47 is required before I purchase more shares.
Introduction
In today’s post I am going to review CDK Global Inc. (NASDAQ: CDK) and its recently released Q2 FY 2017 results.
CDK is quite possibly a company that has never come across your radar screen for the following reasons:
- It has a sub $10B market cap.
- It has a lofty PE (over 38 as I compose this).
- The dividend yield is sub 1%.
- The average # of shares traded daily is less than 650 thousand.
- Annual revenue is sub $2.5B.
CDK was officially spun off from Automatic Data Processing, Inc. (NASDAQ: ADP) on September 30, 2014 and began trading as a member of the S&P MidCap 400 Index on October 1, 2014. As ADP shareholders, my wife and I received one share of CDK stock for every three shares of ADP stock we held in ADP on September 24, 2014.
We have never sold our CDK stock and if you want to know whether we have been pleased with CDK’s performance, I enclose the graph below so you can see how well CDK has performed. You can also read my Low or No Dividend Yield Companies Belong in Your Portfolio post in which I used CDK as one of my examples.
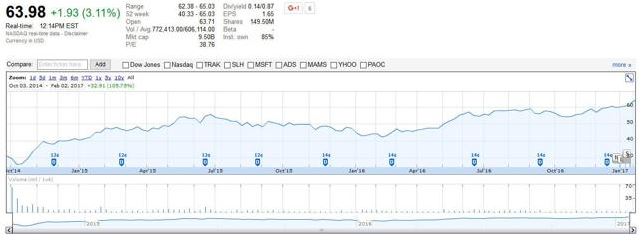
CDK Stock Chart
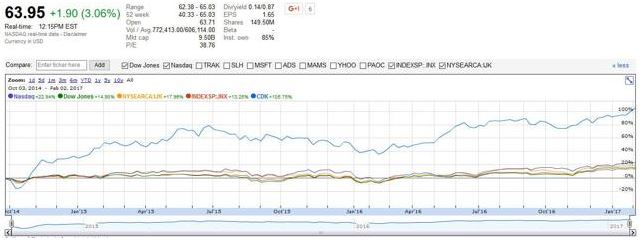
CDK compared to various indices
(Source: Google Finance)
Industry Overview
CDK operates in a competitive industry. In North America, there are 3 major players: CDK, Reynolds & Reynolds and the Cox Automotive Group.
The Reynolds and Reynolds Company is a private corporation. Its primary business is providing business forms, management software and professional services to car dealerships. Its software is used to manage sales logistics at dealerships. It also produces forms used in medicine and insurance.
Cox Automotive is a member of Cox Enterprises, Inc., which is a privately held American conglomerate with revenues of $18B and approximately 60,000 employees and is based in Atlanta, Georgia. Cox is a leading communications and automotive services company and its brands include Autotrader®, Dealer.com®, Dealertrack®, Kelley Blue Book®, Manheim®, NextGear Capital®, vAuto®, Xtime® and a host of other brands.
Smaller competitors include Auto/Mate and Autosoft.
There is a variety of other providers at varying ends of the spectrum in terms of sophistication and in terms of product offering that CDK bumps up against.
In NASDAQ’s 35th Investor Program and Citi’s 2016 Global Technology Conference, CDK’s CFO indicated that consolidation is occurring within the auto dealership industry. The number of dealership rooftops, while relatively flat at roughly 17,600 rooftops in the US, is consolidating in that the large companies are tending to buy other players. This benefits CDK because its sweet spot is the medium to high-end of the market.
Business Overview
CDK is a leading global provider of integrated information technology and digital marketing solutions to the automotive retail and adjacent industries. Its solutions automate and integrate all parts of the dealership and buying process from targeted digital advertising and marketing campaigns to the sale, financing, insuring, parts supply, repair and maintenance of vehicles.
CDK provides solutions to dealers in more than 100 countries, serving more than 27,000 retail locations, and most automotive manufacturers.
Effective July 1, 2016, CDK restructured its operations with a reduction from 3 to 2 main operating groups: CDK North America (consisting of CDK North America: Retail Solutions North America and CDK North America: Advertising North America) and CDK International (fka Automotive Retail International (ARI)).
This change included combining the Digital Marketing and the Automotive Retail North America (ARNA) operations into a single organization thus creating a single North America Sales organization, and forming a single global R&D organization.
CDK estimates it has a ~43% market share in North America. Of its total annual revenue, ~60% – 65% is of a recurring nature through multiyear subscription-based contracts. The remainder of its business is ~10% transaction-related and ~20% – 25% is tied to many of the subscription-based contracts but is more of a one-time nature.
CDK is currently in its first year of a 3 year transformation plan aimed at significantly improving its profitability and improving the customer experience. The goal of the transformation plan from a profitability perspective is to expand EBITDA margins from ~22% to ~35% at the end of fiscal 2018 (end of June 2018).
Q2 2017 Financial Results
Full details can be found in CDK’s February 2, 2017 Earnings release. Highlights are provided below.

CDK Q2 2017 Results
FCF for the 6 months ending December 31, 2016 amounted to $0.1337B vs. $0.0056B for the same period in 2015. For comparison purposes, FCF for FY2015 and FY2016 amounted to $0.204B and $0.256B, respectively.
CDK announced an increase in its adjusted EBITDA margin to 32.8%, a 550 bps increase over Q2 2016 which keeps it on track to meet the 35% target margin for FY2018.
In mid-January 2017 CDK returned $1B of capital to its shareholders in the 2016 calendar year. In Q2, CDK returned a total of $0.37B to shareholders through $0.02B in dividend payments, $0.02B of open market share repurchases, and $0.33B in accelerated share repurchases (“ASR”). The ASR is currently in-market and is expected to be completed in Q4 2017.
The intent is to return $0.75B – $1B of capital per calendar year through 2019 using a combination of dividends and share repurchases. These returns will be funded by FCF and incremental borrowings intended to bring leverage, measured as financial debt, net of cash, divided by adjusted EBITDA, to a range of 2.5x to 3.0x over the period.
Outlook for Remainder of Fiscal 2017
CDK reported 5% revenue growth in FY2016 relative to FY2015 with 370 bps of margin expansion to 26.6%.
When it reported its FY2016 results, CDK provided FY2017 guidance showing revenue growing 4% – 5%, and EBITDA margin expanding 500 – 550 bps (31.6% increasing to 32.1%). It also projected EBITDA margin expansion of 36% – 38% for FY 2018 and 40%+ for FY 2019.
These projections have subsequently been amended wherein 4% – 5% revenue growth is projected for FY2017 and EBITDA margin will be in the 550 – 575 bps range.
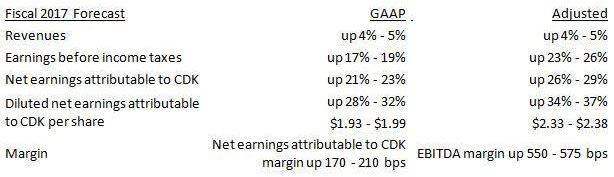
CDK FY2017 Forecast
A recent addition to the FY2017 forecast is $0.095B – $0.105B of incremental adjusted EBITDA attributable to the execution of CDK’s business transformation plan. It anticipates a YoY impact to earnings and margins for the remainder of fiscal 2017 due to incremental interest expense related to additional borrowings executed in the Q2 2017 and incremental incentive compensation expense in the Q4 2017, on the basis that it executes its business transformation plan.
Valuation
Mr. Market must have liked what it saw in CDK’s results as the stock has popped roughly $1.5 to just over $63.50 (a ~2.4% increase from the February 1, 2017 close) as I compose this.
Let’s see if CDK is priced to my liking.
I enclose earnings estimates which I generated from TD WebBroker and from the most recent ValuEngine report. The mean FY2017 non-GAAP estimated EPS from 6 analysts reflects a figure of $2.36.
The ValuEngine report reflects a mean FY2017 non-GAAP estimate of $2.34 from 5 analysts.
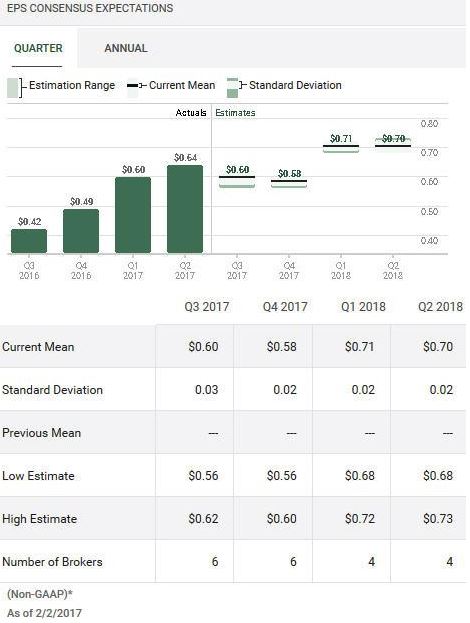
Source: TD Bank WebBroker – CDK Projected Quarterly EPS
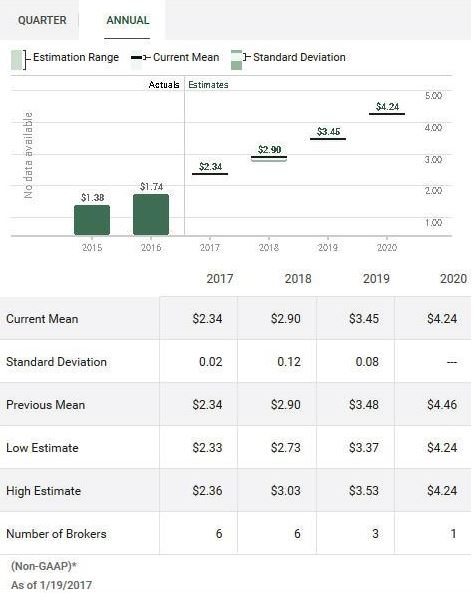
Source: TD Bank WebBroker – CDK Projected Annual EPS
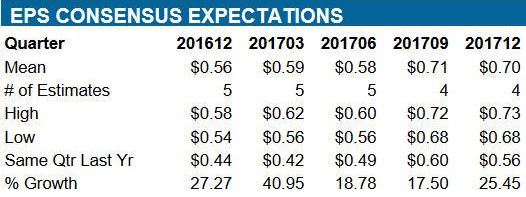
Source: ValuEngine – CDK Projected Quarterly EPS
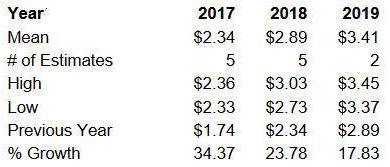
Source: ValuEngine – CDK Projected Annual EPS
Now let’s look at CDK from a dividend yield perspective. Even though the dividend has been increased to $0.14/quarter or $0.56/year, the dividend yield is still sub 1%. Clearly, the dividend yield on CDK will not be the primary metric that will sway my decision to acquire more shares. The high growth nature of the business and the potential for capital gains would be the reason why I would purchase additional CDK shares.
I don’t like to pay more than 20 times projected EPS so if I use a mid-point of $2.35 for FY2017, I get a price of $47 which is $17 lower than the current market price.
If you need the dividend income, even a drop in price to $47 would probably not be enough to sway you to buy CDK. A $0.56 annual dividend and a $47 stock price would only give you a dividend yield slightly over 1.1%.
CDK Global Stock Analysis – Final Thoughts
CDK has certainly increased dramatically since we acquired shares as a result of this entity having been spun-off from ADP. While we have benefited nicely from this run-up and I like the company, I am of the opinion it is currently much too expensive at this stage to acquire more shares.
CDK is on my radar screen and you may wish to put it on your radar screen unless your investment profile is such that you require dividend income.
Disclaimer: I have no knowledge of your circumstances and am not providing individualized advice or recommendations. I encourage you to conduct your own research and due diligence and to consult your financial advisor about your situation.
Disclosure: I am long CDK.
I wrote this article myself and it expresses my opinions. I am not receiving compensation for it and have no business relationship with any company mentioned.