
Summary
- Even investing in high quality companies can result in inferior investment returns. Investing in a high quality company does not mean invest at any price. Pay particularly close attention to valuation levels.
- We are in the late stages of one of the longest bull markets in US history. Investors should be cautious when making investments in the current environment.
- Keep some cash on the sidelines for when a correction does occur.
Introduction
I am becoming increasingly concerned that the stock price of several great companies is becoming detached from the underlying fundamentals of the business. I am also of the opinion investors should take into consideration the following in their investment decision making process:
- the introduction of tariffs on products imported to the US coupled with retaliatory tariffs foreign countries will be levying on goods exported from the US is likely to upend the ‘global business ecosystem’;
- there has been a resurgence in volatility during the first half of 2018;
- we are in the late stages of one of the longest bull markets in US history;
- the S&P500 (SPX) is up 2.3% YTD and the Dow Jones Industrial Average (DJIA) is down 1.2% YTD with the indexes having remained in a tight trading range for months.


In my opinion, a market correction is overdue. I am, therefore, being extremely cautious when it comes to increasing my equities exposure. In fact, I have written several articles about great companies with the vast majority of my conclusions being that I will continue to be patient and to wait for more reasonable valuations.
In today’s article I touch briefly on three great companies worthy of holding for the long-term which have just recently released earnings results. Regrettably, the stock price of each company has experienced a dramatic surge to the point where these companies are priced to perfection; their respective current valuation will likely make it difficult to generate reasonable rates of return over the next few years.
I have previously written articles on the first two companies and provide links to them. The third company is one I have not previously reviewed. You may have heard the name but are not entirely familiar with the company’s background. I, therefore, provide more detail on this company.
![]()
Nike, Inc.
I view Nike (NYSE: NKE) as a great company and currently hold shares in the FFJ Portfolio and reinvest all dividends. My previous NKE articles can be found here, here, and here.
NKE released its Q4 and FY2018 results after the close of business on June 28 and on June 29 the stock jumped ~$8 to close at $79.68.
As you can see from the following 10 year chart which compares NKE’s return relative to that of the S&P500, long-term NKE shareholders have been rewarded handsomely.

Source: Tickertech
Q4 and FY2018 Results
On June 28, NKE released its Q4 and FY2018 results (and here).
Included in NKE’s earnings release was an announcement of a new 4 year $15B share repurchase program which will commence upon the completion of the existing $12B share repurchase program to be completed within FY2019.
Although Revenue increased 6% to $36.397B from FY2017, gross margin dropped 80 basis points to 43.8% from 44.6% in FY2017. This decline was attributed to 90 basis points of unfavorable changes in foreign currency exchange rates.
Income before taxes declined 11% from $4.886B to $4.325B largely due to higher selling and admin expenses as NKE increased its investments to activate the Consumer Direct Offense including product innovation and digital and speed capabilities.
The significant negative variance in net income relative to FY2017 is attributed to the effective tax rate of 55.3% compared to 13.2% in fiscal 2017 arising from significant charges related to the enactment of the Tax Act.
FY2019 Guidance
Management has revised its FY2019 Revenue growth to the high-single-digit range versus the previously communicated mid-to-high-single-digit revenue growth projection. This improved outlook takes into account building consumer demand for NKE although management is mindful of renewed FX volatility and the recent strengthening of the US dollar.
Valuation
NKE reported $1.19 in EPS and $1.17 in diluted EPS versus $2.56 and $2.51 in FY2017. The FY2018 figures, however, are distorted by the tax hit NKE incurred in FY2018.
At the time of my November 20, 2017 post, the mean projected adjusted EPS from 36 brokers was $2.32. This translated into a ~25.5 PE based on the $59.19 stock price as at the close of business on November 17, 2017. This was relatively consistent with recent historical levels.
When I wrote my March 24, 2018 article, the current mean consensus EPS estimate from 37 brokers for FY2018 had been revised is $2.35. Using the March 23, 2018 $64.63 closing stock price I arrived at a forward adjusted PE of ~27.5 and I viewed NKE as too expensive.
Now, the consensus EPS estimate from multiple analysts for FY2019 EPS is $2.66. On the basis of the current $79.68 stock price, NKE is trading at a ~29.95 PE multiple. If NKE was expensive before, it is even more expensive now!
Final Thoughts
I recognize the NKE is rarely ‘on sale’ and another catastrophic event such as the Financial Crisis would likely be required in order to acquire NKE with a PE in the upper teens.
I am prepared to wait before acquiring additional shares until such time as NKE retraces to a ~25 PE based on adjusted earnings; ~$67 (or lower) would be acceptable based on current projections. A pullback of ~$12.68 from the current market price is ~16% which is not totally out of the realm of possibility.
![]()
McCormick & Company, Incorporated
McCormick (NYSE: MKC) is the second high quality company I recommend as a long-term investment. My previous MKC articles can be found here and here.
MKC released its Q2 2018 results on June 28 and investors pushed up the stock price from ~$106 to ~$115.
As you can see from the following 10 year chart which compares MKC’s return relative to that of the S&P500, long-term MKC shareholders have been rewarded handsomely.

Source: Tickertech
Q2 and FY2018 Results
MKC’s Q2 2018 results can be found here.


Source: MKC Q2 2018 Earnings Conference Call Presentation – June 28, 2018
FY2018 Guidance
MKC projects 2018 EPS of $6.85 – $6.95 versus $3.72 in 2017. Excluding an anticipated favorable per share impact in 2018 of $2.00 consisting of the estimated net favorable non-recurring impact of the U.S. Tax Act and a partial offset by the estimated effects of transaction and integration expenses related to the Reckitt Benckiser (RB) Foods acquisition and special charges, MKC projects 2018 adjusted EPS of $4.85 – $4.95. This is an increase of 14% – 16% from $4.26 in adjusted EPS in 2017 and includes an estimated 1% favorable impact from currency.

Source: MKC Q2 2018 Earnings Conference Call Presentation – June 28, 2018
Management expects the impact of favorable currency to be greater in the first half of the year than in the second half.
Another year of strong cash flow is projected and plans are to reduce debt levels and to return a significant portion to MKC’s shareholders through dividends.
Valuation
When I wrote my March 7 article, MKC’s FY2018 forecast was for diluted EPS in the range of $6.89 – $7.14/share and adjusted diluted EPS in the range of $4.80 – $4.90/share.
Using the March 6 closing stock price of ~$110, the forward adjusted PE range was ~22.5 – ~23 and the forward PE is ~15.5 – ~16.
A forward adjusted PE of ~20 or below is what I would be prepared to pay for MKC. On the basis of the FY2018 adjusted diluted EPS projection of $4.80 – $4.90 then a purchase price right around the $100 mark would be an acceptable entry point for me.
MKC now projects FY2018 EPS $6.85 – $6.95. Since this includes an anticipated $2/share favorable non-recurring impact of the U.S. Tax Act which is partially offset by the estimated effects of transaction and integration expenses related to RB Foods and special charges, I will base my valuation on projected adjusted EPS of $4.85 – $4.95.
MKC is currently trading at $116.09. Using the projected adjusted EPS range of $4.85 – $4.95, MKC’s forward PE range is ~23.5 – ~23.94. This level is higher than when I wrote my previous article at which time I thought MKC was slightly overvalued.
Final Thoughts
I would gladly add MKC to my holdings but I view it as too richly valued. If I use the projected adjusted EPS range of $4.85 – $4.95 and my preference for a forward adjusted PE of ~20 or below then I would like to see MKC retrace to at least ~$100. Based on the current price of $116.09, MKC’s stock price would need to retrace ~14% which may not be unreasonable to expect if we get an overdue market correction.
![]()
Accenture plc
Accenture (NYSE: ACN) is the third high quality but overvalued company I touch upon in today’s article.
ACN released its Q3 results June 28 and the stock popped from ~$156 to close at ~$164.50.
As you can see from the following 10 year chart which compares ACN’s return relative to that of the S&P500, long-term ACN shareholders have been rewarded handsomely.
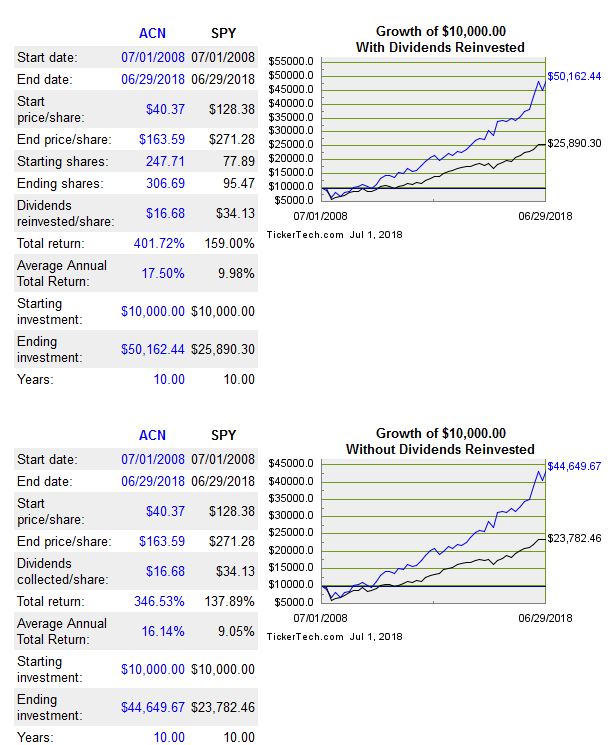
Source: Tickertech
Business Overview
Some of you may be old enough to remember when ACN was in the business and technology consulting division of accounting firm Arthur Andersen LLP.
At one time, Arthur Andersen LLP was one of the “Big Five” accounting firms (along with PricewaterhouseCoopers, Deloitte Touche Tohmatsu, Ernst & Young, and KPMG). It provided auditing, tax, and consulting services to large corporations and in 2001 it had become one of the world’s largest multinational companies. Arthur Andersen, however, voluntarily surrendered its licenses to practice as Certified Public Accountants in the United States in 2002 after having been found guilty of criminal charges relating to its auditing of Enron; Enron was a Texas based energy corporation which filed for bankruptcy in 2001.
In 1989, Andersen Consulting and Arthur Andersen became separate units of Andersen Worldwide Société Coopérative (AWSC).
Throughout the 1990s, the level of tension between Andersen Consulting and Arthur Andersen increased. The reason for this is that Andersen Consulting was paying Arthur Andersen up to 15% of its annual profits. One of the terms negotiated in the 1989 split of the two companies was that the more profitable unit would have to pay the other 15% of the difference between the profits of the two companies.
This term of the agreement was all that much more a bone of contention with Andersen Consulting in that Arthur Andersen was competing with Andersen Consulting through its own newly established business consulting service line called Arthur Andersen Business Consulting. The dispute came to a head in 1998 when Andersen Consulting put the 15% transfer payment for that year and future years into escrow and issued a claim for breach of contract against AWSC and Arthur Andersen.
In August 2000, arbitration with the International Chamber of Commerce concluded and Andersen Consulting broke all contractual ties with AWSC and Arthur Andersen. As part of the arbitration settlement, Andersen Consulting paid the sum held in escrow ($1.2B) to Arthur Andersen, and was required to change its name, resulting in the entity being renamed Accenture; “Accenture” is supposedly derived from “Accent on the future”.
Q3 2018 Financial Results and FY2018 Guidance
ACN’s Q3 2018 results and guidance for the remainder of the current fiscal year can be found here.


Source: ACN Q3 2018 Earnings Conference Call – June 28, 2018
Credit Ratings
Moody’s has rated ACN’s long-term debt A1 since it initiated coverage in September 2009. This is the top tier of the upper medium grade category. S&P Global has rated ACN A+ since initiating coverage in January 2002. This long-term debt rating is also the top tier of the upper medium grade category.
These attractive credit ratings give a conservative investor like me the peace of mind that any impairment to my investment is unlikely to occur within the short-term.
Free Cash Flow (FCF)
FCF for a company is like oxygen to a human. You can hold your breath for a short period of time but try holding your breath for a long time and the outcome is unfavorable. The same goes with a company that goes without FCF for a prolonged period.
I am encouraged to see that management has revised its FY2018 upwards. ACN now expects operating cash flow to be in the range of $5.5B – $5.8B versus the previous $5.2B – $5.5B range. When $0.6B in property and equipment additions is backed out, management now expects FCF to be $4.9B – $5.2B versus the previous $4.6B – $4.9B projection.
Valuation
ACN closed at $163.59 on June 29 and management now expects GAAP diluted EPS to be $6.26 -$6.31 which includes a $0.40 impact from charges related to tax law changes. Previously, management expected $6.40 – $6.49 which included a $0.21 charge related to tax law changes. If we exclude the tax charges, ACN expects EPS to be $6.66 – $6.71 versus the previous $6.61 – $6.70.
Using the current stock price and the new EPS range of $6.66 – $6.71 we get a forward PE range of 24.38 – 24.56. This is above the 5 year historical average of ~20.
Dividend, Dividend Yield, Dividend Payout Ratio, Stock Splits, and Share Repurchases
ACN pays a dividend on a semi-annual basis and its dividend history can be found here; the website does not reflect up to date information as ACN paid a semi-annual cash dividend of $1.33/share on November 15, 2017 and $1.33/share on May 15, 2018; ACN’s total dividend payments for FY2018 amounts to $2.66/share.
Based on the current $163.59 stock price, this dividend yields ~1.63%. Looking at the dividend history for which a link was earlier provided, we see that ACN’s current dividend yield is below the norm.
In my opinion, I envision ACN will declare in September a ~10% increase in its $1.33 semi-annual dividend to ~$1.46 semi-annually or $2.92 on an annual basis. If my assumption is correct this would yield ~1.79% based on the current $163.59 stock price. Even with this projected dividend increase, ACN’s dividend is below that reported for FY2010 to FY2017.
Using the new EPS range of $6.66 – $6.71 and my $2.92 estimate for what investors can expect in the form of an annualized dividend come September 2018, we get a dividend payout ratio of ~43.5% – 43.8%. While this level is acceptable for my purposes I expect the dividend payout ratio will be more favorable when ACN releases its FY2019 earnings guidance in late September 2018.
In ACN’s FY2017 10-K, the company indicated it intended to continue to use a significant portion of cash generated from operations for share repurchases during FY2018. The number of shares ultimately repurchased under its open-market share purchase program, however, would vary depending on numerous factors such as share price and other market conditions, the ongoing capital allocation planning, the levels of cash and debt balances, other demands for cash such as acquisition activity, general economic and/or business conditions, and board and management discretion.
In Q3 2018, ACN repurchased or redeemed 4.7 million shares including 4.5 million shares repurchased in the open market, for a total of $0.72B. This brings the total share repurchases and redemptions for the first three quarters of FY2018 to 13.9 million shares, including 10.6 million shares repurchased in the open market, for a total of $2.09B.
The total remaining share repurchase authority as at the end of Q3 (May 31) was ~$1.45B.
Final Thoughts
ACN has certainly rewarded long-term shareholders. My concern at this stage is that it is overvalued based on historical valuation and based on earnings guidance for FY2018.
Since ACN’s dividend yield is low (like NKE and MKC), investors need to be extra cautious in not overpaying for the company’s shares. When you overpay for a low dividend yielding stock you stand to suffer if valuation returns to historical norms and you don’t get the luxury of a reasonable dividend to partially offset the sting from a price correction.
Investors need to also be cognizant that ACN only distributes its dividend semi-annually. There is nothing wrong with this as long as you are aware of this dividend distribution frequency.
I will continue to monitor ACN in the hopes of a retracement to ~$134 (or lower) which would be a PE of ~20 (this is more in-line with recent historical PE levels) based on the new EPS range of $6.66 – $6.71. With ACN currently trading at $163.59, a pullback to ~$134 is ~18%. This pullback is slightly higher than that I indicated I would require for NKE and MKC but I am prepared to be patient.
Thanks for reading!
Note: I sincerely appreciate the time you took to read this article. Please send any feedback, corrections, or questions to charles@financialfreedomisajourney.com
Disclaimer: I have no knowledge of your individual circumstances and am not providing individualized advice or recommendations. I encourage you not to make any investment decision without conducting your own research and due diligence. You should also consult your financial advisor about your specific situation.
Disclosure: Long NKE. I do not hold a position in MKC or ACN and do not intend to initiate a position in either company within the next 3 business days.
I wrote this article myself and it expresses my own opinions. I am not receiving compensation for it and have no business relationship with any company whose stock is mentioned in this article.