I view the Financial Data & Stock Exchanges industry as an attractive industry in which to invest for the long-term. I currently have exposure to the following in retirement accounts, for which I do not disclose details, and/or in the FFJ Portfolio:
- S&P Global (SPGI) – guest post at Dividend Power
- Moody’s (MCO)
- CME Group (CME) – guest post at Dividend Power
- Intercontinental Exchange (ICE)
Please click on the links above to read my most recent posts about each company.
These industry participants will release earnings on the following dates.
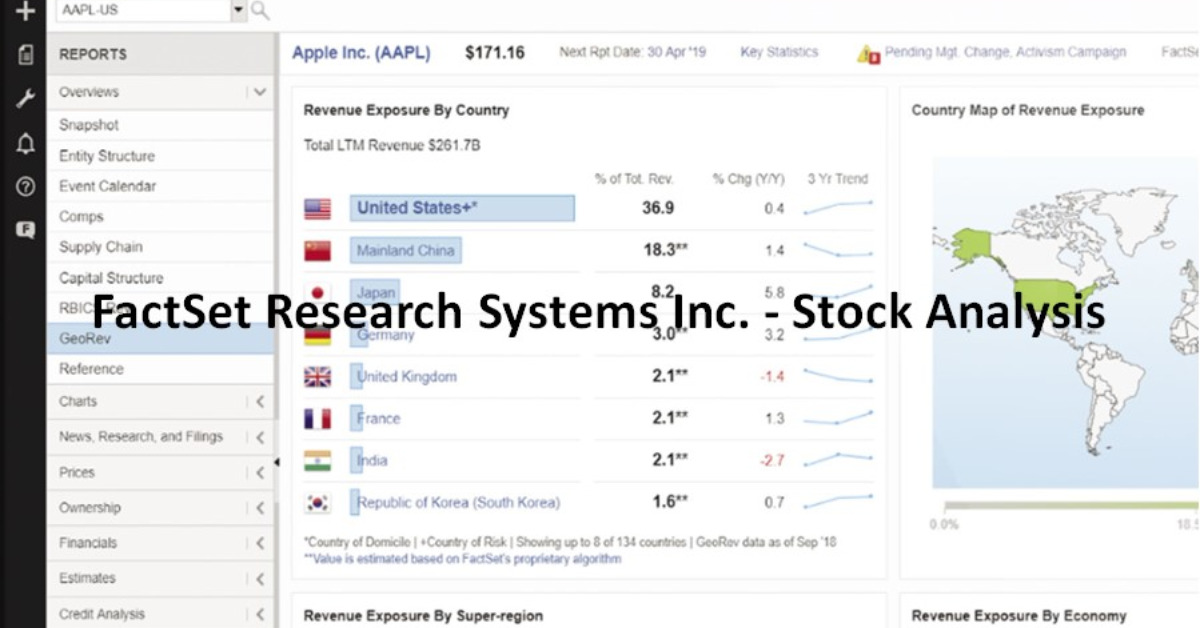
- FactSet Research Systems Inc. (FDS) – released September 28 (access the company brochure here and learn about the company here)
- Nasdaq, Inc. (NDAQ) – October 20
- MSCI Inc. (MSCI) – October 26
- S&P Global Inc. (SPGI) – October 26
- Morningstar, Inc. (MORN) – October 27
- CME Group Inc. (CME) – October 27
- Intercontinental Exchange, Inc. (ICE) – October 28
- Moody’s Corporation (MCO) – October 28
- CBOE Global Markets, Inc. (CBOE) – October 29
- TMX Group Limited (X.to) – November 8
I intend to review each company shortly following their respective earnings release.
Value Line, Inc. (VALU) released its Q1 2022 results for the quarter ending July 31 on September 13, 2021. This is a small-cap company ($0.31B). I do not invest in small-cap companies, and therefore, do not intend to review it.
In addition to the above, FDS has identified its largest competitors to include Bloomberg L.P., Refinitiv (formerly part of Thomson Reuters), and S&P Global Market Intelligence. Other competitors and competitive products include online database suppliers and integrators and their applications, such as BlackRock Solutions, Morningstar Inc. and MSCI Inc. Many of these firms provide products or services similar to FDS’s offerings.
Factset Research – Stock Analysis – Industry Overview
FDS is part of the financial information services industry. It provides financial data and workflow solutions to the global investment community.
I deem the entry barriers to be high since it would be difficult for new industry participants to quickly replicate the extensive data offered by each industry participant. In addition, these industry participants provide applications, including client support and service offerings, that are entrenched in their respective clients’ workflow given the downloadable functionality, instant data refresh and portfolio analysis/screening capabilities offered.
This very competitive market is comprised of both large, well-capitalized companies and smaller, niche firms including market data suppliers, news and information providers and many third-party content providers that supply FDS with the financial information included in its products.
In addition to all the companies reflected above, companies in other industries offer products and services that may compete with those offered by FDS. Thomson Reuters Corporation and IHS Markit Ltd. are two such companies where stocks screeners identify them as being members of the Consulting Services or the Specialty Business Services industries.
The space in which FDS operates is continually evolving and I suspect this will persist. In fact, I touch upon Thomson Reuters’ divestiture of Refinitiv in my February 26, 2021 post. I further discuss the acquisition of IHS Markit Ltd. (INFO) by SPGI in various posts and most recently in my guest post at Dividend Power for which I provide a link earlier in this post; this merger is set to close in Q4 2021.
In my most recent ICE post, for which I provide a link above, I touch upon how this stock exchange has made acquisitions and divestitures that are beyond what was once its core business. It, for example, acquired Ellie Mae which provides technology solutions that enable lenders to originate more loans, lower origination costs, and reduce the time to close.
Given the track record of mergers and acquisitions over the years, I would not be the least bit surprised to learn that FDS is (or will become) an acquisition target. FDS’s market cap is currently ~$15.7B which pales in comparison to other recent mergers and acquisitions; INFO’s market cap is ~$49B.
Factset Research – Stock Analysis – Business Overview
FDS and its wholly-owned subsidiaries is a global provider of integrated financial information, analytical applications and industry-leading services for the investment and corporate communities.
It was founded in 1978, has been publicly held since 1996, and has evolved considerably over the years.

Source: FDS FY2020 10-K
The company focuses on growth through three segments:
- the Americas (formerly known as the U.S.);
- EMEA (Europe and Africa, formerly known as Europe); and
- Asia Pacific.
The following charts depict revenue related to FDS’s reportable segments.

Source: FDS FY2020 10-K
Within each segment, FDS primarily delivers insight and information through the following 4 workflow solutions:
- Research;
- Analytics and Trading;
- Content and Technology Solutions; and
- Wealth.
Beginning in FY2022 (commencing the beginning of October 2021), FDS is changing its workflow solutions into 3 businesses. The desktop portion of the Wealth business is combined with Research and Wealth digital solutions is combined with Content and Technology Solutions.

FDS serves a wide range of financial professionals, which include but are not limited to portfolio managers, investment research professionals, investment bankers, risk and performance analysts, wealth advisors, and corporate clients.
By combining dedicated client service with open and flexible technology offerings, such as a configurable desktop and mobile platform, comprehensive data feeds, an open marketplace,
digital portals and application programming interfaces, FDS provides both insights on global market trends and intelligence on companies and industries, as well as capabilities to monitor portfolio risk and performance and execute trades.
Revenue is primarily derived from subscriptions to products and services such as workstations, portfolio analytics, enterprise data, and research management.
Part 1 of FDS’s FY2020 Annual Report and 10-K has a comprehensive overview of the company’s history, business strategy, the competitive landscape, risk factors, and more.
Factset Research – Stock Analysis – Financials
Q4 and FY2021 Results
On September 28, 2021, FDS released Q4 and FY2021 results. The FY2021 10-K is not yet available but the Form 8-K provides sufficient information for current purposes. The accompanying earnings presentation, for which I provide links within this post, provides additional information.
FY2022 Guidance
Guidance is reflected in the following images.


Factset Research – Stock Analysis – Credit Ratings
No major rating agency currently rates FDS.
Looking at the FY2020 10-K and the Form 8-K released September 28, 2021, however, we see that FDS’s debt is very manageable and it generates very strong Free Cash Flow.
Short-term debt is $315.7 million versus cash and cash equivalents and investments of $717.9 million.
On March 29, 2019, FDS entered into a credit agreement with PNC Bank, National Association as the administrative agent and lender. This credit agreement provides for a $750.0 million revolving credit facility with a maturity date of March 29, 2024. Subject to certain requirements, FDS can also arrange for additional borrowings with PNC for an aggregate amount up to $500.0 million, provided that any such request for additional borrowings must be in a minimum amount of $25.0 million.
Outstanding long-term debt is $574.7 million as of FYE2021.
All outstanding loan amounts are reported as Long-term debt within the consolidated balance sheets in that the principal balance is payable in full on the maturity date.
Looking at the historical Consolidated Statements of Cash Flows, we see FY2011 – FY2021 Free Cash Flow (FCF) of $178, $209, $251, $247, $281, $283, $284, $352, $368, $428, and $494 (in millions).
The following reflects FCF for Q4 in FY2020 and FY2021 and FY2020 and FY2021.

Factset Research – Stock Analysis
Dividend and Dividend Yield
Investors seeking to generate dividend income or earn an attractive dividend yield will be disappointed to learn that FDS’s $0.82 quarterly dividend only yields ~0.8% based on the current ~$415 share price; FDS’s dividend and stock split history is accessible here.
The low dividend yield is of little concern to me because I approach investments from a total potential investment return. The low dividend yield, however, makes it increasingly important that shares be acquired at a reasonable valuation.
In FY2021, FDS returned $382.6 million to shareholders in the form of share repurchases ($264.702 million vs $199.6 million in FY2020) and dividends ($117.927 million vs 110.4 million in FY2020). This represents a return of 69% of FY2021 FCF and proceeds from employee stock plans.

FDS has a share repurchase program under which there is no defined number of shares to be repurchased over a specified timeframe through the life of the share repurchase program. It is expected that share repurchases will be paid using existing and future cash generated by operations. Repurchases of shares of common stock are made in the open market and privately negotiated transactions, subject to market conditions.
The average shares outstanding (in millions) in FY2011 – FY2021 is 47.4, 45.8, 44.6, 43, 42.2, 41.4, 39.6, 39.4, 38.9, 38.6, and 38.6.
Factset Research – Stock Analysis – Valuation
FY2022 diluted EPS guidance provided by management is $11.60 – $11.90. With shares trading at ~$415, the forward diluted PE is ~34.9 – ~35.8.
By way of comparison, FY2011 – FY2021 diluted PE levels are 23.46, 20.77, 23.97, 27.87, 27.93, 19.41, 29.12, 27.87, 28.73, 33.79, and 40.05.
FY2022 adjusted diluted EPS guidance provided by management is $12 – $12.30 thus giving us a forward adjusted diluted PE range of ~33.7 – ~34.6.
Broker guidance derived from the two online trading platforms I use is:
- FY2022 – 15 brokers – mean of $12.22 and low/high of $12.11 – $12.45. Using the mean estimate, the forward adjusted diluted PE is ~34 and ~33.3 if I use $12.45.
- FY2023 – 15 brokers – mean of $13.37 and low/high of $12.92 – $14.60. Using the mean estimate, the forward adjusted diluted PE is ~31 and ~28.4 if I use $14.60.
- FY2024 – 7 brokers – mean of $14.69 and low/high of $13.73 – $16.47. Using the mean estimate, the forward adjusted diluted PE is ~28.3 and ~25.2 if I use $16.47.
I am reluctant to use FY2024 earnings estimates since much can change in 2 years. Furthermore, fewer than half the brokers that cover FDS provide FY2024 earnings estimates.
FDS also provides consensus estimates for metrics other than P/E. We see that FY2022 and FY2023 price/cash flow per share estimates are much higher than historical levels. In addition, other metrics are somewhat elevated relative to historical levels.

Factset Research – Stock Analysis – Final Thoughts
While FDS is a company in which I would consider initiating a position, I do not like the current valuation. I do not, therefore, intend to initiate a position at this point.
Stay safe. Stay focused.
I wish you much success on your journey to financial freedom!
Note: Please send any feedback, corrections, or questions to finfreejourney@gmail.com.
Disclosure: I am long SPGI, MCO, CME, and ICE. I do not currently hold a position in FDS and do not intend to initiate a position within the next 72 hours.
Disclaimer: I do not know your circumstances and do not provide individualized advice or recommendations. I encourage you to make investment decisions by conducting your own research and due diligence. Consult your financial advisor about your specific situation.
I wrote this article myself and it expresses my own opinions. I do not receive compensation for it and have no business relationship with any company mentioned in this article.