 Summary
- Becton Dickinson released its Q4 and FY2018 results and FY2019 Guidance on November 6th.
- Integration of Carefusion and C.R. Bard is proceeding as planned and management expects strong underlying growth of approximately 16% – 17% on a currency-neutral basis which is in excess of the C.R. Bard deal model.
- BDX expects to deliver adjusted EPS of $12.05 – $12.15, which represents reported growth of ~10%.
- Management is committed to deleveraging the Balance Sheet to below 3x over 3 years and $1.2B of debt was repaid in FY2018 which is slightly ahead of expectations.
Introduction
On January 10th, 2018 I wrote an article regarding Becton Dickinson (BDX) entitled ‘Becton Dickinson – Be Aware of the Elevated Risk in this Great Company’. In that article I provided a company overview which included the principal product lines of BDX’s two worldwide business segments: BD Medical and BD Life Sciences, touched upon the C.R. Bard Acquisition, and the competitive landscape.
I followed up that article with another on January 30th after BDX’s Annual Meeting of Shareholders held on January 23.
In both articles I indicated that I was of the opinion that BDX shares were richly valued and that readers should wait for a pullback.
In my January 30th article I analyzed BDX on the basis of a closing stock price of $246.28 on January 26, 2018. If you look at BDX’s one year chart you will see that BDX’s stock price dropped and never recovered to the January 26th level until around mid-July. After mid-July, BDX’s stock price shot up making it even more expensive than when I had looked at it in early 2018.
Subsequent to the beginning of October, BDX’s share price has pulled back nicely and on November 4th I published an article in which I indicated that I had made a decision to liquidate my Philip Morris (PM) shares and to redeploy those funds to acquire additional Becton Dickinson (BDX) shares.
Based on my research I felt BDX’s long-term growth prospects were solid and I strongly suspected the earnings release on November 6th would be positive. On this basis I carried out my trades on November 5th.
The additional BDX shares I acquired are held in an account in which I already own BDX shares (several hundred acquired in February 2009 and more acquired in June 2012); I do not disclose specifics for the account in which these BDX shares are held.
Much to my surprise I noticed that BDX’s market price plunged in pre-market activity on November 6th from the November 5th ~$237 market close. I looked at the earnings release in the early morning and nothing looked out of sorts so I chalked up the price plunge to Mr. Market’s bipolarity.
Fast forward to the November 6th market close and BDX has not only recovered the price plunge but it has closed at $240.69 which is $3.37 higher than the previous business day’s close. BDX’s stock price literally swung ~$14.70 on November 6th!
I have absolutely no clue in which direction a company’s stock price is going to go in the short-term. What transpired with BDX’s stock price reaffirms the need for me to focus on the long-term.
Now that Q4 and FY2018 results and FY2019 projections have been released I thought it would be an opportune time to analyze BDX.
Q4 and FY2018 Results
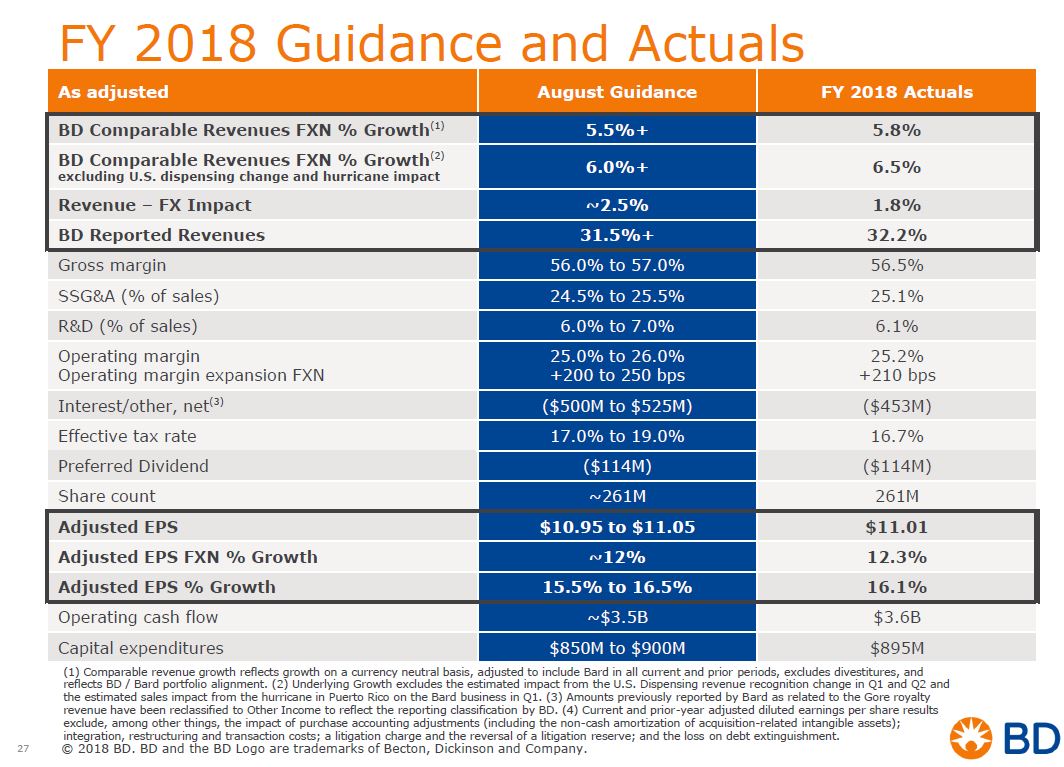
BDX’s Q4 and FY2018 results and guidance for FY2019 can be accessed here.


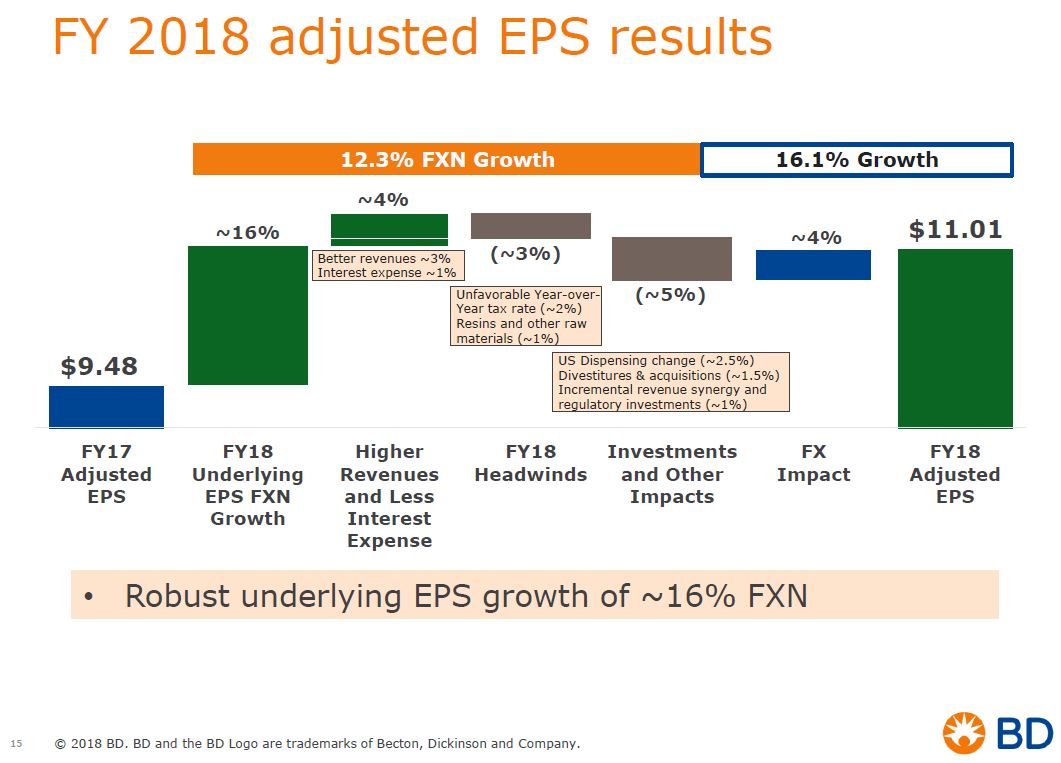
Source: BDX – Q4 2018 Earnings Presentation – November 6 2018
2019 Guidance
The following guidance was communicated on the November 6th analyst conference call.
- Currency-neutral revenue growth of 5% to 6% which is in line with the expectations it has been communicating since the announcement of the C.R. Bard deal.
- Revenue and EPS growth is expected to be weighted toward the back half of the year. And any FX headwind will be most pronounced in Q1.
- On the FY2019 EPS guidance, management expects strong underlying growth of approximately 16% – 17% on a currency-neutral basis. This is in excess of the C.R. Bard deal model and is driven by revenue growth and robust operating performance.
- A lower effective tax rate is expected to contribute ~3% to EPS growth bringing total underlying EPS growth to ~20%.
- An effective tax rate of 14% – 16% is expected in FY2019.
- Raw material pressures are expected to increase throughout 2018 and accelerated into FY2019. This is primarily due to additional resin price increases driven by a supply-constrained market. In addition, the round of tariffs enacted in late September will result in an incremental headwind.
- Guidance assumes a normal flu season in contrast to the severe flu season in FY2018.
- BDX also faces a headwind from the sale of Advanced Bioprocessing that closed in October and the annualization of the divestitures to Merit Medical.
- On a currency-neutral basis, strong underlying performance is expected to drive adjusted EPS growth of 13% – 14% despite the above noted headwinds and divestitures.
- While currency was a benefit for the first 9 months of FY2018, it became a headwind in Q4. Based on current rates, BDX expects a sizable headwind of ~3.5% in FY2019.
- BDX expects to deliver adjusted EPS of $12.05 – $12.15, which represents reported growth of ~10%.
- BDX expects to achieve ~ $0.1B in cost synergies in FY2019 and is committed to realizing $0.3B in annualized cost synergies over the three-year deal period.
- Revenue growth for FY2019 is expected to be between 8.5% – 9.5% and reflects a currency headwind of approximately 200 basis points.
- Adjusted gross profit as a percentage of revenue is expected to be approximately 56.5% – 57.5% which is an increase of up to 100 basis points from FY2018. This is due to strong underlying performance which is partially offset by higher resin costs and the impact of tariffs.
- Adjusted SSG&A is expected to be 24.5% – 25.5% of sales which is about flat with FY2018.
- R&D investments are expected to be in line with FY2018 at ~6% of revenues.
- Operating margin between 25.5% – 26.5% of revenues is expected which is a growth of 100 – 150 bps.
- Adjusted average fully diluted share count is projected at ~275 million shares for FY2019 which is higher than the 264,621 reported for FY2018.
- Net income reflects the deduction of approximately $152 million of preferred dividends which are excluded from the adjusted diluted shares outstanding.
- Operating cash flow of ~$4.2B is projected for FY2019 and CAPEX is expected to be ~$0.9B.


Source: BDX – Q4 2018 Earnings Presentation – November 6 2018
Credit Ratings
If there was one concern I had with BDX when it acquired Carefusion and C.R. Bard, it was leverage. BDX was well aware that the investment community was looking closely at the leverage it was assuming for these acquisitions and one of the commitments it communicated was the deleveraging of the Balance Sheet to below 3x over 3 years.
In keeping with this commitment, BDX repaid ~$0.7B of debt in Q4 and a total of ~$1.2B in FY2018; this is slightly ahead of initial expectations. The gross leverage ratio is now at 3.9xs as at September 30 and BDX has reaffirmed its commitment to deleverage to below 3x times over three years.
As noted in my January 10, 2018 article, BDX’s risk profile has changed dramatically over the past decade as evidenced by the following chart. It was once a company rated high grade/upper medium grade. Currently it is rated as non-investment grade-speculative and lower medium grade. Refer to ratings metrics.

Readers who currently hold BDX or are contemplating the possibility of initiating a position in BDX must be cognizant of this change in BDX’s risk profile.
BDX Performance Relative to S&P500
The following graphs reflect the performance of BDX’s stock price for various timeframes.
This is how BDX has performed relative to the S&P 500 over the past 5 and 10 years.


This is how BDX has performed relative to the S&P 500 subsequent to the Carefusion acquisition.

This is how BDX has performed relative to the S&P 500 subsequent to the C.R. Bard acquisition.

Re: Tickertech
Note how BDX’s stock price is somewhat volatile. This is not surprising given that its Beta is ~1.2.
In my opinion, the gap between the value of a BDX investment versus the S&P500 has narrowed in recent years partly because BDX made a couple of very major acquisitions (Carefusion and C.R. Bard) in recent years. Integrating newly acquired companies is time consuming and very expensive. I am of the opinion that once the integrations have been completed BDX’s share performance will pick up relative to the S&P 500.
Dividends, Dividend Yield, and Dividend Payout Ratio
BDX is a member of the Dividend Aristocrats group since it has a history of having increased its annual dividend for 46 years in a row.
BDX’s dividend and stock split history can be found here but this section of the website is not kept current. The $0.75/share dividends distributed on June 29th and on September 28th are missing.
Within the next couple of weeks I anticipate that BDX will declare an increased dividend to be paid toward the last few days of December. In keeping with the dividend increases of recent years I anticipate a dividend increase in the ~8% – 10% range.
This is another company whose dividend yield is so low that many yield hungry investors will exclude it as a possible investment; the dividend yield is currently ~1.25%.
I fully recognize that BDX’s dividend payout ratio has deteriorated dramatically over the past 10 years. In FY2008, BDX’s dividend payout ratio was ~25.5%. In FY2017, the dividend payout ratio had increased to ~83%. In FY2018, BDX’s dividend exceeded diluted EPS but adjusted diluted EPS more than covered BDX’s dividend. I anticipate an improvement in BDX’s dividend payout ratio over the next few years as BDX makes progress in reducing its debt and integrating Carefusion and C.R. Bard.
Valuation
At the time of my January 10th article, a dozen analysts had projected adjusted EPS of $10.87 for FY2018. Based on the ~$223.7 closing stock price, the adjusted PE ratio was ~20.6.
At the time of my January 30th article, BDX was trading at $246.28. Using the projected adjusted EPS for FY2018 of $10.87, I arrived at a forward adjusted PE of ~22.66.
BDX is now trading at $240.69 and FY2019 EPS guidance is $12.05 – $12.15. If we use a mid-point of $12.10 we arrive at a forward adjusted diluted PE of ~19.9.
I purchased additional shares at $235.36 which gives me a forward adjusted diluted PE of ~19.45 but this is not much different from the ~19.9 valuation reflected above. Even though BDX has increased slightly from my purchase price I view the shares as being currently reasonably valued.
Final Thoughts
I view BDX as a high quality company which will most likely be worth a lot more in the future.
I have no reason to doubt that BDX will meet is deleveraging objectives and I fully anticipate that the major ratings agencies will upgrade BDX’s credit ratings within the next 3 years.
The share price has retraced to a level I deem to be reasonable and recommend BDX as an investment at the current price.
I wish you much success on your journey to financial freedom.
Thanks for reading!
Note: I sincerely appreciate the time you took to read this article. Please send any feedback, corrections, or questions to charles@financialfreedomisajourney.com.
Disclaimer: I have no knowledge of your individual circumstances and am not providing individualized advice or recommendations. I encourage you not to make any investment decision without conducting your own research and due diligence. You should also consult your financial advisor about your specific situation.
Disclosure: I am long BDX.
I wrote this article myself and it expresses my own opinions. I am not receiving compensation for it and have no business relationship with any company whose stock is mentioned in this article.