![]()
In my February 13, 2026 post I state that West Pharmaceutical (WST) is the silent winner of the GLP-1 obesity drug boom. Novo Nordisk (NVO) and Eli Lilly (LLY) may grab the headlines. WST, however, is the ‘picks and shovels’ play in this space.
I initiated a 100 share position in a ‘Core’ account in the FFJ Portfolio on November 25, 2022 @ $225.155. Following that purchase, WST’s share price has experienced considerable volatility. Over the years I have increased my exposure and currently hold 600 shares. Some of my purchases have been ill-timed which explains why my current average cost is $294.5923.
In my prior post I reflect the following as part of my ‘Final Thoughts’:
WST’s total rate of return has been less than impressive over the past 5 years. This, however, is because the 2020 COVID pandemic was a ‘blessing’ for WST. Furthermore, WST ramped up its annual CAPEX in recent years so as to properly position itself for long-term growth. The heavier than usual CAPEX period is now complete and I anticipate FCF will surge in the next few years. If this happens, I anticipate WST will fall back into investors’ good graces.
My last review was subsequent to the release of Q4 and FY2025 results. Given the April 23 earnings release, this is an opportune time to revisit this existing holding.
Business Overview
Refer to the company’s website and the FY2025 Form 10-K.
WST is the global market leader in primary packaging and delivery components for injectable therapeutics. It has a ~70% market share of elastomer components for injectable drugs. The remaining
30% is split between Switzerland’s Datwyler and narrow-moat AptarGroup.
Before investing in WST, it is important to recognize the following risks.
- WST’s customer base is significantly concentrated with the 10 largest customers accounting for ~50% of total sales.
- WST has invested heavily into automation to improve production efficiency. In FY2019 to the first quarter of FY2026, WST’s CAPEX is just over $1.9B. This has been funded primarily from cash flow and profits generated from normal business operations as net long-term debt at the end of Q1 2026 is ~$0.203B. The outcome of WST’s automation efforts is uncertain but given that WST has been in business for ~103 years, I am reasonably confident the company knows how to properly allocate capital to maintain its dominant market leader position.
- On March 9, 2026, WST announced that Mr. Eric M. Green, President, Chief Executive Officer and Chair of the Board of Directors informed the Board on March 6, 2026 of his intent to retire from those positions once his successor has been hired in order to ensure a smooth transition. The Board is engaging a leading executive recruiting firm to assist with the search for a successor and expects this transition to occur in the second half of 2026. Despite the imminent change in leadership I do not envision any major changes in the company’s strategy.
Divestiture Of SmartDose® 3.5mL On-Body Delivery System
In January 2026, WST reached a definitive agreement to sell the manufacturing and supply rights for the SmartDose® 3.5 mL On-Body Delivery System to AbbVie (ABBV) for ~$0.1125B. This transaction will likely close in mid-2026.
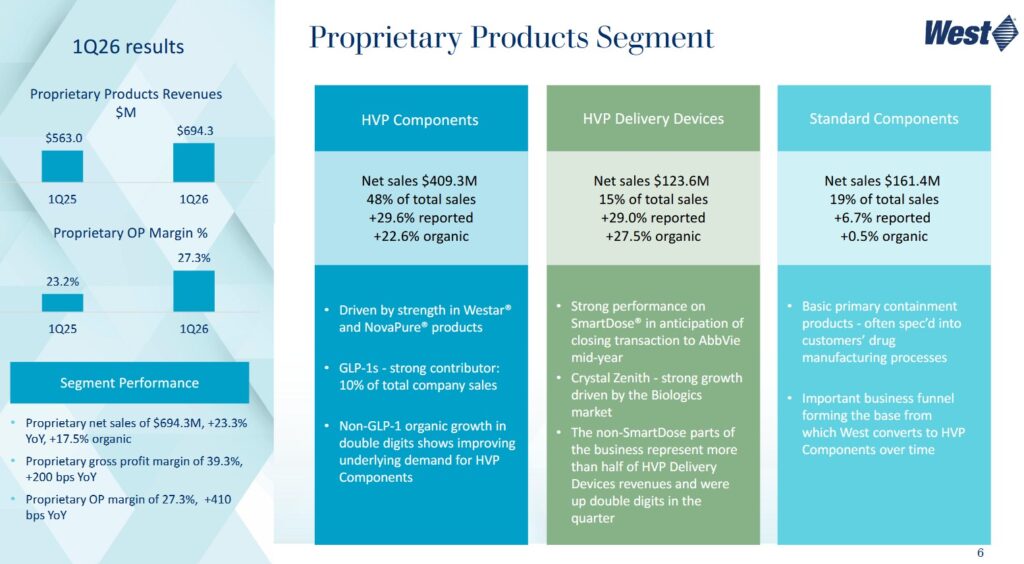
This is a partial divestiture of the SmartDose® platform and is part of a broader ‘portfolio review’. By transitioning the 3.5 mL product and its associated manufacturing facilities to ABBV, WST is narrowing its focus on its High-Value Products (HVP) and larger-dose delivery devices which are currently seeing massive demand due to the rise of biologics and GLP-1 medications.
The 3.5 mL system accounted for ~4% of WST’s FY2025 revenue; WST generated only $55 million in SmartDose® sales in the second half of FY2025.
WST is essentially offloading a ‘limited market’ niche, established product to a major customer while doubling down on the next generation of larger-volume delivery tech.
Despite this sale, WST is not exiting the SmartDose® business entirely. It will continue to develop and manufacture all other versions, including the SmartDose® 10 mL system and other adaptive technologies for larger-volume delivery.
Management expects this divestiture to contribute about 40 – 50 bps of margin expansion in late 2026 as it shifts focus to higher-growth areas.
Financials
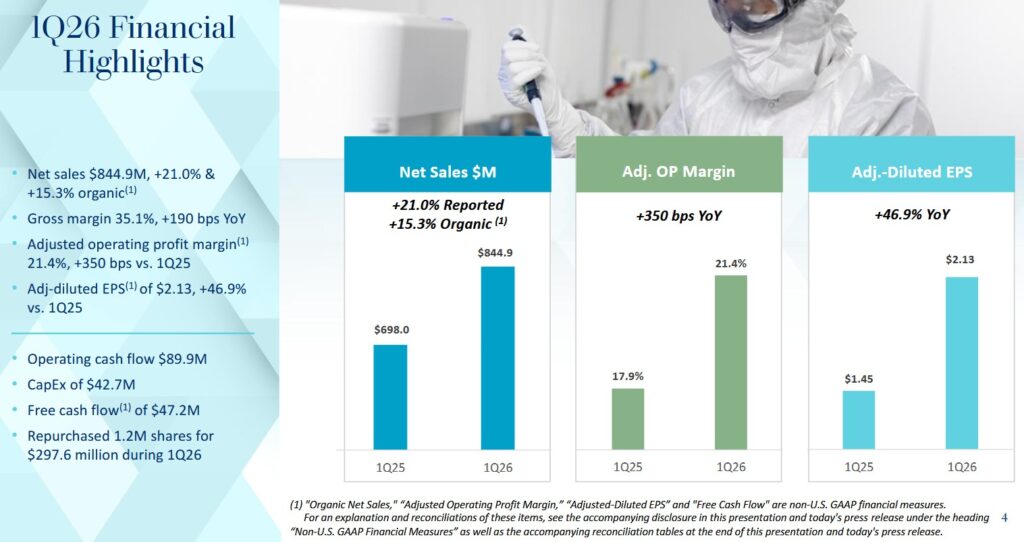
Q1 2026 Results
I recommend reviewing the Form 8-K and Form 10-Q (SEC Filings) and Q1 2026 Earnings Presentation.
Conventional And Modified Free Cash Flow (FCF) Calculations (FY2019 – FY2025 and Q1 2026)
FCF is a non-GAAP measure, and therefore, the calculation of this metric is inconsistent. Many investors deduct CAPEX from OCF to arrive at FCF. In my How Stock Based Compensation Distorts Free Cash Flow post, I explain why I now also deduct stock based compensation (SBC) that is found in the Consolidated Statements of Cash Flows to determine FCF.
The following table reflects WST’s FCF without/with the deduction of SBC.
NOTE: The 2026 data reflected below is solely for the first 3 months of the current fiscal year. Caution is to be exercised when comparing results with prior fiscal year results.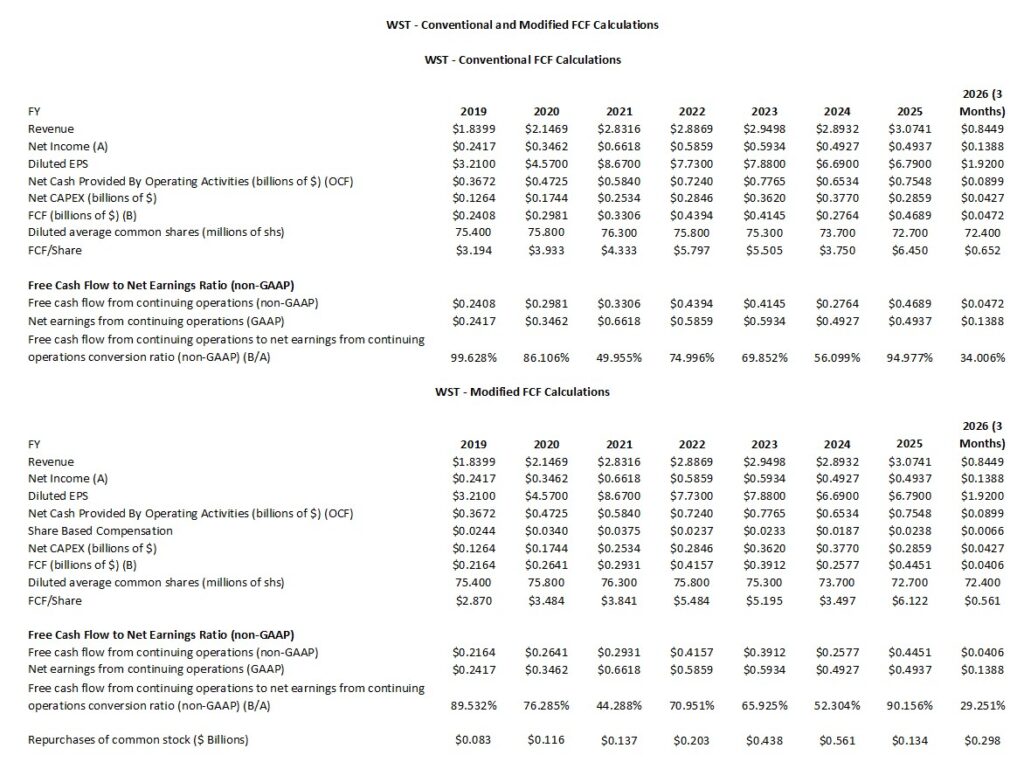
WST’s CAPEX/Sales ratio was ~7%, ~8%, ~9%, ~10%, ~12.3%, ~13%, and ~9.3% of annual revenue in FY2019 – FY2025. WST has been investing heavily in recent years to expand its manufacturing facilities and upgrade equipment to meet rising global demand for proprietary, high-margin drug containment and delivery components. The expansion particularly supports the fast-growing biologics and GLP-1 (glucagon-like peptide-1) markets, which require advanced, high-quality packaging solutions. Examples of these expansion initiatives include the build out of new manufacturing plants and the addition of state-of-the-art production lines in the U.S. and Europe.
WST reported a CAPEX/Sales ratio of ~5.05% in Q1 2026 ($42.6 million/$844.9 million). The first quarter was a relatively lean quarter compared to FY2026 CAPEX guidance of $0.25B – $0.275B. We should, therefore, expect CAPEX to increase significantly in the remaining three quarters (averaging ~$70 million – $75 million per quarter) to hit the guided range. Much of this spending is likely to be directed toward ramping up production capacity in Europe to meet the surging demand for GLP-1 (obesity/diabetes) and non-GLP-1 high-value components.
Q2 and FY2026 Guidance
On the Q1 earnings call, management states:
The macro environment continues to be dynamic, and so we will remain prudent with our forecasting given we have three quarters to go in the year. Most importantly, we’ve increased our growth expectations for the injectable market. HVP components, both GLP-1 and non-GLP-1s, are the primary driver for our increased outlook. Our assumptions around the GLP-1 market continue to hold, and the non-GLP-1 market continues to improve.
We’ve also incorporated rising oil and commodity prices into our updated thinking and are working to offset these costs through various means as we have with tariffs and other inflationary costs. We expect to have a net impact of single-digit millions after the mitigation efforts. Importantly, our operations and supply chain have not been affected.
The following reflects WST’s current guidance.
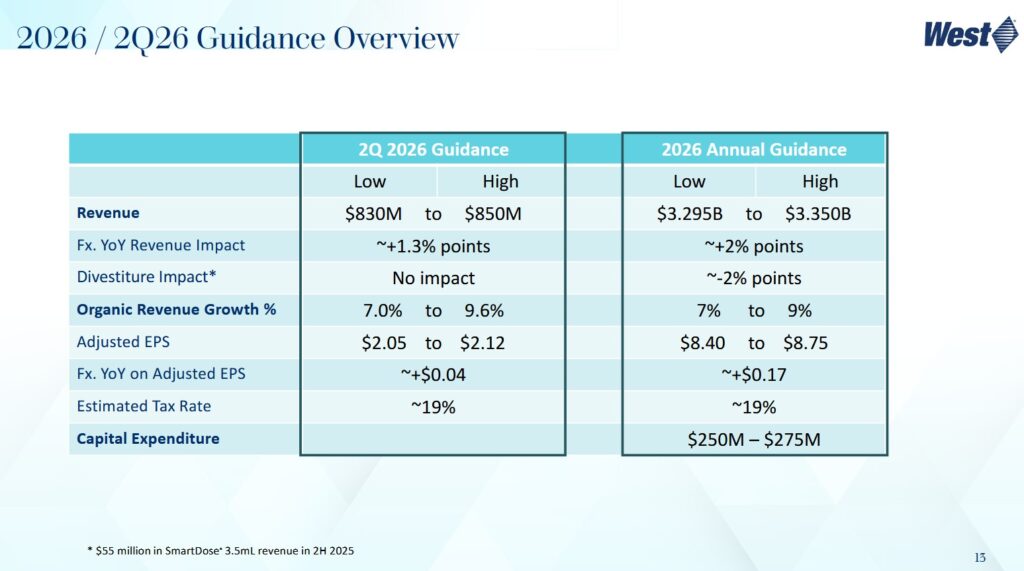
WST generated $55 million in SmartDose® sales in the second half of 2025 and the FY2026 expected organic growth rate has been adjusted to exclude these revenues. Management now anticipates revenue to be $3.295B – $3.35B, up $78 million at the midpoint.
In addition to the above, WST is projecting $7 million (previously $10 million) in net interest income, a 19% tax rate (previously 20.25%) for the full year, and ~71.5 million diluted shares outstanding for the full year (previously 72.7 million).
Previous guidance was:
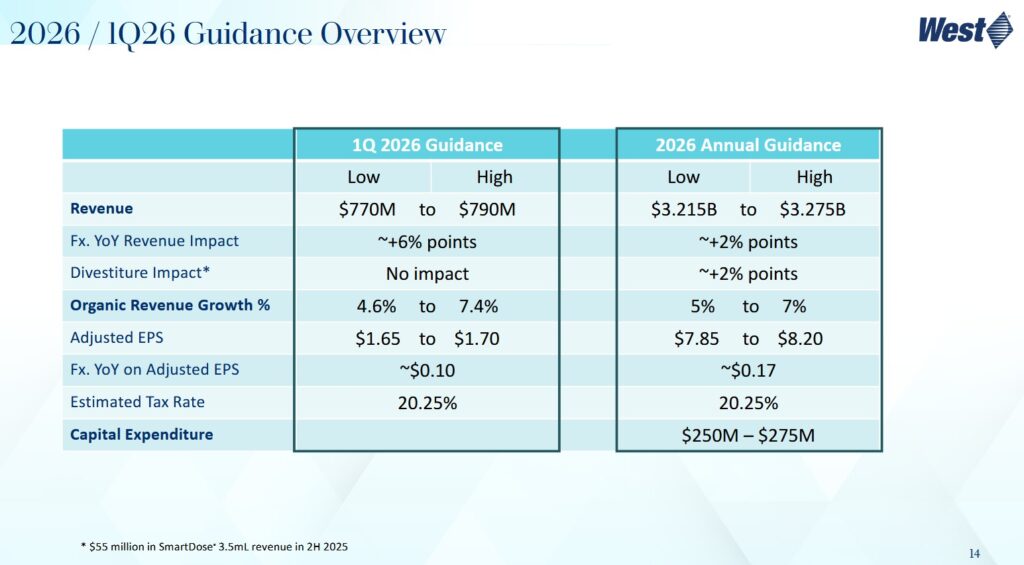
Due to a strong Q1 performance and the expected ongoing business momentum, WST is increasing its FY2026 organic revenue growth back to its long-term construct of 7% – 9% (an increase from previous guidance of 5%-7%) and adjusted EPS to $8.40-$8.75 from $7.85 – $8.20.
Capital expenditures in Q1 2026 were $43 million versus $71 million in Q1 2025, as WST continues to focus on increased capital spending efficiency. Despite an increase in revenue guidance, there is no change to FY2026 CAPEX expectations of $0.25B – $0.275B.
ROIC and WACC
Return on Invested Capital (ROIC) provides an indication of a company’s efficiency. In essence, is a company actually creating value or ‘burning’ cash for the sake of growth?
A company with a higher ROIC is mathematically worth more because it requires less reinvestment to achieve that growth.
A good indication of how well a company is performing is to compare ROIC to the Weighted Average Cost of Capital (WACC). WACC, however, is not a metric officially reported by WST. It can, however, be roughly estimated based on the company’s credit profile and market conditions.
The generally accepted high-level formula used by Wall Street is:
ROIC = NOPAT/Average Invested Capital
with the Net Operating Profit After Tax (NOPAT) formula being Operating Income (EBIT) x (1-tax rate)
This shows how much profit the core business makes while ignoring how much debt the company has.
The Average Invested Capital is the total money tied up in the business.
- The Operating Approach formula is
- The Financing Approach is
One shortcoming with ROIC is that it is a non-GAAP metric meaning the input data plugged into the ROIC formula is inconsistent.
During the FY2019 – FY2025 period, WST has demonstrated exceptional capital efficiency by consistently maintaining a significant ‘spread’ between its ROIC and WACC. The data reveals a company that transitioned from a steady grower to a high-performance ‘pandemic winner’ followed by a stabilization phase as it pivoted toward the booming GLP-1 (obesity/diabetes) market.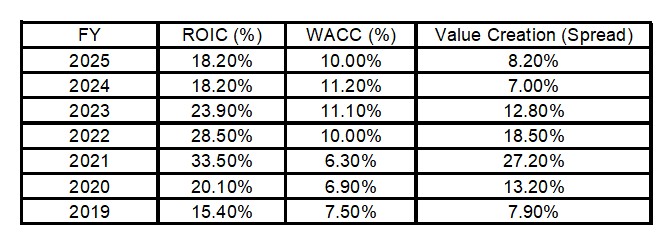 During the COVID pandemic (2020 – 2021), WST’s ROIC surged because of extraordinary demand for vaccine components. During this time, WST benefited from high ‘asset turnover’ and massive operating leverage. Meanwhile, WACC was at historical lows due to the low-interest-rate environment and a soaring stock price that lowered the cost of equity.
In 2022 – 2024, the world moved past the pandemic and WST faced a period in which its customers were inventory destocking. This pressured ROIC at the same time as the US Federal Reserve’s rate hikes pushed WACC from ~6% to ~11%.
Its ROIC hit a multi-year low of ~18.2% as sales of COVID-related products vanished. Even at this low point, WST was still creating substantial value, with an ROIC well above its cost of capital.
In 2025, ROIC stabilized as the company successfully pivoted to High-Value Products (HVP) for GLP-1 drugs. The shift to HVP, which carries higher margins than standard components, has helped protect ROIC even as the company invests heavily in new capacity.
As interest rates began to plateau and the stock price recovered, WACC trended slightly lower to ~10%.
Risk Assessment
No rating agency rates WST’s debt. The cash flow and balance sheet metrics, however, reflect a prudent use of debt.
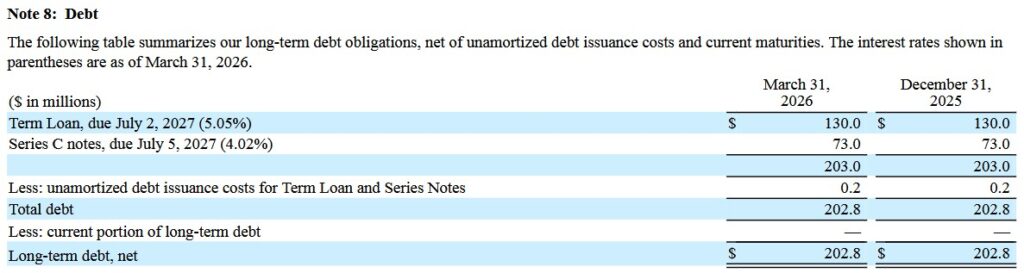
At the end of Q1 2026, the borrowing capacity available under WST’s $0.5B multi-currency revolving credit facility, including outstanding letters of credit of $2.3 million, was $497.7 million.
The debt agreements contain customary covenants, none of which management considers restrictive to business operations. WST was in compliance with all debt covenants at the end of Q1 2026.
Dividends, Share Repurchases, and Stock Splits
Dividend and Dividend Yield
In Q1, WST distributed ~$16 million in dividends.
Distribution of the next $0.22/share quarterly dividend (the 3rd at this level) will be on May 6, 2026.
Looking at WST’s dividend history, we see that a WST investment is typically not made for dividend income. The majority of any potential total long-term investment return is likely to be in the form of capital appreciation.
Share Repurchases
WST’s weighted average shares outstanding in FY2013, FY2025, and Q1 2026 was (in millions of shares) 71.4, 72.6, and 72.4.
In FY2022 – FY2025, WST repurchased $202.8, $438.3, $560.9, and $134.0 million of its outstanding shares.
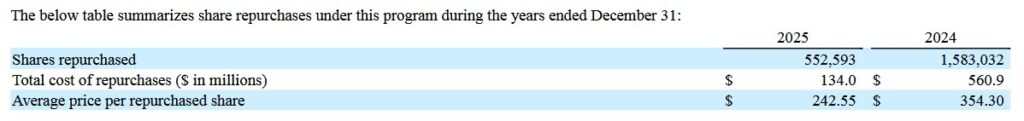
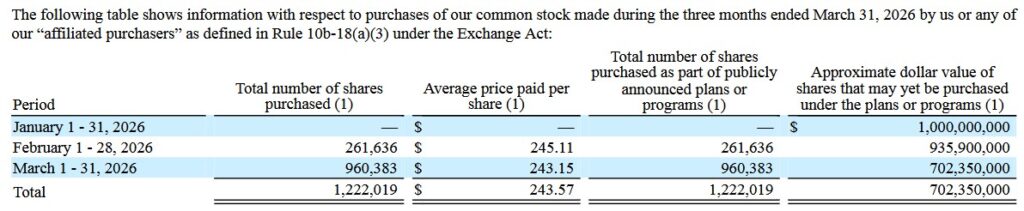
In February 2026, WST’s Board authorized a new $1B share repurchase program and during Q1 2026, WST repurchased ~1.222 million shares for ~$0.298B.
WST’s FY2026 guidance now includes ~71.5 million diluted shares outstanding for the full year.
On the Q1 2026 earnings call, management states that ‘Our cash flow and strong balance sheet position us well as we look to deploy capital for growth and deliver value to shareholders.’ This capital allocation includes continued share repurchases.
Stock Splits
WST initiated a 2-for-1 stock split in September 2013.
Valuation
Following the release of Q1 2026 results and revised guidance, WST’s share price surged to $309.60 from the prior day’s $274.41 close. Based on management’s $8.40 – $8.75 FY2026 adjusted diluted EPS guidance, the forward adjusted diluted PE range is ~35.4 – ~36.9.
Using the currently available broker estimates, WST’s forward-adjusted diluted PE levels are:
- FY2026 – 16 brokers – a forward-adjusted diluted PE of ~37.4 using a mean of $8.27 and low/high of $7.91 – $8.71.
- FY2027 – 16 brokers – a forward-adjusted diluted PE of ~33.5 using a mean of $9.23 and low/high of $8.71 – $9.87.
- FY2028 – 10 brokers – a forward-adjusted diluted PE of ~30.7 using a mean of $10.10 and low/high of $9.47 – $11.31.
NOTE: Revisions to these estimates are likely over the coming days.
When I wrote my February 13, 2026 post, WST’s share price had just closed at $243.61 on February 12, 2026. I wrote:
Management’s FY2026 adjusted diluted EPS guidance is $7.85 – $8.20 thus giving us a forward adjusted diluted PE range of ~29.7 – ~31.
Using the currently available broker estimates, WST’s forward-adjusted diluted PE levels were:
- FY2026 – 17 brokers – a forward-adjusted diluted PE of ~31 using a mean of $7.88 and low/high of $7.39 – $8.38.
- FY2027 – 16 brokers – a forward-adjusted diluted PE of ~27.7 using a mean of $8.81 and low/high of $8.42 – $9.42.
- FY2028 – 10 brokers – a forward-adjusted diluted PE of ~24.3 using a mean of $10.03 and low/high of $9.25 – $10.72.
I noted that revisions to these estimates were likely over the coming days given the recent earnings release.
The annual FCF conversion ratio is typically below 100% (see table in the Conventional And Modified Free Cash Flow (FCF) Calculations (FY2019 – FY2025)) section of this post. In addition, diluted EPS is generally lower than adjusted diluted EPS. If we try to gauge WST’s valuation on a FCF/diluted EPS basis, the P/FCF level will be well above the forward-adjusted diluted PE levels reflected above.
Final Thoughts
When I completed my 2025 Year-End Investment Holdings Review, shares were trading at ~$275 and WST was my 26th largest holding. On January 22, 2026, however, I acquired an additional 100 shares @ $248.6401 in a ‘Core’ account in the FFJ Portfolio bringing my exposure to 600 shares.
At the time of my prior post, WST had fallen out of favor with investors. Following the release of Q1 2026 results and revised FY2026 guidance, the company appears to have regained investor confidence. The share price surge has now led to a less favorable valuation from a couple of months ago.
In my prior post I deemed ~$260 to be a ‘fair value’. With the sharp increase in FY2026 guidance, ~$295 – ~$305 appears to be a fair value. Given the current ~$309.60 share price as I finalize this post, WST is no longer a bargain.
I have no immediate plans to increase my exposure.
I wish you much success on your journey to financial freedom!
Note: Please send any feedback, corrections, or questions to finfreejourney@gmail.com.
Disclosure: I am long WST.
Disclaimer: I do not know your circumstances and do not provide individualized advice or recommendations. I encourage you to make investment decisions by conducting your research and due diligence. Consult your financial advisor about your specific situation.
I wrote this article myself and it expresses my own opinions. I do not receive compensation for it and have no business relationship with any company mentioned in this article.