
Wealth creation through Danaher (DHR) share ownership is possible. Share price weakness despite strong results and a somewhat more favourable valuation relative to the last several months of 2021, provides investors with a window of opportunity.
I last wrote about Danaher (DHR) in my April 21, 2022 post following the release of Q1 2022 results. On April 22, 2022, I provided a brief update to disclose the purchase of additional shares at $266.84 which increased my exposure to 235 shares. I subsequently acquired an additional 50 shares on June 1 at $259.18/share and disclosed this purchase in my FFJ Portfolio – June 2022 Report.
On July 21, 2022, DHR released Q2 and YTD2022 results. As I compose this post, DHR’s share price has (unfortunately) risen significantly. This serves as an example of why trying to time purchases is fraught with risk. Investors would be wise to just invest in great companies for the long term.
Investing in great companies at reasonable valuations, however, is challenging. Those which grow quickly are likely to be richly valued most of the time. This means we sometimes have to pay up for quality.
Let’s have a look at whether DHR’s current valuation justifies the purchase of shares despite the recent runup.
Overview
I am dispensing with an overview of DHR. I have addressed this in previous posts that are accessible through the FFJ Archives.
Investors unfamiliar with DHR may want to familiarize themselves with the company by reading Part 1 of DHR’s FY2021 Annual Report and Form 10-K.
In a nutshell, the following shows DHR’s FY2021 segment revenue.

Source: DHR – FY2021 Annual Report and Form 10-K
Financials
Q2 and YTD2022 Results
I encourage you to read DHR’s Q2 2022 Form 10-Q, Earnings Release, and Earnings Presentation which are accessible here.
Broad-based strength across the portfolio drove better than expected revenue, earnings and cash flow. Nearly 75% of DHR’s revenues are recurring with the majority being consumables that are specified into highly regulated manufacturing processes or specific to the equipment DHR supplies.
DHR, like so many other companies, has experienced supply chain constraints and inflationary pressures. Disciplined cost management and proactive measures taken to address these challenges have led to strong margin performance. DHR is also using its Danaher Business System (DBS) to execute price actions. In Q2, DHR achieved ~400 bps of price increases.
The following provides a glimpse of DHR’s Q2 results.

This is DHR’s Q2 and YTD2022 segment information:

Source: DHR – Q2 2022 Form 10-Q
The Q1 2022 segment information is provided for comparison.

Source: DHR – Q1 2022 Form 10-Q
The Q4 2020, Q4 2021, FY2020, and FY2021 segment information is provided for comparison.

Source: DHR – Form 8-K January 27, 2022
Operating Cash Flow (OCF) and Free Cash Flow (FCF)
Since DHR actively acquires and divests assets, its diluted EPS is deceiving. ‘Amortization of intangible assets’ and ‘amortization of acquisition-related inventory fair value step-up’ are line items that consistently appear in the Consolidated Condensed Statements of Cash Flows. Investors should, therefore, pay particularly close attention to DHR’s OCF and FCF.

Source: Reconciliation of GAAP and non-GAAP Financial Measures for Q2 and YTD 2021 and 2022 – July 21, 2022
The following table reflects the conversion rate for Q1 2021 and Q1 2022 and is provided for comparison.

Source: Reconciliation of GAAP and non-GAAP Financial Measures for Q1 2021 and 2022 – April 21, 2022
The following table reflects the conversion rate for Q4 and FY2020 and Q4 and FY2021 and is provided for comparison. DHR’s FY2021 FCF to net income conversion was 112% making it the 30th consecutive year this figure exceeds 100%.

FY2022 Outlook
DHR’s backlog and order levels remain healthy. Its customers continue to transition away from COVID-19 vaccines and therapies and into previously paused and new programs for other modalities. As a result, expectations are for COVID-19 vaccine and therapeutic revenue of ~$1B in 2022 versus ~$2B in 2021.
There is, however, no change to the high-single to low-double digit core revenue growth outlook in the bioprocessing business for FY2022 as customers are accelerating their investments across all other major therapeutic modalities. This acceleration, paired with improving price realization, is driving more than 20% core growth in DHR’s non-COVID business, which is up from the historical low-double-digit growth.
The biologics market remains very healthy as evidenced by the increasing number of treatments and development and production. There are currently more than 1,500 monoclonal antibody based-therapies in development globally; this is up more than 50% from just 5 years ago. This is being driven by both novel molecules and development and the proliferation of biosimilars, which are helping to accelerate adoption and underserved markets as patents on higher volume therapies expire. There are also over 2,000 cell and gene therapy candidates in development which is more than a tenfold increase over the last several years.
There is no change to DHR’s FY2022 previous guidance of high-single-digit core revenue growth in its base business and mid-single-digit core revenue growth overall.

DHR is currently seeing more normalized business operations in China and expectations are for this positive trend to continue for the balance of the year.
Credit Ratings
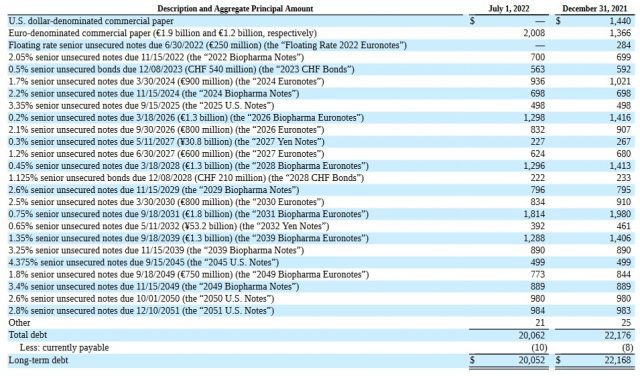
We see from DHR’s debt schedule as of the end of Q2 2022 that debt has been raised at very attractive rates. Furthermore, maturity dates are well balanced and go far out on the calendar.
DHR’s credit ratings remain unchanged from those reflected in my previous posts. The ratings and outlook are:
- Moody’s: Baa1 with a stable outlook;
- S&P Global: Upgraded to A- from BBB+ on June 14, 2022.
The rating assigned by Moody’s is the top tier of the lower-medium-grade investment-grade tier. This rating defines DHR as having the ADEQUATE capacity to meet its financial commitments. However, adverse economic conditions or changing circumstances are more likely to lead to a weakened capacity to meet its financial commitments.
The rating assigned by S&P Global is the bottom tier of the upper-medium-grade investment-grade tier. This rating defines DHR as having a STRONG capacity to meet its financial commitments. However, DHR is somewhat more susceptible to the adverse effects of changes in circumstances and economic conditions than obligors in higher-rated categories.
These ratings satisfy my conservative investment profile.
Dividend and Dividend Yield
DHR distributes a quarterly dividend. On May 10, 2022, DHR announced that its Board approved a regular quarterly cash dividend of $0.25/share, payable on July 29, 2022 to holders of record on June 24, 2022.
At the time of my January 28 post, the dividend yield was ~0.3% ($0.21/share quarter and a ~$270 share price). When I wrote my April 21, 2022 post, shares were trading at $278.55 and the dividend yield was ~0.36%.
Shares are now trading at ~$278 and the current dividend yield is ~0.36%.
Investors who rely on dividend income might immediately pass on DHR because of this low dividend yield. However, I have mentioned in several previous posts that:
Investors should not fixate on dividend metrics. The focus should be on total potential long-term investment returns.
DHR is hyper-focused on capital allocation. The reason for the low dividend yield is that the Board feels superior long-term investor returns can be generated by retaining funds in the company.
On July 16, 2013, DHR’s Board approved a repurchase program authorizing the repurchase of up to 20 million shares from time to time on the open market or in privately negotiated transactions. DHR has not repurchased any shares YTD. As of July 1, 2022, 20 million shares remained available for repurchase.
At the end of Q1 2022, DHR had Series A and B Mandatory Conversion Preferred Shares (MCPS). On April 15, 2022, all outstanding shares of the 4.75% MCPS Series A converted at a rate of 6.6632 common shares per share of preferred stock into an aggregate of 11.0 million shares of the Company’s common stock; DHR issued cash instead of fractional shares of common stock in the conversion. The final $11.875/share quarterly cash dividend was paid on April 15, 2022.
The remaining 5% MCPS Series B carries an April 15, 2023 mandatory conversion date.
Series A and B of these MCPS were issued to help finance the 2020 acquisition of the Biopharma business of the General Electric Company’s Life Sciences division (now named Cytiva) for a cash purchase price of ~$20.7B.
Although DHR periodically repurchases shares, the diluted average common stock and common equivalent shares outstanding (in millions) in FY2012 – FY2021 are 713, 711, 716, 709, 700, 706, 710, 726, 719 and 737. The average common stock and common equivalent shares outstanding for the 6 months ending July 1, 2022 is ~737.
As noted earlier, DHR actively acquires and divests entities. The fluctuation in the outstanding number of shares is dependent to an extent on its acquisitions and divestitures.
Valuation
DHR’s FY2012 – FY2021 diluted PE levels are 17.31, 21.56, 22.44, 25.80, 19.66, 27.63, 26.51, 45.41, 51.90, and 42.34. DHR, however, has undergone a radical transformation over the last few years after having divested slower-growing businesses and acquiring several faster-growing businesses. We can not, therefore, merely compare YoY PE levels.
When I initiated my DHR position in early January 2022, shares were trading at ~$307. The forward adjusted diluted PE levels based on EPS estimates from the 2 online brokerage platforms I use were:
- FY2021 – 20 brokers – mean of $9.83 and low/high of $9.40 – $10.01. Using the mean estimate, the forward adjusted diluted PE was ~31.
- FY2022 – 21 brokers – mean of $10.19 and low/high of $9.58 – $10.90. Using the mean estimate, the forward adjusted diluted PE was ~30.
- FY2023 – 15 brokers – mean of $10.65 and low/high of $9.45 – $11.31. Using the mean estimate, the forward adjusted diluted PE was ~29.
When shares closed at ~$270 on January 27, DHR had reported FY2021 diluted EPS of $8.50 giving us a diluted PE of ~31.8.
FCF to net income conversion was 112% and this was the 30th consecutive year in which this ratio exceeded 100% ($8.50 * 1.12 = ~$9.50 FCF/share).
Using this ~$270 share price and $9.50 FCF/share, the P/FCF was ~28.4.
Based on DHR’s ~$270 share price and the following forward adjusted diluted EPS estimates, DHR’s valuation was:
- FY2022 – 23 brokers – mean of $10.43 and low/high of $9.89 – $11.01. Using the mean estimate, the forward adjusted diluted PE was ~26.
- FY2023 – 19 brokers – mean of $10.99 and low/high of $10.25 – $12. Using the mean estimate, the forward adjusted diluted PE was ~24.6.
- FY2024 – 11 brokers – mean of $12.18 and low/high of $11.15 – $13.5. Using the mean estimate, the forward adjusted diluted PE was ~22.
At the time of my April post, DHR was trading at $278.55. Using the current forward adjusted diluted EPS estimates, DHR’s forward adjusted diluted PE levels were:
- FY2022 – 23 brokers – mean of $10.45 and low/high of $9.99 – $10.61. Using the mean estimate, the forward adjusted diluted PE is ~26.7.
- FY2023 – 22 brokers – mean of $10.98 and low/high of $10.20 – $11.60. Using the mean estimate, the forward adjusted diluted PE is ~25.4.
- FY2024 – 10 brokers – mean of $12.24 and low/high of $11.71 – $13.4. Using the mean estimate, the forward adjusted diluted PE is ~22.8.
DHR shares currently trade at ~$278. Using this share price and the current forward adjusted diluted EPS estimates, DHR’s forward adjusted diluted PE levels are:
- FY2022 – 22 brokers – mean of $10.33 and low/high of $10.00 – $10.88. Using the mean estimate, the forward adjusted diluted PE is ~27.
- FY2023 – 21 brokers – mean of $10.87 and low/high of $10.15 – $11.50. Using the mean estimate, the forward adjusted diluted PE is ~25.7.
- FY2024 – 13 brokers – mean of $12.05 and low/high of $11.61 – $12.95. Using the mean estimate, the forward adjusted diluted PE is ~23.2.
Historically, DHR’s full-year FCF/share has exceeded EPS. The FCF from continuing operations to net earnings from continuing operations conversion ratio was 1.49 and 1.12 in FY2020 and FY2021. Every quarter, however, the FCF to net earnings conversion ratio might not exceed 1. In Q1 2021, for example, the conversion ratio was 0.96 and in Q1 and Q2 2022 it was 1 and 1.02, respectively.
I envision DHR’s full-year FCF to net earnings conversion ratio will continue to exceed 1, and therefore, expect the forward valuation based on FCF to be superior to that based on EPS.
Final Thoughts
The Final Thoughts in my April 21, 2022 post touch upon how Steven and Mitchell Rales founded DHR. On the Forbes 2022 World’s Billionaires List, Steven is ranked #225 (previously #252) with a Net Worth of ~$8.6B (previously ~$8.7B) and Mitchell is ranked #420 (previously #441) with a Net Worth of ~$5.9B (previously ~$5.9B); this list is updated in real-time. The Rales brothers have demonstrated they know how to create wealth and I suggest investors may want to ‘follow the money’.
DHR was not a Top 30 holding when I completed my Mid 2022 Investment Holdings Review. Nevertheless, I intend to periodically increase my exposure subject to funds availability, DHR’s valuation, and other investment opportunities.
I wish you much success on your journey to financial freedom!
Note: Please send any feedback, corrections, or questions to finfreejourney@gmail.com.
Disclosure: I am long DHR.
Disclaimer: I do not know your circumstances and do not provide individualized advice or recommendations. I encourage you to make investment decisions by conducting your research and due diligence. Consult your financial advisor about your specific situation.
I wrote this article myself and it expresses my own opinions. I do not receive compensation for it and have no business relationship with any company mentioned in this article.