Contents

Raytheon Technologies (RTX), a defense and commercial aerospace powerhouse, is benefitting from an increasingly hostile global political climate.
I last reviewed RTX in my January 26, 2022 post at which time it had just released its Q4 and FY2021 results and FY2022 outlook. RTX has now released Q2 and YTD2022 results and its FY2022 outlook thus presenting me with the opportunity to revisit RTX.
Business Overview
Since I have covered RTX in previous posts, I dispense with a brief Business Overview. However, I encourage investors unfamiliar with RTX to review the company's website and to read Part 1 Item 1 within the 2021 Annual Report and Form 10-K.
The Risk Factors section within the Form 10-K provides a good overview of various risks that could impact RTX's business, financial condition, operating results and cash flows.
FY2022 Priorities
I included RTX's 2022 priorities and 2025 goals in my previous post but include them again for ease of reference.
RTX has repeatedly indicated dividend increases and share repurchases are two means by which it intends to increase shareholder returns. It is committed to returning at least $18B - $20B to shareholders in the first 4 years following the United Technologies/Raytheon merger that was completed in April 2020. However, RTX's CFO stated at the May 18, 2021 Investor Day that the plan is to return more than $20B to shareowners in the 4 years post-merger.
At the end of Q2 2022, RTX has already returned ~$11B of capital to shareowners post merger.

Financials
Q2 and YTD2022 Results
RTX's Q2 and YTD2022 results and FY2022 outlook are accessible in the July 26, 2022 earnings release, presentation, and Form 10-Q.

In Q2, RTX's continued to experience strong demand for its missiles and defense products and services. While its book-to-bill ratio in Q2 was 1.35, management expects this ratio to retrace closer to 1.2 for the full year.
NOTE: A book-to-bill ratio measures supply and demand and represents the ratio of orders received to units shipped and billed for a specified period. When this performance and outlook ratio exceeds one, the implication is that more orders were received than filled (strong demand). Where the ratio is below one, the implication is that there is weaker demand.
RTX is benefitting from global defense budgets increases. Most NATO allies have reaffirmed their commitment to spend at least 2% of GDP on national defense. Many countries have been announcing even higher spending targets over the last several months. Poland, for example, has requested accelerated delivery of Patriot missile systems batteries, and both Germany and Finland have selected the F-35. Furthermore, the US Department of Defense released its FY2023 budget request earlier in 2022 with modernization spending growing by over 4%. On the modernization front, expectations are for research, development, test, and evaluation (RDT&E) to grow by nearly 10%.
The House Armed Services Committee in the US has also proposed a $37B increase to the administration's request; this is a 9% increase over FY2022.
If you think this proposed increase is significant, the Senate Armed Services Committee is proposing a $45B increase resulting in a Department of Defense budget increase of 10% over FY2022. This is a far different scenario from what RTX expected 2 years ago.
RTX is also encouraged by the support of its programs with the authorizing committees recommending significant increases in spending over the President's budget request. These significant increases in spending include increases for Stingers, Javelins Next Generation Jammers, and Tomahawk cruise missiles.
RTX's key programs in technologies and space, cyber, missiles, missile defense and non-kinetic effects are also well aligned with the US and and allies' defense priorities.
At the end of Q2, RTX had a defense backlog of $65B. This is a ~$2B increase since the beginning of the year and expectations are for this backlog to grow the remainder of the year.
During Q2, RTX also saw a number of significant awards. These awards include $4B to deliver F135 engines which will power all variants of LMT's F-35 fighter. The total contract value opportunity is ~$8B for F135 engines across lots 15 through 17. In addition, RTX received a $0.408B contract for the sustainment of the F135 fleet.
The F135 engine continues to be the most advanced and the safest fighter engine ever produced and it possesses unrivaled operational capability and mission effectiveness. As the global threats evolve, the F135 engine could be upgraded to increase its thrust, range and power thermal management to support the needs of the fighter well into the next decade.
In addition, RTX received a $0.648B award to deliver SM-3 missiles to the Missile Defense Agency, a $0.662B research and development award to replenish 1,300 Stinger missiles, as well as awards to replenish Javelin missiles.
Raytheon Intelligence and Space (RIS) also had $1.2B of bookings of highly classified programs.
On the commercial air traffic front, demand continues to gain momentum with a strong start to the summer travel season. On a global basis, Q2 revenue passenger miles reached nearly 70% of the pre-pandemic levels. In the US, travellers through TSA checkpoints were up 30% YoY in Q2 or ~90% of 2019 levels. As travel restrictions ease, RTX expects growing demand for international travel in the second half of 2022 with international revenue passenger miles growing from over 60% of 2019 levels at the end of Q2 to ~75% - ~80% of 2019 levels by the end of 2022.
Despite all these recent successes, RTX continues to face headwinds. In my recent Lockheed Martin – Wait For A Better Valuation post, I mention that LMT is experiencing headwinds. RTX is no exception. Inflation, supply chain and labor availability continue to be near-term constraints.
RTX is aggressively managing these issues. Microelectronics, rocket motors, and structural castings, all continue to dictate the pace of manufacturing lines. RTX team members are embedded in ~330 suppliers to help improve performance and RTX is also qualifying second and third sources for critical parts.
Inflation is also a headwind but on the commercial side of RTX's business, it has long-term agreements in place that cover ~80% of spend and cover multiple years. This provides an inflation buffer at least in the near term.
On the defense side, RTX can price inflation into annual production contracts. RTX is also driving further automation, standardization and process improvement projects to mitigate inflation headwinds.
RTX is also experiencing the availability of skilled labour challenges. This is evident internally and at RTX's suppliers. Hiring/training new employees is extremely challenging, especially in certain areas where much of the work is highly classified.
FY2022 Outlook
The following reflects RTX's most current outlook and segment outlook.

Source: RTX - Q2 and YTD2022 Earnings Presentation - July 26, 2022
When RTX presented Q1 2022 results, it also presented a revised outlook calling for lower sales and organic sales growth. The outlook presented with the release of Q2 and YTD2022 results is unchanged from that presented in April.

Source: RTX - Q1 2022 Earnings Presentation - April 26, 2022

RTX's FY2022 Free Cash Flow (FCF) outlook remains unchanged at $6B. This outlook continues to assume the legislation requiring R&D capitalization for tax purposes is deferred beyond 2022; the FCF impact of this legislation is ~$2B for the year. If the legislation is not deferred by September 15, RTX will have to make an incremental cash tax payment of ~$1.5B in Q3. However, this payment is a timing issue only as RTX will receive a refund in FY2023 for the overpayment if the legislation is ultimately deferred.
Adjusted EPS Outlook
When Q4 and FY2021 results were presented on January 25, 2022, projections were for an 8% - 12% increase in adjusted EPS from FY2021. There is no change to this projection.
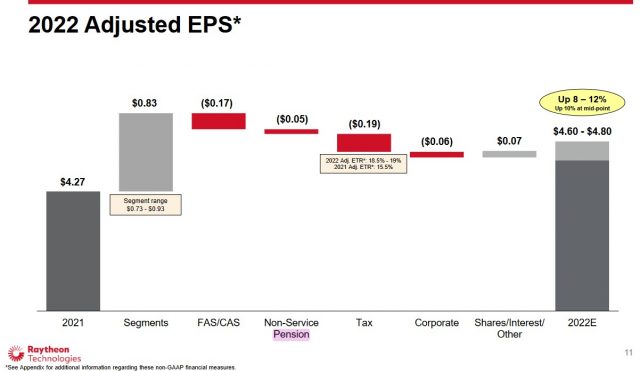
Source: RTX - Q4 and FY2021 Earnings Presentation - January 25, 2022
Credit Ratings
A schedule of RTX's long-term debt as of June 30, 2022 is found on pages 13 and 14 of 59 in the Q2 Form 10-Q.
Moody's currently assigns a Baa1 rating to RTX's senior unsecured domestic currency debt. This is the top tier of the lower medium grade category.
This rating defines RTX as having an ADEQUATE capacity to meet its financial commitments. However, adverse economic conditions or changing circumstances are more likely to lead to a weakened capacity to meet its financial commitments.
S&P Global last reviewed RTX on June 7, 2022 and continues to assign an A- with a negative outlook. This rating is one notch higher than that assigned by Moody's and is the lowest tier of the upper-medium grade category.
S&P's rating defines RTX as having a STRONG capacity to meet its financial commitments. However, it is somewhat more susceptible to the adverse effects of changes in circumstances and economic conditions than obligors in higher-rated categories.
Both ratings are investment grade and are acceptable for my purposes.
Dividend and Dividend Yield
We see from RTX's dividend history that September 8, 2022 is the scheduled distribution date for the 2nd $0.55/share quarterly dividend.
Shares were trading at ~$90 when I last reviewed RTX. The quarterly dividend at the time, however, was $0.51. This resulted in a ~2.27% dividend yield.
RTX increased its quarterly dividend to $0.55 effective with the June 16, 2022 distribution. With shares still trading at ~$90, the dividend yield is ~2.44%.
RTX distributed $2.732B and $2.957B of dividends in FY2020 and FY2021. In the first half of FY2022, RTX has distributed $1.543B in dividends.
RTX's weighted average number of issued and outstanding shares in FY2011 - FY2021 (in millions rounded) is 907, 915, 912, 883, 826, 799, 810, 864, 1,358, and 1,509. The significant increase in RTX's share count is primarily due to the merger of United Technologies and Raytheon on April 3, 2020. This merger distorts the weighted average number of diluted outstanding shares. We, therefore, can not merely compare the FY2020 and FY2021 share count.
In Q2 2022, RTX repurchased just over $1B of its shares. In the first half of FY2022, RTX repurchased 18,697 million shares for $1.779B. This puts it on track to repurchase at least $2.5B of shares included in its FY2022 outlook.
On June 30, 2022, management had the remaining authority to repurchase ~$4.1B of common stock under the December 7, 2021 share repurchase program.
Valuation
In my October 1st, 2020 post, I indicated that using Earnings per Share (EPS), which takes into account the significant non-cash related goodwill impairment charges incurred in Q2 2020, would render us unable to calculate RTX’s P/E since there were no earnings.
Using forward-adjusted diluted EPS estimates reflected on the two discount brokerage platforms I use and the current $57.45 share price, I arrived at the following valuations:
- FY2020: 18 brokers, mean estimate $2.87, low/high range $2.12 - $3.62. The valuation using the mean estimate is ~20 and ~16 using the upper end of the range.
- FY2021: 17 brokers, mean estimate $3.85, low/high range $3.34 - $4.85. The valuation using the mean estimate is ~15 and ~12 using the upper end of the range.
When I reviewed RTX in my May 18, 2021 post, management's FY2021 forward-adjusted diluted EPS guidance was $3.50 - $3.70 and the current share price was ~$85.40. On this basis, the forward adjusted diluted PE range was ~23.1 - ~24.4.
In my July 30, 2021 Guest Post at Dividend Power, RTX was trading at ~$88 and management’s FY2021 forward-adjusted diluted EPS guidance had been revised upwards to $3.85 – $4 giving us a forward-adjusted diluted PE range of ~22 – ~23.
I expected broker estimates to be adjusted over the coming days following the July 27 Q2 earnings release. Using the guidance currently available from the 2 trading platforms I use, I arrived at the following forward-adjusted diluted PE valuations.
- FY2021: 23 brokers, mean estimate $3.98, low/high range $3.68 – $4.35. The valuation using the mean estimate is ~22 and ~20 using the upper end of the range.
- FY2022: 23 brokers, mean estimate $4.99, low/high range $4.30 – $5.70. The valuation using the mean estimate is ~17.6 and ~15.43 using the upper end of the range.
- FY2023: 17 brokers, mean estimate $6.09, low/high range $5.44 – $6.89. The valuation using the mean estimate is ~14.4 and ~12.78 using the upper end of the range.
Following the release of Q4 and FY2021 results, management's FY2022 adjusted EPS outlook was $4.60 - $4.80 and shares were trading at ~$90. On this basis, the forward adjusted diluted PE range was ~19 - ~20.
When I wrote my January 26, 2022 post I envisioned lower broker adjustments over the coming days; estimates had been declining over the prior 3 months. However, using the current broker guidance available from the 2 trading platforms I use, the following were the forward-adjusted diluted PE valuations.
- FY2022: 19 brokers, mean estimate $4.87, low/high range $4.68 – $5.33. The valuation using the mean estimate is ~18.5 and ~17 using the upper end of the range.
- FY2023: 17 brokers, mean estimate $5.86, low/high range $5.31 – $6.60. The valuation using the mean estimate is ~15.4 and ~13.6 using the upper end of the range.
- FY2024: 11 brokers, mean estimate $6.75, low/high range $6.10 – $7.46. The valuation using the mean estimate is ~13 and ~12 using the upper end of the range.
Shares are currently trading at ~$90 and management's FY2022 adjusted EPS outlook is still $4.60 - $4.80. On this basis, the forward adjusted diluted PE range is ~19 - ~20.
The current forward-adjusted diluted PE valuations based on broker guidance available from the 2 trading platforms I use are:
- FY2022: 17 brokers, mean estimate $4.71, low/high range $4.55 – $4.80. The valuation using the mean estimate is ~19 and ~18.8 using the upper end of the range.
- FY2023: 16 brokers, mean estimate $5.69, low/high range $5.18 – $6.21. The valuation using the mean estimate is ~15.8 and ~14.5 using the upper end of the range.
- FY2024: 11 brokers, mean estimate $6.54, low/high range $5.28 – $7.23. The valuation using the mean estimate is ~13.8 and ~12.4 using the upper end of the range.
Based on the recent trend in broker estimates, I envision downward revisions to these broker estimates. This will likely lead to slightly higher valuations than those reflected above.
Final Thoughts
Raytheon Technologies, a defense and commercial aerospace powerhouse, is benefitting from an increasingly hostile global political climate. However, as much as I like this space, I am hesitant to add to my exposure. Valuations are not sufficiently attractive so I am deploying money toward the purchase of shares in other wonderful companies that have temporarily fallen out of favour.
When I completed my Mid 2022 Investment Holdings Review, RTX was my 24th largest holding. I have not made any lump sum purchase after my 300 share purchase @ $58/share in October 2020 through one of the 'Core' accounts in the FFJ Portfolio. Nevertheless, my exposure continues to increase via the automatic reinvestment of dividends.
I wish you much success on your journey to financial freedom!
Note: Please send any feedback, corrections, or questions to [email protected].
Disclosure: I am long LMT and RTX.
Disclaimer: I do not know your circumstances and am not providing individualized advice or recommendations. I encourage you not to make any investment decisions without conducting your research and due diligence. You should also consult your financial advisor about your specific situation.
I wrote this article myself and it expresses my own opinions. I am not receiving compensation for it and have no business relationship with any company whose stock is mentioned in this article.