
Investors should invest in great companies, such as Moody’s Corporation (MCO), when they temporarily fall out of favour. I have been increasing my exposure to wide moat MCO on weakness.
I last reviewed MCO in my May 4, 2022 Moody’s Current Headwinds Present a Buying Opportunity post. At the time, it had just reported Q1 2022 results and FY2022 guidance and my thoughts were:
‘What I see in MCO is a high-quality company that is currently experiencing challenging business conditions. The headwinds are likely to continue to negatively impact MCO’s results for at least the remainder of FY2022. Eventually, however, these headwinds will end. This is why I think now is the time to acquire shares in this great company.’
After my May 4, 2022 post, I acquired additional MCO shares on June 1 @ $287.73.
MCO was my 12th largest holding at the time of my Mid-2022 Investment Holdings Review. My exposure was slightly less than S&P Global (SPGI), my 10th largest holding.
On July 26, MCO reported weak Q2 and YTD2022 results and lowered its FY2022 outlook for the 2nd time this year. It, however, remains a fundamentally sound business and my long-term outlook remains unchanged. I, therefore, acquired more shares on July 26 at $286.14.
My MCO exposure now stands at 410 shares in a ‘Core’ account and 250 shares in a ‘Side’ account within the FFJ Portfolio. Unless I perform another review, I have no idea where MCO and SPGI currently rank. Nevertheless, I strongly suspect both are still within my top 20 holdings.
Business Overview
Since its founding in 1900, MCO has evolved to become a leading global integrated risk assessment firm that provides organizations and investors with the tools and information to make better decisions.
Item 1 in MCO’s FY2021 Annual Report and Form 10-K provides a comprehensive overview of the company and its 2 operating segments (Moody’s Investors Services (MIS) and Moody’s Analytics (MA)).
Further information can be found in a series of videos in the ‘Moody’s Moments‘ section of the company’s website.
Financials
Q2 and YTD2022 Results
MCO’s Q2 Form 8-K and Earnings Presentation were released on July 26, 2022.
MIS Segment
MCO rates more than $72T in outstanding debt for over 35,000 issuers and transactions. In FY2021, the MIS segment generated ~$3.8B in revenue and it rated $6T in debt issuance. It also published over 26,000 research reports.
The rising interest rate environment and high cash balances on issuers’ Balance Sheets have resulted in a 28% revenue decrease in this segment.
Debt issuance is expected to remain significantly constrained for at least the remainder of the current fiscal year.

Despite short-term headwinds, more than $4T of debt is to mature over the next few years. Refinancing a significant portion of this debt will require rating reviews.
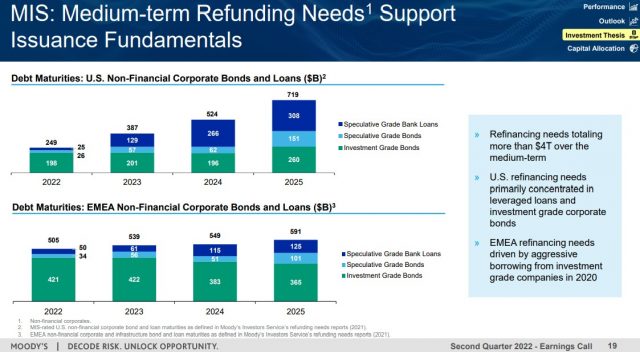
Source: MCO – Q2 2022 Earnings Presentation – July 26, 2022
MA Segment
The MA segment delivered strong growth with revenue up 18% on heightened customer demand.

Source: MCO – Q2 2022 Earnings Presentation – July 26, 2022
MCO has successfully transitioned the MA business to a predominantly subscription-based model, with strong recurring revenue.
This subscription-based model leads to MCO collecting fees before services are provided. In Q1 2022 and Q2 2022, the current portion of deferred revenue was $1.525B and $1.285B, respectively. In Q1 and Q2, deferred revenue comprised ~51% and ~46.6% of current liabilities.
The long-term portion of deferred revenue is ~$85 million.
MA’s YTD recurring revenue comprised 94% of total MA YTD revenue. This is an increase from 93% in Q2 2021.
MCO now includes an annualized recurring revenue (ARR) metric as a component of its reporting. Management expects this new metric to provide greater transparency into the growth trajectory of MA’s recurring revenue with visibility specifically into the growth of the subscription business from both the acquisition of new customers and business expansion from existing customers.
MCO calculates ARR and Organic ARR by taking the total recurring contract value for each active renewable contract as of the reporting date, divided by the number of days in the contract. This is then multiplied by 365 days to create an annualized value.
Renewable contracts are subscriptions, term licenses, maintenance and renewable services.
ARR excludes transaction sales, including training, one-time services and perpetual licenses. Organic ARR excludes contracts related to acquisitions to provide additional perspective in assessing ARR growth excluding the impacts from certain acquisition activities.
Operating Cash Flow (OCF) and Free Cash Flow (FCF)
In FY2012 – FY2021, MCO generated annual FCF (in millions of $) of $0.778, $0.885, $0.944, $1.109, $1.144, $0.664, $1.370, $1.606, $2.043, and $1.866.
YTD2022 OCF is $0.761B vs $1.27B for the first 6 months of FY2021.
YTD2022 FCF is $0.628B vs $1.226B for the first 6 months of FY2021.
FY2022 Outlook
Images of MCO’s FY2022 outlook provided with the release of Q2 2022, Q1 2022, and FY2021 results are reflected below for ease of comparison. Guidance for the MIS and MA segments is found in the Q2 2022 presentation.

Source: MCO – Form 8-K – July 26, 2022
 - July 26, 2022")
Source: MCO – Form 8-K – July 26, 2022


Credit Ratings
The current environment is one in which an investment’s degree of risk must NOT be overlooked.
Given that MCO is one of the world’s 2 largest rating agencies, it would be foolish for it to jeopardize its reputation by allowing its credit ratings to slip below investment grade.
MCO’s senior unsecured domestic long-term debt ratings and outlook are unchanged from my last review.
- S&P Global – BBB+ with a stable outlook; and
- Fitch – BBB+ with a stable outlook;
Both ratings are the top tier of the lower medium-grade investment-grade tier. These ratings define MCO as having an ADEQUATE capacity to meet its financial commitments. However, adverse economic conditions or changing circumstances are more likely to lead to MCO having a weakened capacity to meet its financial commitments.
MCO’s Form 10-Q typically has a long-term debt schedule. The Q2 Form 10-Q has yet to be released so I include the long-term debt schedule from the Q1 2022 Form 10-Q.
The Q2 2022 Form 8-K reflects $7.158B of long-term debt and $0.499B as the current portion of long-term debt (CPLTD). These figures are relatively similar to those at the end of Q1 2022.
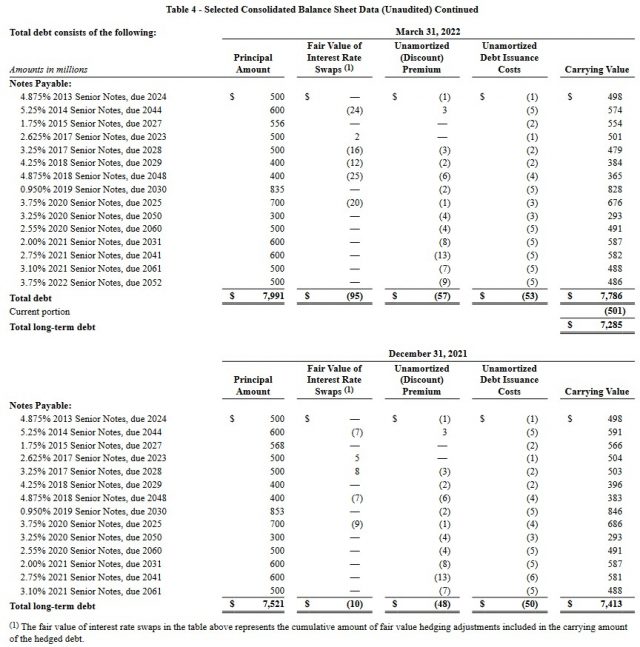
A schedule of MCO’s long-term debt is accessible here. MCO’s debt maturity schedule suggests it should have no problem meeting its obligations.
MCO’s credit risk is acceptable from my perspective.
Dividend and Dividend Yield
MCO’s dividend history reflects annual dividend increases starting in 2011 following a dividend freeze that was precipitated by challenging business conditions during The Financial Crisis.
On July 25, 2022, MCO’s Board declared a regular quarterly dividend of $0.70/share. The dividend is payable on September 9, 2022 to stockholders of record at the close of business on August 19, 2022.
The dividend yields at the time of prior reviews are:
- September 9, 2021 – shares were trading at ~$382 and the $0.62 quarterly dividend yielded ~0.65%;
- October 30, 2021 post – shares were trading at ~$404 and the $0.62 quarterly dividend yielded ~0.61%;
- February 12, 2022 – shares were trading at ~$332.50 and the $0.70 quarterly dividend yielded ~0.84%; and
- May 2, 2022 – shares were trading at ~$300.88 and the $0.70 quarterly dividend yielded ~0.93%.
I also acquired shares at $287.73 on June 1, 2022 and the $0.70 quarterly dividend yielded ~0.97%; no post was written to disclose this purchase.
On July 26, 2022, I acquired shares for ~$286.14. The $0.70 quarterly dividend now yields ~0.98%.
MCO’s diluted weighted average number of shares outstanding during FY2011 – FY2021 (in millions of shares) are 229, 227, 224, 215, 203, 195, 194, 194, 192, 189, and 188. The diluted weighted average number of shares outstanding for the quarter ending June 30, 2022 is 184.9 million.
In Q2, MCO repurchased $0.213B of shares vs $0.371B in Q2 2021. YTD2022 it has repurchased $0.871B vs $0.503B in the first half of FY2021.
As of June 30, 2022, MCO had ~$0.96B of share repurchase authority remaining versus ~$1.2B at the end of Q1.
Valuation
When I reviewed MCO on September 9, 2021, management’s adjusted diluted EPS guidance was $11.55 – $11.85. Using a ~$382 share price and the $11.70 mid-point of guidance the forward adjusted diluted PE was ~32.7. In addition, the following were the FY2021 – FY2023 adjusted diluted EPS analyst estimates:
- FY2021 – 16 brokers – mean of $11.87 and low/high of $11.69 – $12.52. Using the mean estimate, the forward adjusted diluted PE is ~32.2.
- FY2022 – 17 brokers – mean of $12.40 and low/high of $11.54 – $13.50. Using the mean estimate, the forward adjusted diluted PE is ~30.8.
- FY2023 – 12 brokers – mean of $14.01 and low/high of $13.05 – $15.25. Using the mean estimate, the forward adjusted diluted PE is ~27.3.
At the time of my October 30th review, MCO was trading at ~$404 and management had raised FY2021 adjusted diluted EPS guidance to $12.15 – $12.35. Using the broker guidance available at the time, I arrived at the following:
- FY2021 – 17 brokers – mean of $12.04 and low/high of $11.70 – $12.67. Using the mean estimate, the forward adjusted diluted PE is ~33.6.
- FY2022 – 17 brokers – mean of $12.46 and low/high of $11.62 – $13.61. Using the mean estimate, the forward adjusted diluted PE is ~32.4.
- FY2023 – 14 brokers – mean of $14.03 and low/high of $13.04 – $15.72. Using the mean estimate, the forward adjusted diluted PE is ~29.
Shares were trading at ~$332.50 when I wrote my February 12, 2022 review. The forward adjusted diluted PE levels using current broker guidance were:
- FY2022 – 16 brokers – mean of $12.66 and low/high of $11.87 – $13.60. Using the mean estimate, the forward adjusted diluted PE is ~26.3.
- FY2023 – 14 brokers – mean of $14.11 and low/high of $13.42 – $15.45. Using the mean estimate, the forward adjusted diluted PE is ~23.6.
- FY2024 – 4 brokers – mean of $16.23 and low/high of $14.90 – $17.55. Using the mean estimate, the forward adjusted diluted PE is ~20.5.
When I wrote my May 4 post, I had recently added to my exposure at $300.88/share. Management’s FY2022 diluted EPS and adjusted diluted EPS guidance ranges were $9.85 – $10.35 and $10.75 – $11.25, respectively. Using a $10.10 diluted EPS mid-point, the forward diluted PE was ~30 and the forward adjusted diluted PE was ~27.4 based on $11 in adjusted diluted EPS.
The forward adjusted diluted PE levels using broker guidance at the time were:
- FY2022 – 18 brokers – mean of $11.28 and low/high of $10.85 – $12.90. Using the mean estimate, the forward adjusted diluted PE is ~26.7.
- FY2023 – 18 brokers – mean of $12.99 and low/high of $12.31 – $14.20. Using the mean estimate, the forward adjusted diluted PE is ~23.2.
- FY2024 – 9 brokers – mean of $15.04 and low/high of $13.81 – $17.45. Using the mean estimate, the forward adjusted diluted PE is ~20.
Management’s FY2022 revised diluted EPS outlook is $8.10 – $8.60 and its revised adjusted diluted EPS outlook is $9.20 – $9.70. Using my $286.14 purchase price and an $8.35 diluted EPS mid-point, the forward diluted PE is ~34.3 and the forward adjusted diluted PE is ~30.3 based on $9.45 in adjusted diluted EPS.
The forward adjusted diluted PE levels using current broker guidance are:
- FY2022 – 19 brokers – mean of $10.13 and low/high of $9.53 – $11.15. Using the mean estimate, the forward adjusted diluted PE is ~28.2.
- FY2023 – 19 brokers – mean of $11.91 and low/high of $11.17 – $13.60. Using the mean estimate, the forward adjusted diluted PE is ~24.
- FY2024 – 10 brokers – mean of $13.99 and low/high of $12.58 – $16.70. Using the mean estimate, the forward adjusted diluted PE is ~20.5.
Current broker estimates, however, are very likely to be revised lower over the coming days. I expect valuation levels based on broker estimates will approach those based on management’s FY2022 guidance.
Final Thoughts
MCO and SPGI are market leaders in providing credit ratings on fixed-income securities. Both companies enjoy a strong competitive position given the embedded nature of credit ratings among capital market participants, regulators, and index providers.
MCO’s valuation is somewhat rich when based on FY2022 guidance that incorporates temporarily weak conditions in the MIS segment. However, investors need to consider that MIS’s business is cyclical and the current environment is not conducive to strong performance.
Looking forward, more than $4T of debt is scheduled to mature over the next few years. This debt will need to be refinanced and rated leading me to conclude that there will be a resurgence in MIS’s results starting in late 2022 or early 2023.
If investors wait until the business environment improves before investing in MCO, it might be too late. MCO’s results could deteriorate further before they improve. If this happens and MCO’s share price deteriorates further, I will undoubtedly add to my exposure.
I wish you much success on your journey to financial freedom!
Note: Thanks for reading this article. Please send any feedback, corrections, or questions to finfreejourney@gmail.com.
Disclosure: I am long MCO and SPGI.
Disclaimer: I do not know your circumstances and am not providing individualized advice or recommendations. I encourage you not to make any investment decisions without conducting your research and due diligence. You should also consult your financial advisor about your specific situation.
I wrote this article myself and it expresses my own opinions. I am not receiving compensation for it and have no business relationship with any company whose stock is mentioned in this article.