![]() I last reviewed CME Group (CME) in my March 24, 2026 post. At the time, the most current financial information available was for Q4 and FY2025.
I last reviewed CME Group (CME) in my March 24, 2026 post. At the time, the most current financial information available was for Q4 and FY2025.
On April 22, 2026, CME released its Q1 2026 results thus prompting me to revisit this existing holding in the FFJ Portfolio.
Business Overview
CME operates a derivatives marketplace which offers a range of futures and options products for risk management. It is where market participants turn to manage risk across the most diverse set of benchmark products.
The company’s website and Part 1 of the FY2025 Form 10-K are great sources of information to learn about the company.
Financials
Q1 2026 Results
The Q1 2026 earnings release and Form 10-Q are accessible through the SEC Filing section of the company’s website.
On The Q1 2026 earnings call, management states:
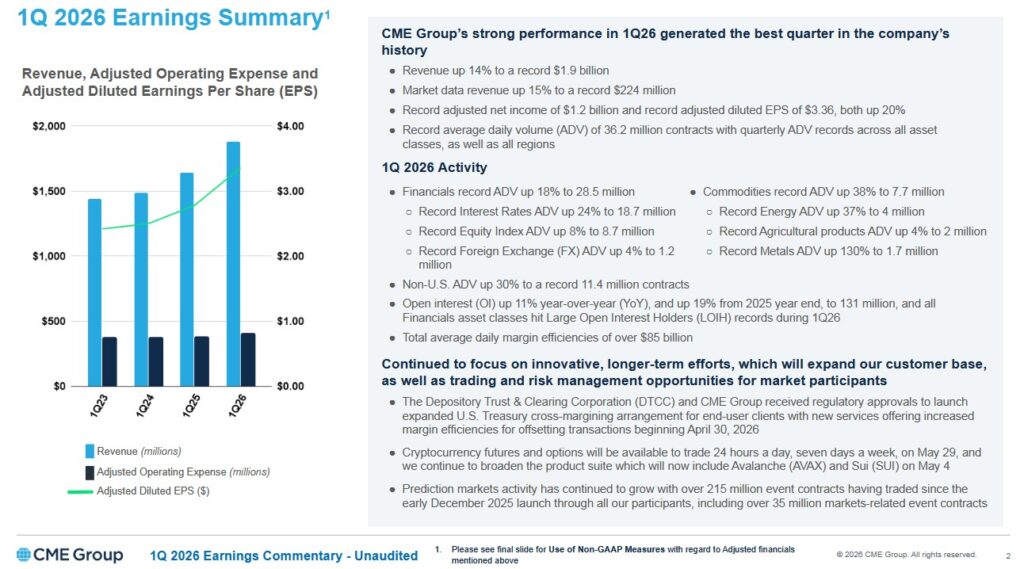
The first quarter average daily volume of 36.2 million contracts was the highest quarterly average daily volume (ADV) in CME’s history, and represented an increase of 22% compared to the same period last year and 6 million contracts a day higher than any previous quarter. For the first time in our history, we achieved simultaneous record volume across every one of our six asset classes: Interest Rates, Equities, Energy, Agricultural products, Metals, and FX. In aggregate, our commodities sector volumes grew by 38% and our financial products volume grew by 18%. Building on the momentum of our record 2025, our global expansion continues to accelerate. International average daily volume reached a record 11.4 million contracts, a stunning 30% increase from 2025. The EMEA, APAC, and Latin American regions all posted record highs.
Our international business also saw record volume in all six asset classes simultaneously, proving that our value proposition is resonating globally. We aren’t just growing volume. We’re growing client value. We delivered record levels of capital efficiency, saving our customers an average of over $85 billion in margin per day. Additionally, open interest ended the quarter up 11% over the past year and up 19% since the beginning of 2026. During the quarter, U.S. Treasury open interest reached an all-time high of 36.3 million contracts, driven by unprecedented demand for U.S. Treasury futures and options.
The following is a summary of CME’s Q1 2026 results.
Deferred Income Tax Liabilities
At the end of Q1 2026, CME reflected ~$5.221B in net deferred income tax liabilities (DTL). This is just over 50% of CME’s $10.34B of total liabilities when we exclude $165.035B in performance bonds and guaranty fund contributions; an equivalent amount of the performance bonds and guaranty fund contributions liability is reflected as an asset.
As an investor, it is wise to question the probability (and when) CME will need to disburse ~$5.221B.
The good news is that this is not an amount that comes due all at once. The full amount represents a massive pool of future tax obligations that will be paid incrementally over several decades. There is also a strong probability a significant percentage of this amount will never need to be repaid!
The vast majority of CME’s DTL stems from intangible assets (such as trading products and exchange registrations) created during its historical mergers with the Chicago Board of Trade (CBOT) (2007) and NYMEX (2008).
Taxes related to these transactions only become payable if CME sells these core exchange businesses. Since CME is unlikely to sell the CBOT or NYMEX, a significant portion of this $5.221B may effectively remain on the balance sheet indefinitely as a permanent deferral.
A smaller portion of the DTL relates to the difference between tax and book depreciation for CME’s physical and technology infrastructure. As CME’s equipment and software age, the tax deductions the company took years ago eventually run out. On an annual basis and in small increments, there will be a non-cash adjustment in the ‘Cash Flows from Operating Activities’ section of CME’s 10-Q and 10-K filings, where ‘Deferred Income Taxes’ are added back or subtracted.
If the U.S. federal corporate tax rate were to increase, CME would have to re-value this ~$5.221B liability upward. Conversely, a tax cut would shrink the liability. The adjustment, however, only happens the moment the law is passed although the actual cash outflow only occurs as the underlying assets are amortized or sold.
CME’s DTL is a classic example of Low-Cost Capital. While the ~$5.221B is a liability, it actually represents cash CME has retained and reinvested in the business (or paid out as dividends) instead of sending it to the Internal Revenue Service.
In a nutshell, most of this liability will likely never be paid during our lifetime, as it is tied to core assets the company intends to hold forever.
Conventional And Modified Free Cash Flow (FCF) Calculations (FY2019 – FY2025 and Q1 2026)
FCF is a non-GAAP measure, and therefore, its calculation is inconsistent. Many investors deduct CAPEX from OCF to arrive at FCF. In my How Stock Based Compensation Distorts Free Cash Flow post, I explain why I now also deduct stock based compensation (SBC) that is found in the Consolidated Statements of Cash Flows to determine FCF.
The conventional method only deducts CAPEX from OCF while the more conservative modified method also deducts SBC.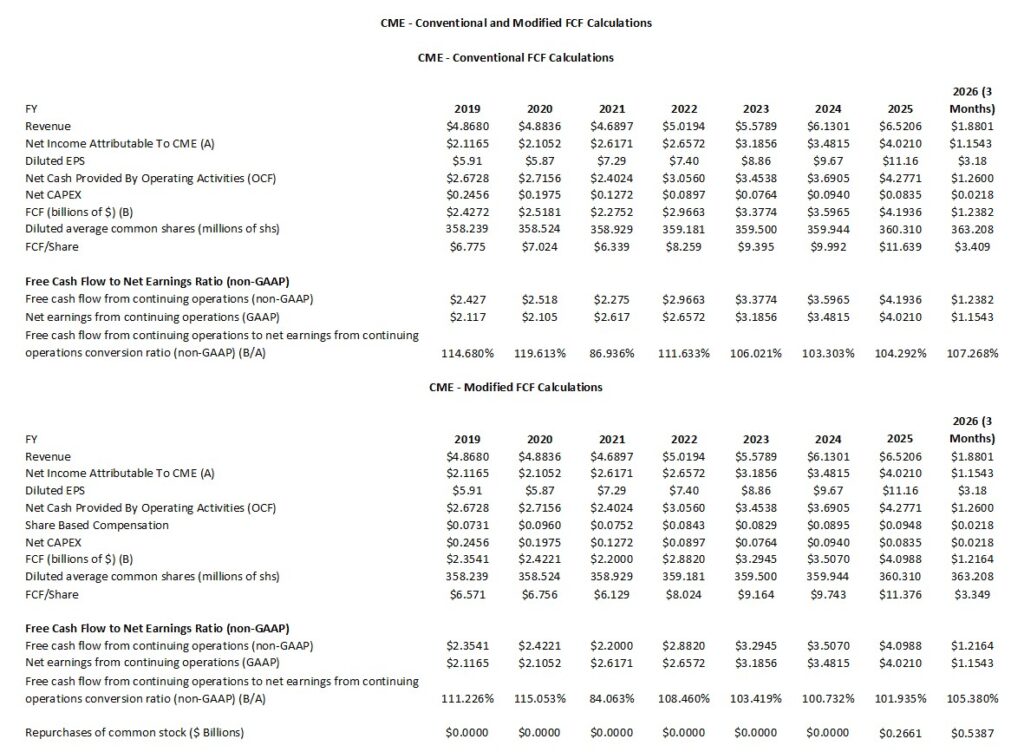
ROIC and WACC
Return on Invested Capital (ROIC) provides an indication of a company’s efficiency. In essence, is a company actually creating value or ‘burning’ cash for the sake of growth?
A company with a higher ROIC is mathematically worth more because it requires less reinvestment to achieve that growth.
A good indication of how well a company is performing is to compare ROIC to the Weighted Average Cost of Capital (WACC). WACC, however, is not a metric officially reported by CME but it can be roughly estimated based on the company’s credit profile and market conditions.
The generally accepted high-level formula used by Wall Street is:
ROIC = NOPAT/Average Invested Capital
with the Net Operating Profit After Tax (NOPAT) formula being Operating Income (EBIT) x (1-tax rate)
This shows how much profit the core business makes while ignoring how much debt the company has.
The Average Invested Capital is the total money tied up in the business.
- The Operating Approach formula is
- The Financing Approach is
CME Group’s ROIC has seen a steady upward trajectory since 2021. This has been driven by record average daily volumes (ADV) as market participants sought hedging tools amid global interest rate volatility.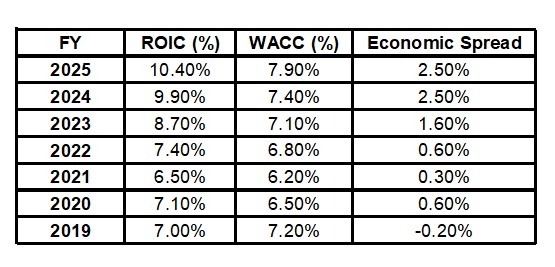 CME’s cost of capital dipped in 2021 during the low-interest-rate environment. It has, however, risen with broader market rate hikes and equity risk premiums.
FY2026 Guidance
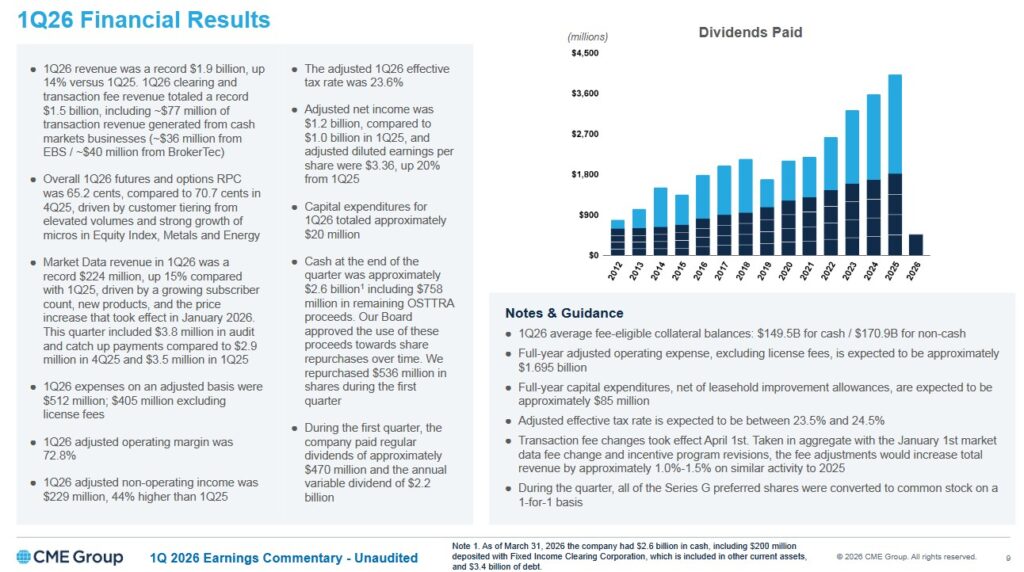
CME does not issue earnings guidance. On the Q4 2025 earnings call, however, management expected total adjusted operating expenses excluding license fees to be ~$1.695B. There is no change to this guidance.
The occupancy cost will likely continue to grow over the course of the year as CME does things like opening its new Dallas facility. Technology related expenses will also continue to grow as CME moves more into the cloud environment.
Management’s forecast calls for total capital expenditures to remain at ~$85 million. The adjusted effective tax rate should continue to be 23.5%-24.5%.
Risk Assessment
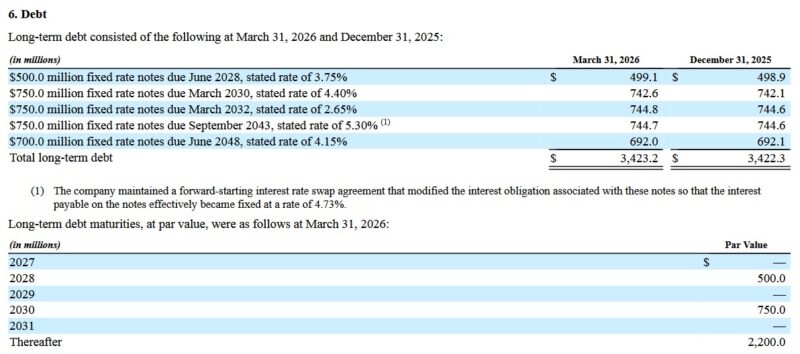
CME has no debt maturing until June 2028.
CME’s senior unsecured long-term debt ratings are the lowest tier of the high-grade category and are investment grade. These ratings define CME as having a VERY STRONG capacity to meet its financial commitments. It differs from the highest-rated obligors only to a small degree.
- Moody’s: Aa3 with a stable outlook (affirmed May 19, 2025)
- S&P Global: AA- with a stable outlook (affirmed July 18, 2025)
- Fitch: AA- with a stable outlook (affirmed February 2, 2026)
These strong ratings are acceptable for my risk tolerance.
Dividend and Dividend Yield
Dividend distributions continue to take priority over share repurchases with FY2025 distributions being $3.933B.
CME distributed a $6.15 special dividend and a $1.30 regular quarterly dividend on March 26, 2026 for a total of ~$2.698B. Declaration of the next $1.30 quarterly dividend will be in early May for distribution on or around June 25.
CME’s FY2025 Form 10-K reflects the following:
We intend to continue to pay a regular quarterly dividend to our shareholders, with a target of 50% – 60% of the prior year’s cash earnings. The decision to pay a dividend and the amount of the dividend, however, remains within the discretion of our board of directors and may be affected by various factors, including our earnings, financial condition, capital requirements, levels of indebtedness and other considerations our board of directors deems relevant. We are also required to comply with restrictions contained in the general corporation laws of our state of incorporation, which could limit our ability to declare and pay dividends.
CME’s dividend history is accessible here.
CME’s capital allocation has historically excluded share repurchases. Its capital return policy, however, was amended in FY2025 to include the opportunistic repurchase of CME shares.
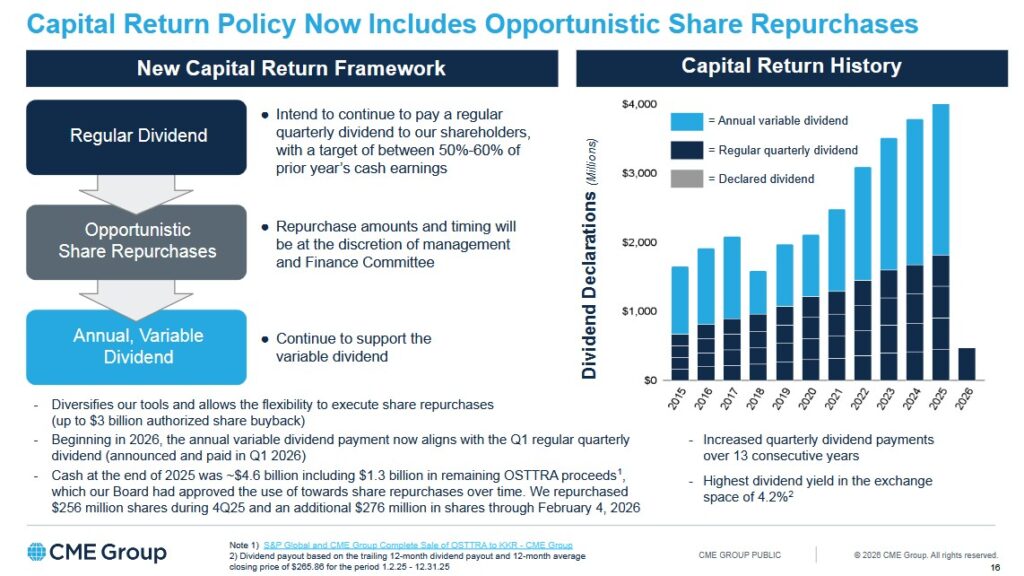
Given that CME has never repurchased shares prior to FY2025, it is not surprising the weighted average outstanding diluted shares outstanding (in millions of shares rounded) has risen from 336.063 in FY2014 to 360.310 million in FY2025.
In FY2025, however, CME repurchased $0.2661B of its shares and in Q1 2026 it repurchased ~$0.539B.
Valuation
Using the current ~$285 share price and forward adjusted diluted EPS broker estimates, CME’s forward adjusted diluted PE levels are:
- FY2026 – 15 brokers – mean of $12.23 and low/high of $11.91 – $12.62. Using the mean estimate, the forward-adjusted diluted PE is ~23.3.
- FY2027 – 15 brokers – mean of $12.87 and low/high of $11.85 – $13.23. Using the mean estimate, the forward-adjusted diluted PE is ~22.1.
- FY2028 – 9 brokers – mean of $13.79 and low/high of $12.57 – $14.26. Using the mean estimate, the forward-adjusted diluted PE is ~20.7.
When I wrote my March 24, 2026 post, the share price was ~$303.60. Using the current forward adjusted diluted EPS broker estimates, CME’s forward adjusted diluted PE levels were:
- FY2026 – 13 brokers – mean of $12.10 and low/high of $11.74 – $12.79. Using the mean estimate, the forward-adjusted diluted PE is ~25.1.
- FY2027 – 13 brokers – mean of $12.75 and low/high of $11.98 – $13.56. Using the mean estimate, the forward-adjusted diluted PE is ~23.8.
- FY2028 – 8 brokers – mean of $13.78 and low/high of $12.76 – $14.82. Using the mean estimate, the forward-adjusted diluted PE is ~22.03.
CME’s modified FCF conversion ratio is generally slightly higher than 100%. This suggests CME’s P/modified FCF (share) valuation is just slightly better than its P/E.
Final Thoughts
CME was my 11th largest holding when I completed my 2025 Mid-Year Portfolio Review and it was my 14th largest holding when I completed my 2025 Year-End Investment Holdings Review.
I currently hold 592.14498 shares in a ‘Core’ account and 422 shares in a ‘Side’ account within the FFJ Portfolio. The automatic reinvestment of the variable and regular quarterly dividend distribution on March 26 is the reason my exposure has risen from the prior 579.83868 shares and 414 shares. I hold all CME shares in taxable accounts, and therefore, I automatically incur a 15% withholding tax.
When I completed my March 24, 2026 post I estimated a fair price being ~$255 – ~$265. Following a strong start to FY2026 and high volatility caused by geopolitical events (CME benefits from economic and geopolitical uncertainty). I think a fair value is ~$265 – $270.
I wish you much success on your journey to financial freedom!
Note: Please send any feedback, corrections, or questions to finfreejourney@gmail.com.
Disclosure: I am long CME.
Disclaimer: I do not know your circumstances and do not provide individualized advice or recommendations. I encourage you to make investment decisions by conducting your research and due diligence. Consult your financial advisor about your specific situation.
I wrote this article myself and it expresses my own opinions. I do not receive compensation for it and have no business relationship with any company mentioned in this article.