 Summary
- This Brookfield Asset Management stock analysis is based on Q4 and FY2016 results and outlook for fiscal 2017 which were released February 9, 2017.
- Brookfield Asset Management (BAM) reflect a YoY increase in Funds from Operations (CDN$3.18 for 2016 vs. CDN$2.49 for 2015).
- The nature of BAM’s operations is such that I prefer to use Funds from Operations (“FFO”) as opposed to Net Income as the basis on which to make an investment decision.
- BAM is now at the stage where the “wealthy of the wealthy” seek it out for investment opportunities.
Introduction
On February 9, 2017 Brookfield Asset Management Inc. (NYSE: BAM) released its Q4 2016 and FY2016 results. We currently own shares the TSX: BAM.a shares within the FFJ Portfolio and in our daughter’s Tax Free Savings Account (TFSA).
As a result of owning BAM.a shares for several years we received units in Brookfield Business Partners and Brookfield Property Partners when these entities were spun off into limited partnerships.
The following is a graph which shows the appreciation in BAM from the date we first acquired shares. Clearly, we have been pleased with this investment.
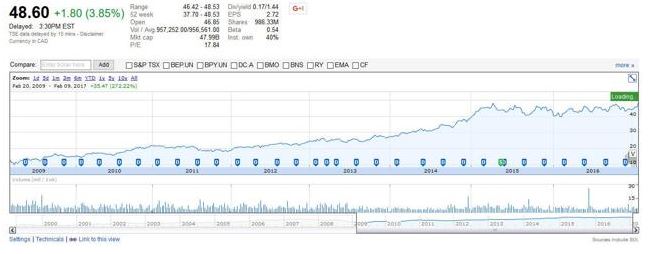
TSX: BAM.a – stock price chart
Business Overview
BAM is a leading global alternative asset manager with approximately $250 billion in assets under management. The company has a 115+ year of owning and operating assets with a focus on property, renewable power, infrastructure, and private equity.
BAM has an impressive size and scope that can pose a challenge for some investors to fully understand. Perhaps the best manner in which to get an understanding of BAM’s primary asset management business is to read (and, if you’re like me, re-read) the Letter to Shareholders from BMA’s CEO (J. Bruce Flatt).
BAM is part owner of four separately listed entities bearing the Brookfield name. Each entity listed below is linked to the most recent CEO’s Letter to Unitholders which outlines the entity’s Strategy and Goals, provides a high level Operating Report for FY2016, and the Outlook and Priorities for 2017.
- Brookfield Property Partners (NYSE: BPY) (TSX: BPY.UN) – Ownership Interest: 62% (fully diluted)
- Brookfield Renewable Partners (NYSE: BEP) (TSX: BEP.UN) – Ownership Interest: 61%
- Brookfield Business Partners (NYSE: BBU) (TSX: BBU.UN) – Ownership Interest: 75%
- Brookfield Infrastructure Partners (NYSE: BIP) (TSX: BIP.UN) – Ownership Interest: 30%
In addition, information regarding each entity can be found in various multiple page investor presentations which were made at BAM’s 12th Annual Investor Meeting on September 28, 2016.
To try and condense all this information in one post would not be possible. Furthermore, if I attempted to do so, I would leave out critical information which could mislead you.
Q4 and FY2016 Financial Results
Highlights of BAM’s results can be found in its February 9, 2017 Earnings release and in the Q4 2016 Supplemental Information document.
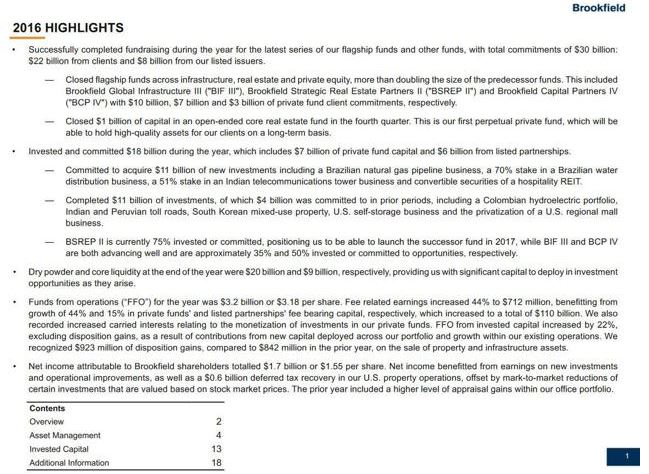
BAM 2016 Highlights
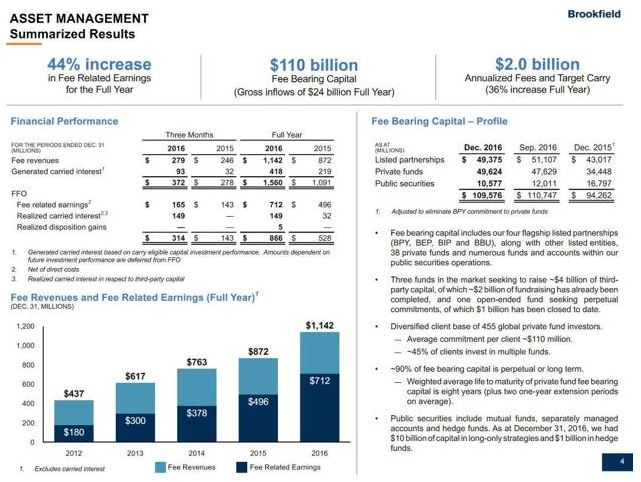
BAM Summarized Results

BAM Debt to Capitalization
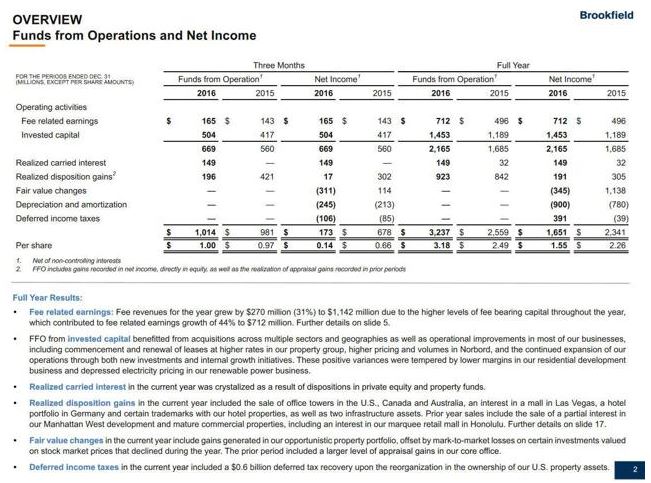
While some readers may deduce that BAM’s performance deteriorated in FY2016 relative to that of FY2015, this would be incorrect. BAM and the 4 “Brookfield” entities listed earlier in this post are in the business of acquiring long-term assets and increasing cash flow over a period of time. The underlying fluctuation in assets values, while important, is not necessarily the key driver. As a result, while net income of $3.3B or $1.55/share compared to $4.7B or $2.26/share in FY2015 is certainly not what an investor desires, the more important metric on which you should focus is Funds from Operations (“FFO”). Looking at this metric, BAM had a successful year in that FFO increased by 26% due to strong growth in asset management revenues and carried interests.
This 26% increase is the growth from December 31, 2015 – December 31, 2016 ($908MM vs. $1.143B). BAM excludes Transaction and Advisory Fees, Performance Income, and Target Carried Interest in determining FFO.

BAM Annualized Fees and Target Carry

BAM Annualized Fees Incentive Distributions
The reason net income was lower relative to the previous fiscal year is because appraisal gains within the property portfolio, for example, totalled $1.0B in 2016 compared to gains of $2.3B in FY2015. Furthermore, most of the FY2016’s gains occurred in opportunistic property portfolios and were a result of increasing cash flows while appraisal gains in the core office portfolios were flat overall. Fair value changes also included the impact of lower values for certain investments that are determined by stock market prices. As a result, consolidated fair value changes were essentially flat in 2016.
Outlook for Fiscal 2017
You are encouraged to read Mr. Flatt’s Letter to Shareholders (a link to this letter was provided in the Business Overview section of this post) wherein he indicates that institutional investors continue to allocate greater proportions of their funds to real assets.
As part of the shift to real assets, BAM is starting to see greater allocations from traditional fixed income portfolios into private credit strategies. BAM should benefit from this trend since it has been expanding its credit capabilities for many years and it is now fundraising with meaningful capital for these strategies. BAM anticipates that over time, this could result in the addition of significant assets under management.
Mr. Flatt indicated that BAM’s current investing themes continue to revolve around utilizing its competitive strengths of size, global footprint, and operating capabilities. It is allocating capital to most of its investment markets, but disproportionately to the emerging economies where it feels it can still acquire assets of very good value in slowly recovering economies.
It is important to note that BAM, although cognizant of short-term performance, manages is business for the long term, and therefore, places greater focus on long-term metrics; its goal is to generate 12% to 15% compound returns over the longer term.
Investors in BAM would be well advised to focus on where BAM will be 10 – 15 years in the future versus where it will be the next 3 years.
Valuation
I generally include screen shots which reflect mean estimated EPS from various analysts. In the case of BAM, however, the sources I use (TD Bank WebBroker and ValuEngine) have but 1 analyst’s estimate of CDN $1.08 as 2017’s EPS. Even each underlying “Partners” entity has no earnings estimates. I will, therefore, endeavor to come up with a value for BAM that makes some sense to me based on the results provided in February 9, 2017’s Earnings release.
As I compose this post, BAM is trading at ~CDN$48.40 and USD$36.90 and a PE just under 18 according to Google Finance. As previously noted, the “E” portion of PE is somewhat misleading in the case of BAM. I would prefer to look at P/FFO.
BAM – Funds from Operations and Net Income
I tried to locate FFO/Price for each member of BAM’s peer group (KKR (NYSE: KKR), Carlyle Group (NASDAQ: CG), Oaktree Capital (NYSE: OAK), and Blackstone Group (NYSE: BX)) but am unable to easily locate same. I have also taken the position that calculating FFO/Price for each company for 6 years is an extremely onerous task which I am not prepared to undertake for the purpose of writing this post.
I have, therefore, looked at BAM’s FFO, FFO/share and the December 31st closing stock price for 2011 – 2016 to determine BAM’s FFO/Stock Price. What I found was that BAM’s FFO/Stock Price as at December 31, 2016 was just a little bit higher than the December 31st 6 year average of 13.43. The variance is small enough that I view BAM to have been reasonably priced as at this date.
As at the date of this post, the FFO/Stock Price ratio is now closer to 15.22 ($48.40 Feb 9, 2017 stock price/BAM’s FY2016 FFO of CDN$3.18/share or USD$2.42/share if I use an exchange rate of 1.3157). This is slightly higher than the 6 year average of 13.43 but for a company of BAM’s quality and its growth prospects, this slight premium should not be enough to dissuade you from acquiring BAM shares if you have a long-term investment horizon.
BAM’s Board declared a dividend of US$0.14/share/quarter or US$0.56/share/year payable on March 31, 2017 to shareholders of record as at the close of business on February 28, 2017. While this represents an 8% increase over the prior year, it is most likely not the basis on which you would purchase BAM. Having said this, eliminating a low dividend yielding stock as a potential investment is not always a wise choice as explained in my post Low or No Dividend Yield Companies Belong in Your Portfolio.
Brookfield Asset Management Stock Analysis – Final Thoughts
I recognize BAM is not an easy to understand entity. This may explain why some readers insinuate that BAM management makes “rosy, get rich” style calculations, unrealistic future share price predictions, and their presentations read like a multi-level marketing sales event.
First and foremost, BAM’s management does not arbitrarily assign values to underlying assets and come up with “get rich” style calculations. They pay people a lot of money to determine these values and to be as accurate as possible. Remember what type of money BAM is trying to attract. They are seeking investment money from the “wealthy of the wealthy” which includes institutional investors and sovereign funds. Do you think these investors are foolish enough to fall for fabricated asset values?
In addition, BAM raises financing from major global financial institutions. While some of these institutions have done crazy deals, I can assure you that my former employer is a conservative lender and in many cases passed on opportunities some of the US banks tried to syndicate. When a lending opportunity related to BAM came up, however, my former employer eagerly participated (but still performed a proper assessment of the credit risk). Do you think that perhaps these people who were assessing BAM’s credit risk felt they were making decisions on the basis of “rosy, get rich” style calculations or do you think they may have known what they were doing?
If you are an investor with an ounce of understanding how the markets work, you will not make an investment on the basis of future share prices. Markets are unpredictable and can occasionally react irrationally.
I do my best to look at the underlying business. In the case of BAM, they are acquiring long-term assets that are, in many cases, strategic assets such as ports, toll roads, hydro dams, pipelines, wind farms, etc.. These all strike me as assets that will be more valuable as time progresses and will continue to generate a solid stream of income.
Another reason I think BAM is a worthwhile investment is that management has “skin in the game”. It just irks me when I hear of high level executives being compensated extremely well but their level of ownership in the company they run is relatively insignificant. This is not the case with BAM’s senior management. In some cases, a significant portion of BAM’s senior managements’ net worth is tied up in BAM (this is a link to a Bloomberg interview with BAM’s CEO).
Some people have commented that an investment in BAM is inappropriate for someone in retirement given that its dividend yield is so low. I am retired and I totally disagree. If you properly structure your investment portfolio you will allocate your money to income and growth related companies. To allocate your investments solely to companies that only have a dividend yield above a certain threshold, in my humble opinion, is not prudent.
Furthermore, we structured our investments (equity and rental properties) so that we would not need to rely on 100% of the income generated from our investments to sustain our lifestyle.
As previously noted, we own BAM shares, albeit at an average cost of $26.96 CDN (this includes a purchase in our daughter’s TFSA in mid-2016 which has driven up the average price relative to that reflected in the Google Finance graph provided at the beginning of this post) vs. the current market price of ~$48.40 CDN or ~$36.90 USD. Given the sub 1.50% dividend yield, I clearly did not buy it for the dividend. I acquired BAM for what I perceive to be wonderful long-term growth prospects.
On a final note, we need to make a 2017 contribution to our daughter’s TFSA. I will likely purchase more BAM shares (TSX listed shares) within the next 30 days.
Disclaimer: I have no knowledge of your individual circumstances and am not providing individualized advice or recommendations. I encourage you not to make any investment decision without conducting your own research and due diligence, and consulting your financial advisor about your specific situation.
Disclosure: I am long BAM.a, BPY.un, BBU.un
I wrote this article myself and it expresses my own opinions. I am not receiving compensation for it and have no business relationship with any company whose stock is mentioned in this article.