Contents
When I wrote my April 20, 2024 Intuitive Surgical (ISRG) post, shares were trading at ~$366. In that post, I note that it was my 15th largest holding when I completed my 2023 Year End FFJ Portfolio Review at which time shares were trading at ~$337.
The appreciation in ISRG's share price coupled with some changes made for tax planning purposes resulted in ISRG being my 7th largest holding when I completed my 2024 Mid Year FFJ Portfolio Review; the share price at the end of June was ~$445.
In the past several ISRG posts (accessible through the Archives section of this site) I conclude that ISRG is overvalued.
As I compose this post, we now have ISRG's Q2 and YTD2024 results that were released on July 18. The company continues to post strong results but now the share price is ~$461.
ISRG's share price has increased ~$124 or 36.8% from when I completed my 2023 Year End FFJ Portfolio Review. Has the value of the company legitimately increased to such an extent in such a short time frame?
Let's have a quick look.
Business Overview
Please review the company's website and FY2023 Form 10-K if you are unfamiliar with the company.
The Q2 2024 Form 10-Q also contains a wealth of information. The following is extracted from the Form 10-Q.
We generate up-front revenue from the placement of da Vinci systems through sales or sales-type lease arrangements and recurring revenue over time through fixed-payment or usage-based operating lease arrangements. We also earn recurring revenue from the sales of instruments, accessories, and services.
The da Vinci surgical system generally sells for between $0.7 million and $3.1 million, depending on the model, configuration, and geography, and represents a significant capital equipment investment for our customers when purchased. Our instruments and accessories have limited lives and will either expire or wear out as they are used in surgery, at which point they need to be replaced. We generally earn between $800 and $3,600 of instruments and accessories revenue per surgical procedure performed, depending on the type and complexity of the specific procedures performed and the number and type of instruments used. We typically enter into service contracts at the time systems are sold or leased at an annual fee between $80,000 and $225,000, depending on the configuration of the underlying system and the composition of the services offered under the contract. Our system sale arrangements generally include a five-year period of service, with the first year of service provided for free. These service contracts have generally been renewed at the end of the initial contractual service periods.
We generate revenue from our Ion endoluminal system in a business model consistent with the da Vinci surgical system model described above. We generate up-front revenue from the placement of Ion systems through sales or sales-type lease arrangements and recurring revenue over time through fixed-payment or usage-based operating lease arrangements. We also earn recurring revenue from the sales of instruments, accessories, and services. The Ion endoluminal system generally sells for between $500,000 and $675,000. Our instruments and accessories have limited lives and will either expire or wear out as they are used in procedures, at which point they need to be replaced. We typically enter into service contracts at the time systems are sold or leased at an annual fee between $55,000 and $70,000.
Additionally, as part of our ecosystem of products and services, we provide a portfolio of learning offerings and digital solutions. We do not currently generate material revenue from these offerings.
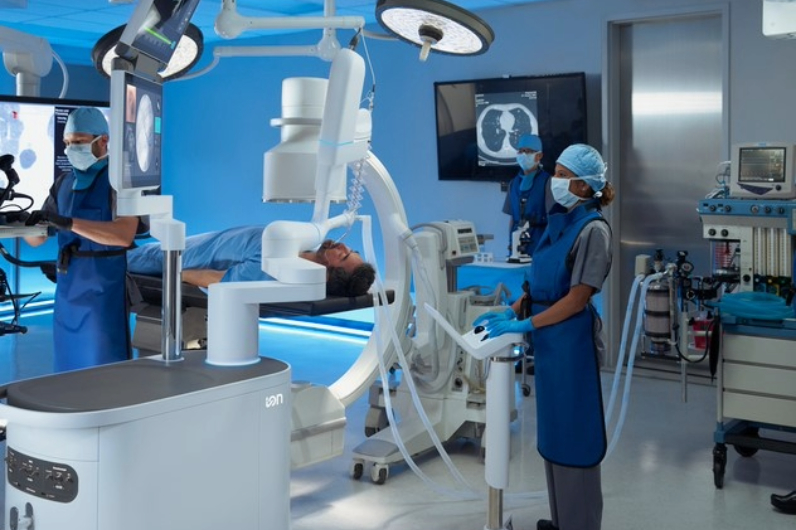
Recent statistics reflect that a significant number of medical procedures are being performed using ISRG's various systems.
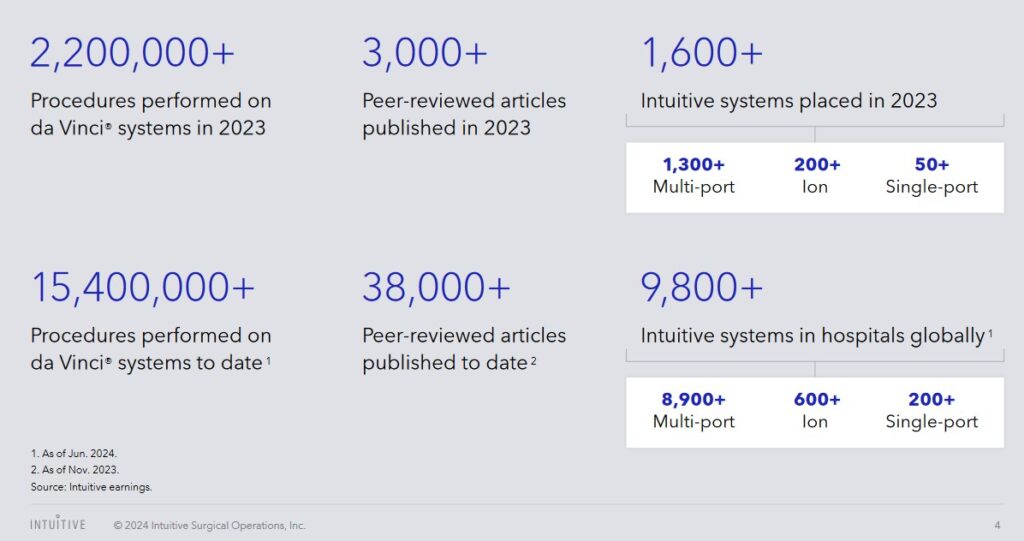
Source: ISRG - Q2 2024 Earnings Presentation
Financials
Q2 and YTD2024 Results
ISRG's Q2 and YTD2024 results are accessible in the Form 8-K and Form 10-Q (refer to the SEC Filings).
In previous quarters, ISRG provided a wealth of information in its Financial Data Tables. The following table, for example, shows details for several consecutive quarters. 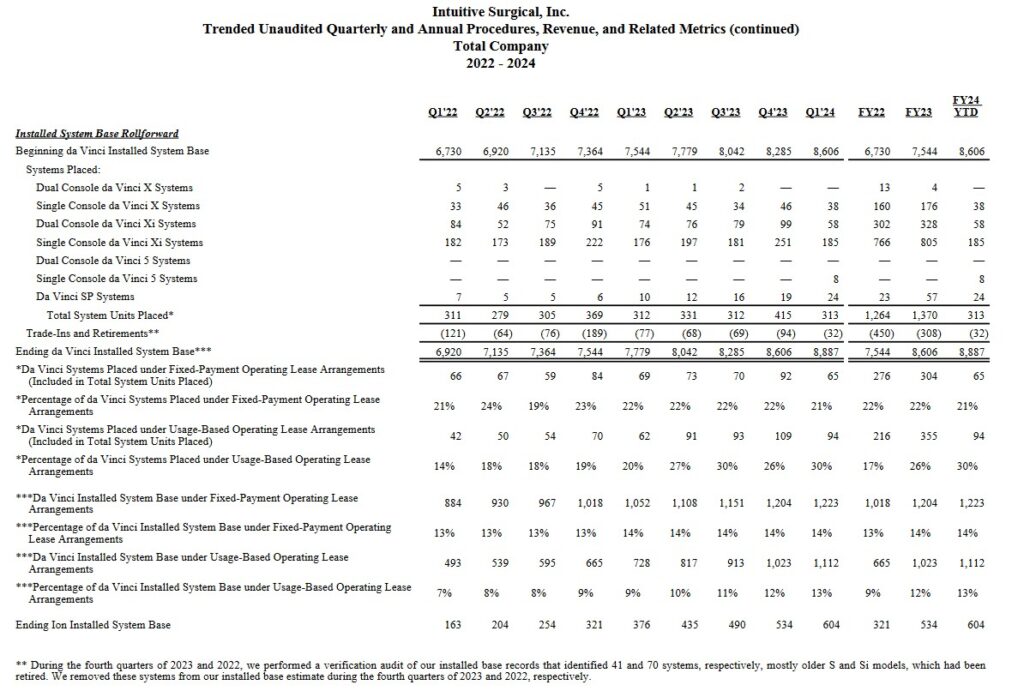 Searching through the company's website, I am no longer able to locate this information. Instead, the Q2 Form 10-Q merely provides information in this manner.
 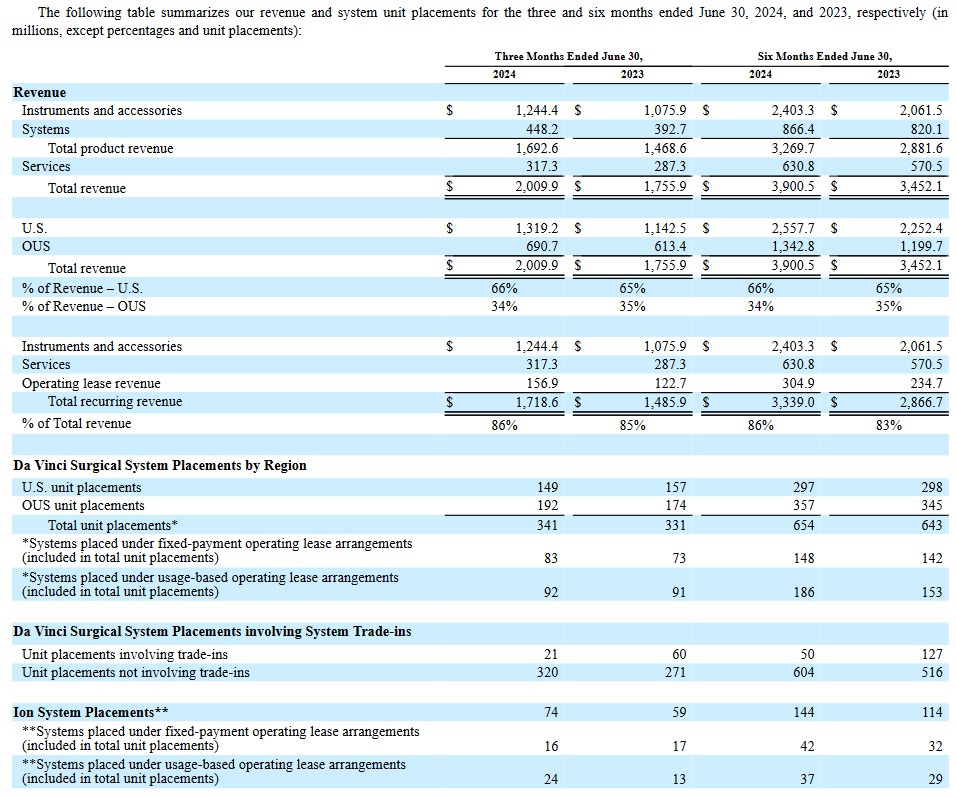 In Q2 2024, procedure growth was 17% compared to 22% for Q2 2023 and 16% in Q1 2024.
In the U.S., Q2 2024 procedure growth was 14% compared to 19% for Q2 2023 and 14% Q1 2024. Growth was led by procedures within general surgery, with strength in cholecystectomy and foregut procedures and also thoracic procedures. Bariatric procedure growth declined in the mid-single-digit range.
Outside of the U.S., Q2 2024 procedure volume grew 22% versus with 28% for Q2 2023 and 20% in Q1 2024. Growth was led by non-urology procedures with strength in colon resection, hysterectomy and lung resection procedures.
In Europe, Q2 growth continued to be led by procedures beyond urology primarily from general surgery and gynecology procedure categories. Germany, the U.K. and Italy procedure performance led the region with each experiencing strong growth in colon and rectal resection, hysterectomy and other general surgery procedures.
Growth in Asia in Q2 was led by Japan and India. Growth in China, however, was stressed and Korea procedure growth continued to be impacted by physician strikes.
In Japan, overall procedure growth experienced continued strength in colon and rectal resection, gynecology and lung resection procedures.
In India where ISRG's products are still in the early stage of adoption, there was strength in gynecology and general surgery procedures, particularly with growth in hysterectomy, cholecystectomy and hernia repair.
China procedure growth was lower than prior period averages. System utilization remains strong while capital placements continue to be impacted by delayed tenders and emerging domestic robotic systems.
ISRG continues to prioritize investments in R&D to fund innovation and future growth.
In Q2, it added ~550 employees, of which roughly half were in manufacturing operations to support growth in customer demand.
Operating Cash Flow (OCF), CAPEX, and Free Cash Flow (FCF)
In the FY2014 - FY2023 time frame, ISRG's:
- OCF was (in B$) 0.665, 0.806, 1.087, 1.144, 1.170, 1.598, 1.485, 2.089, 1.491, and 1.814.
- CAPEX was (in B$) 0.106, 0.081, 0.054, 0.191, 0.187, 0.426, 0.342, 0.340, 0.532, and 1.064.
- FCF was (in B$) 0.560, 0.725, 1.033, 0.953, 0.982, 1.173, 1.143, 1.750, 0.958, and 0.750.
The Q2 2024 Consolidated Statement of Cash Flows reflects ~$0.886B of OCF, ~$0.551B of CAPEX thus giving us ~$0.335B of FCF. In addition to generating impressive OCF and FCF, ISRG invested $0.671B, $0.879B, $1B and $0.565B in R&D in FY2021 - 2023 and the first half of FY2024.
ISRG is investing heavily for future growth. What is truly impressive is that it does not need to rely on debt to fuel this growth.
Return On Invested Capital (ROIC)
ISRG's ROIC (%) in FY2014 - FY2023 is 12.17, 15.3, 14.58, 12.57, 19.78, 18.46, 10.24, 15.05, 11.31, and 13.3.
High quality companies often generate a high ROIC. If a company generates a high ROIC, it needs to invest less to achieve a certain growth rate thus reducing the need for external capital.
A company that generates $0.15/profit for every $1 invested, for example, achieves a ROIC of 15%. I consider a ~15%+ ROIC to be a reasonable minimum threshold because most of the time, a company's cost of capital will be lower than this level. ISRG's ROIC often falls short of this level but there are a sufficient number of 'positives' that I am willing to make an exception in this case.
When a company consistently generates a high ROIC over the long term and it is growing its revenue, it can reinvest a portion of its profits under favorable conditions thereby leading to a compounding effect. I would much rather invest in a growing company that can reinvest to create greater shareholder value than to invest in a company that has limited growth opportunities and thus chooses to distribute a growing dividend.
FY2024 Outlook
ISRG has increased its pro forma gross profit margin to 68.5% - 69% of net revenue versus the prior forecast of 67% - 68% of net revenue; the actual gross profit margin will vary quarterly depending largely on product, regional and trade-in mix and the impact of new product introductions.
Given recent and ongoing capital investments, ISRG expects:
- depreciation expense to increase in the second half; and
- a significant increase starting in Q1 2025.
Guidance for pro forma operating expense growth has been lowered to 10% - 13% versus the prior 11% - 15%.
FY2024 noncash stock compensation expense is now $0.68B - $7B versus the prior $0.68B - $0.71B.
Guidance for other income, comprised mostly of interest income, is now $0.3B - $0.32B versus the prior $0.29B - $0.32B.
The FY2024 CAPEX forecast remains unchanged at $1B - $1.2B (primarily for planned facility construction activities).
There is no change to the FY2024 pro forma income tax rate of 22% and 24% of pretax income.
Insider Sales/Purchases
Some investors pay close attention to insider purchases/sales under the assumption a company's leadership knows best when to buy and sell stock in their firms. These transactions can, however, be misinterpreted and particularly when it comes to selling shares.
Looking at Item 5 - Other Information Rule 10b5-1 Plans on page 50 of 56 in the Q2 Form 10-Q, we see the adoption of a Rule 10b5-1 trading plan by several executives. These executives have entered into the trading plan for the purpose of potentially selling shares during an open insider trading window.
Their intent to sell shares does not necessarily mean they expect the stock price to fall. An insider, for example, may sell a large number of shares for various reasons.
If we look at the Schedule 14A - Proxy Statement filed on March 8, 2024 in the SEC Filings section of the company's website, we see that the potential sale of ISRG shares pale in comparison to the number of shares some of these executives hold.
I have, therefore, no concern that these senior executives or Board members intend to sell a few thousand shares.
NOTE: An explanation of a 10b5-1 plan is accessible here.
Credit Ratings
No rating agency rates ISRG because it has no debt.
Dividend and Dividend Yield
ISRG does not distribute a dividend.
The weighted average number of diluted shares outstanding in FY2013 - FY2023 (in millions) is 339, 341, 354, 349, 356, 358, 361, 366, 362, and 357.4. ISRG repurchased no shares in Q1 and Q2 2024 to offset the issuance of common stock relating to employee stock plans. As a result, the weighted average number of diluted shares outstanding in Q1 and Q2 2024 rose to 360.5 and 361. There is currently a remaining authorization to repurchase $1.1B of shares.
Option Trade Potential
A case could be made for writing short term out of the money covered calls. If I were to write four $470 August 26 contracts (equals 400 shares) I could potentially generate a ~$7.60 in premium per share for a total of $3,040. A covered call with the same expiry but a $480 strike price could potentially generate a ~$4.90 in premium per share for a total of $1,960.
If I am concerned that ISRG's share price is likely to drop, I could buy an August 26 put with a $460 strike price but I would have to shell out ~$9.20/share or ~$3,680.
NOTE: All these values are prior to any fees.
I do not, however, have any interest in executing any option trades for the following reasons:
- I know I will end up checking on ISRG's share price behavior several times a day while the contracts are outstanding (what a waste of time!);
- The amount of premium I could generate would be immaterial given that I would not even consider writing more than 4 contracts;
- Any premium income will incur a tax liability since I hold shares in a taxable account (I pay enough tax as it is);
- I WANT ISRG's share price to plummet given my desire to add to my exposure.
Valuation
FY2011 - FY2023 PE ratios based on GAAP earnings are 40.02, 30.69, 22.97, 46.20, 37.72, 34.17, 47.07, 72.02, 53.69, 93.18, 77.44, 70.38, and 79.38. At the time of my January 24 post, I anticipated revisions to broker estimates over the coming days. The forward-adjusted diluted PE estimates using the current ~$370 share price, however, were:
- FY2024 - 26 brokers - ~59 based on a mean of $6.29 and low/high of $5.96 - $6.76.
- FY2025 - 21 brokers - ~50 based on a mean of $7.36 and low/high of $6.76 - $8.34.
- FY2026 - 14 brokers - ~43 based on a mean of $8.63 and low/high of $7.84 - $10.12.
When I wrote my April 20, 2024 post, ISRG shares traded at ~$366. I anticipated revisions to broker estimates over the coming days but based on the estimates at the time of my post, the forward-adjusted diluted PE estimates were:
- FY2024 - 26 brokers - ~58.4 based on a mean of $6.27 and low/high of $5.96 - $6.58.
- FY2025 - 26 brokers - ~50 based on a mean of $7.34 and low/high of $6.87 - $7.76.
- FY2026 - 18 brokers - ~42.6 based on a mean of $8.60 and low/high of $7.85 - $9.29.
Shares now trade at ~$461 as I compose this post. Once again, I anticipate revisions to broker estimates over the coming days. For now, however, the forward-adjusted diluted PE estimates are:
- FY2024 - 26 brokers - ~70.3 based on a mean of $6.56 and low/high of $6.21 - $6.75.
- FY2025 - 27 brokers - ~60.7 based on a mean of $7.60 and low/high of $7.16 - $8.01.
- FY2026 - 21 brokers - ~52.0 based on a mean of $8.86 and low/high of $8.28 - $9.56.
ISRG's valuation based on forward-adjusted diluted earnings estimates is 'off the charts'.
In FY2014 - FY2023, its P/FCF metrics were 28.83, 30.10, 24.67, 38.78, 48.70, 51.01, 69.60, 60.96, 59.72, and 59.53. In the first half of FY2024, it has generated ~$0.335B of FCF. If ISRG were to generate $1B of FCF in FY2024 and the weighted average number of diluted shares outstanding in FY2024 ends up being ~361 million, we get $2.77 of FCF/share. Using the current ~$461 share price, the P/FCF is ~166.
As much as I would like to increase my exposure, I do not like Intuitive Surgical's lofty valuation. I am not, therefore, adding to my current exposure of 450 shares held in a Core account within the FFJ Portfolio.
Final Thoughts
My thoughts on ISRG remain the same from those presented in recent previous posts.
ISRG has ~$4.8B of cash and cash equivalents and short-term investments and ~$3B of liquid long-term investments; it could eliminate 100% of its total liabilities and still have a few billion dollars of available liquidity.
Some companies may have billions of liquidity but much of this liquidity might be offset by deferred revenue (customers have prepaid for services to be rendered). ISRG's short-term deferred revenue is less than $0.434B and less than $0.045B is long-term deferred revenue (reflected in other long-term liabilities).
I also see nothing on the horizon that suggests it will be unable to continue to generate profitable growth and very strong OCF and FCF.
ISRG may not appeal to some investors because it does not distribute a dividend. Focusing exclusively on dividend metrics, however, can lead to poor investment decisions. A preferable way to look at an investment is the potential total investment return (don't forget the risk aspect of an investment!).
Since ISRG distributes no dividend it means 100% of any investment return will need to come from capital appreciation. It is, therefore, imperative we pay particularly close attention to valuation; disregarding valuation can often lead to unpleasant consequences.
No investor makes a perfect investment decision 100% of the time. We should, however, at least stack the odds of a favorable outcome in our favor.
I wish you much success on your journey to financial freedom!
Note: Please send any feedback, corrections, or questions to [email protected].
Disclosure: I am long ISRG.
Disclaimer: I do not know your circumstances and do not provide individualized advice or recommendations. I encourage you to make investment decisions by conducting your own research and due diligence. Consult your financial advisor about your specific situation. I wrote this article myself and it expresses my own opinions. I do not receive compensation for it and have no business relationship with any company mentioned in this article.