Despite Walmart (WMT) being my 3rd largest holding when I completed my 2024 Mid Year FFJ Portfolio Review, I do not actively follow it. In fact, the last time I analyzed WMT was in my June 29, 2021 guest post at Dividend Power.
What I like about WMT is that I do not worry about credit risk. I merely focus on its valuation based on how I envision it is likely to perform in the future.
Over the years, I have acquired WMT shares and currently hold 1,326 shares in a ‘Core’ account and 1,298 shares in a ‘Side’ account in the FFJ Portfolio.
I have, however, had WMT exposure since August 1999 when I initiated a position in one of our retirement accounts; I hold a larger number of shares with a sub $16 average cost in the retirement account.
The average annual total return on the shares held in my retirement account is ~8%. This return is not impressive when compared to several of my other holdings. Applying the rule of 72, however, I have essentially doubled my investment every 9 years. This is acceptable considering the low risk it presents.
With the release of Q2 and YTD results on August 15, 2024, I revisit this existing holding to determine if this is an opportune time to add to my exposure.
Business Overview
WMT needs no introduction. If you are unfamiliar with the company, however, please read Part 1 Items 1 and 1A in the FY2024 Form 10-K.
The store units and square footage metrics provide an indication of just how massive WMT is. Despite the extent of its global presence, WMT has ample opportunity to expand its operations!
Financials
Q2 and YTD2025 Results
WMT’s Q2 material is accessible here. The Form 10-Q is unavailable as I compose this post. When it becomes available, it will be accessible in the SEC Filings section of WMT’s website.
Unlike many other retailers, WMT is not experiencing a weaker consumer overall. Management attributes this to customers wanting:
- value;
- a broad assortment of items and services;
- a convenient and enjoyable experience; and
- to do business with a company they trust.
Operating Cash Flow (OCF), Free Cash Flow (FCF), and CAPEX
In FY2017 – FY2024, OCF, CAPEX, and FCF were:
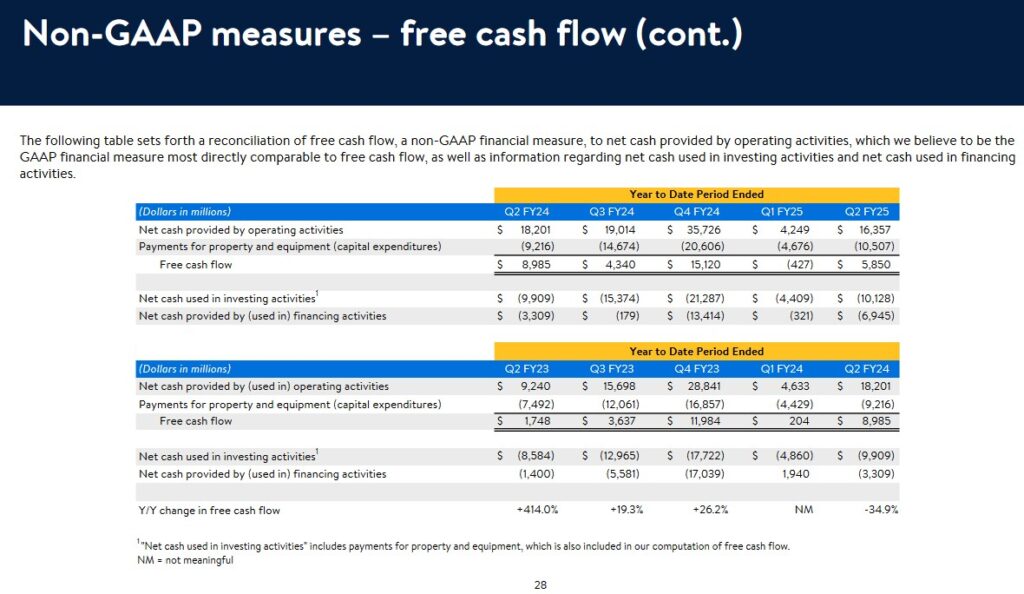
- OCF was (in B$) 31.67, 28.34, 27.75, 25.26, 36.07, 24.18, 28.84, and 35.73. In the first half of FY2025, OCF is 16.4.
- CAPEX was (in B$) 10.62, 10.05, 10.34, 10.71, 10.26, 13.11, 16.86, and 20.61. In the first half of FY2025, CAPEX is 10.5.
- FCF was (in B$) 21.05, 18.29, 17.41, 14.55, 25.81, 11.07, 11.98, and 15.12. In the first half of FY2025, FCF is 5.9.
The following reflects WMT’s YTD FCF for Q2 2023 – Q2 2025.
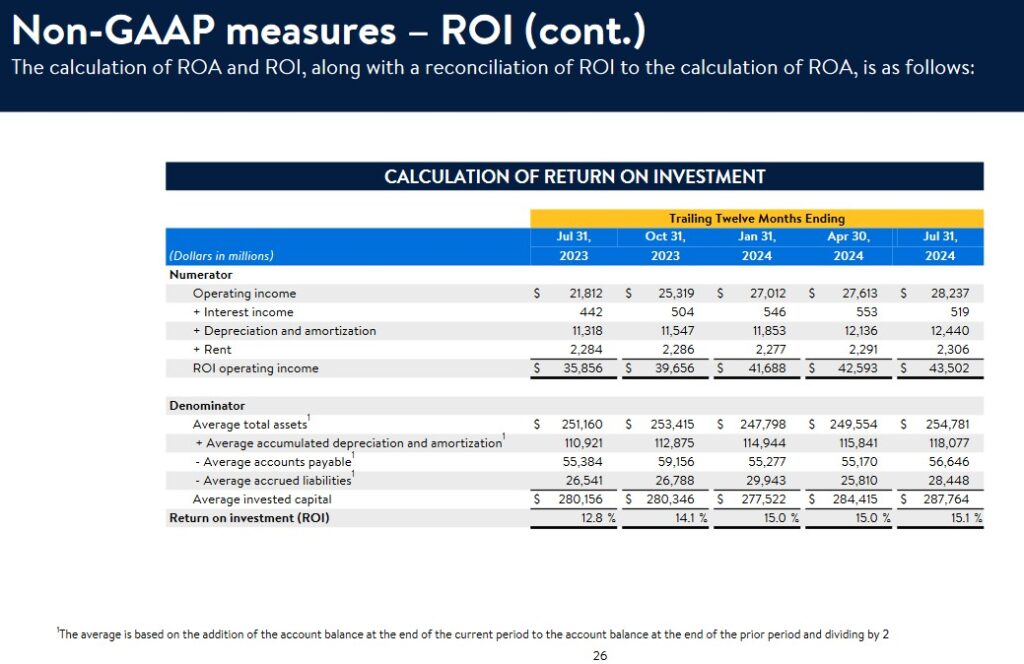
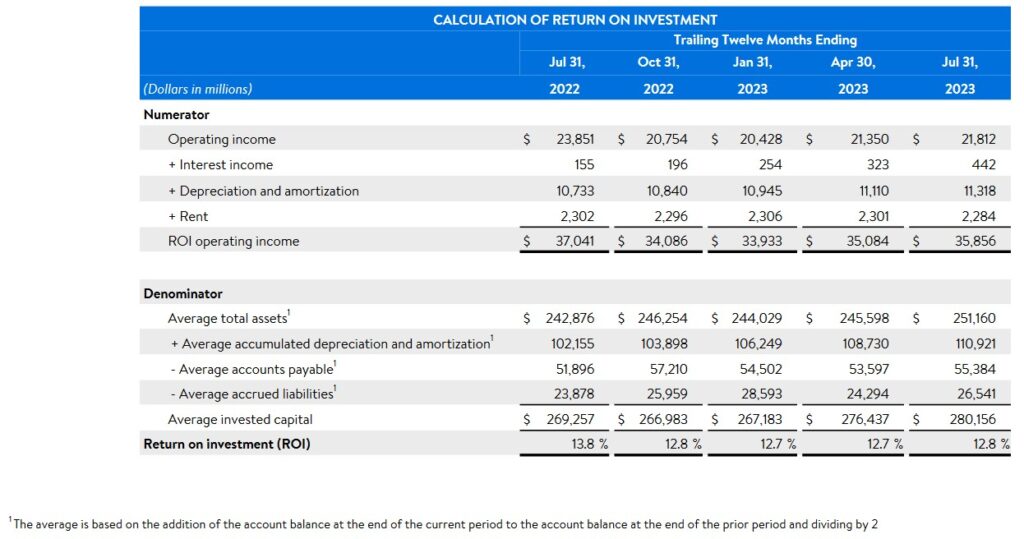
Return On Invested Capital (ROIC)
High quality companies often generate a high ROIC. If a company generates a high ROIC, it needs to invest less to achieve a certain growth rate thus reducing the need for external capital.
When a company consistently generates a high ROIC over the long term and it is growing its revenue, it can reinvest a portion of its profits under favorable conditions thereby leading to a compounding effect. I would much rather invest in a growing company that can reinvest to create greater shareholder value than to invest in a company that has limited growth opportunities and thus chooses to distribute a growing dividend.
A company that generates $0.15/profit for every $1 invested, for example, achieves a ROIC of 15%. I consider a ~15%+ ROIC to be a reasonable minimum threshold because most of the time, a company’s cost of capital will be lower than this level.
Capital Allocation
Share repurchases and dividend distributions are important. WMT’s priority, however, is to reinvest in the business. On the Q2 earnings call, management states:
By leveraging our scale as a global enterprise, we’re finding savings in supplies, transportation, storage, third-party service contracts and various other expense categories. In other areas, we’re maximizing the utilization of our assets and using tech to streamline our operational processes. Together, these efforts translate into meaningful savings. We’re also making good progress on our supply chain transformation and we’re seeing the direct benefits to customer experience.
In Walmart U.S., more than 45% of our eCommerce fulfillment center volume is now automated, and we have about 1,800 stores receiving some level of freight from 15 of our regional distribution centers that are in varying stages of automation implementation. And as a result, our supply chain teams are processing more units through our DCs and FCs. And while we’re spending more on CapEx than we have historically, we’re pleased with the returns from these investments, particularly the automation of our supply chain.
We expect these investments to yield returns that will allow us to increase our return on invested capital each year.
The annual CAPEX levels reflected earlier in this post are a testament to the extent to which WMT is reinvesting in the business to remain a dominant force in the retail sector.
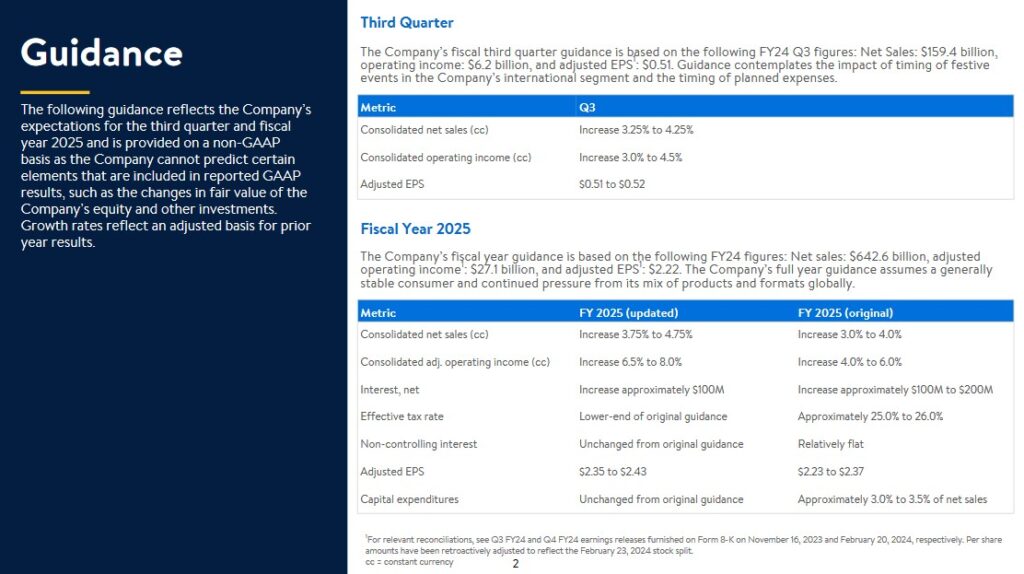
FY2025 Guidance
Several retailers are reporting weak results and some are filing for creditor protection or are simply closing operations. WMT, however, is increasing guidance on some of its metrics!
Risk Assessment
Some investors fixate on an investment’s potential return and overlook the various risk aspects of the investment to their detriment. This is why I strongly encourage investors to read the ‘Risks’ section of a company’s Form 10-K.
While I try to assess a company’s risk, I also look at how the rating agencies perceive the company’s risk.
WMT’s current domestic long-term unsecured debt ratings and outlook are:
- Moody’s: Aa2 (stable) last reviewed October 13, 2023.
- S&P Global: AA (stable) last reviewed May 20, 2024.
- Fitch: AA (stable) last reviewed June 28, 2024.
All 3 ratings are the middle tier of the high-grade investment-grade category.
These ratings define WMT as having a very strong capacity to meet its financial commitments. It differs from the highest-rated obligors only to a small degree.
Dividend and Dividend Yield
WMT’s dividend history reflects a $0.21/share quarterly dividend – down from the prior $0.57/share. Investors, however, must consider that WMT declared a 3 for 1 stock split in February 2024.
In the fiscal year ending January 31, 2014 and January 31, 2024, the weighted average shares outstanding was ~9.849B and ~8.108B. In Q2 2024, this had been reduced to 8.081B.
WMT repurchases shares of its common stock under share repurchase programs authorized by the Board. All repurchases made during FY2024 were made under the current $20.0B share repurchase program approved in November 2022, which has no expiration date or other restrictions limiting the period over which it can make repurchases.
As of January 31, 2024 authorization for $16.5B of share repurchases remained under the share repurchase program. As of April 30, 2024, authorization for $15.5B of share repurchases remained under the share repurchase program.
The Q2 Form 10-Q provides share repurchase information but is unavailable as I compose this post on August 16. Looking at the Condensed Consolidated Statements of cash Flows, however, we see that WMT repurchased $1.013B of its shares in Q2.
Valuation
WMT’s FY2025 outlook calls for non-GAAP EPS of ~$2.35 – $2.43. Using the current ~$73.40 share price, the forward adjusted diluted PE is ~30.2 – ~31.2.
Its valuation using the current broker guidance, which is likely to be adjusted slightly over the coming days as analysts update their estimates, is:
- FY2025 – 36 brokers – mean of $2.44 and low/high of $2.36 – $2.58. Using the mean, the forward adjusted diluted PE is ~30.1.
- FY2026 – 36 brokers – mean of $2.70 and low/high of $2.58 – $2.89. Using the mean, the forward adjusted diluted PE was ~27.2.
- FY2027 – 17 brokers – mean of $2.98 and low/high of $2.50 – $3.26. Using the mean, the forward adjusted diluted PE was ~24.6.
WMT has generated FCF of ~$5.9B in the first half of FY2025. Let’s be generous and estimate it will generate ~$14B of FCF in FY2025. Furthermore, let’s assume the weighted average shares outstanding for the year declines to 7.9B. This gives us ~$1.77 of FCF/share or a P/FCF of ~41.5.
If WMT were to generate ~$12.5B of FCF and the weighted average shares outstanding for the year were to decline to 8B, we get ~$1.56 of FCF/share. The P/FCF jumps to ~47.1.
I have been a shareholder for ~25 years and do not recollect WMT being this overvalued in a very long time!
Final Thoughts
WMT is such a huge company and its annual operating margin is so low (generally under 4.5%) that it is virtually impossible for it to generate an average annual total investment return that rivals some of my other holdings.
In general, I avoid investing in retailers. WMT, however, is an exception as it does not give me cause for concern. I am, therefore, prepared to increase my exposure when I deem its valuation to be reasonable; WMT’s valuation does not currently appeal to me.
If WMT’s share price were to drop to an arbitrarily selected ~$65, its valuation based on a $2.44 forward adjusted diluted EPS would be ~26.6. This level is still elevated. We need to consider, however, that this is a high quality company that exhibits steady growth even when many other retailers experience weak operating results.
Furthermore, WMT is very rarely on sale. Insisting on acquiring WMT shares when its forward adjusted diluted PE is sub ~22, for example, could lead to a very long wait. In my experience, paying up for quality typically leads to better investment returns than investing in inferior quality companies with attractive valuation metrics.
WMT’s valuation on a P/FCF basis using a ~$65 share price gives us a P/FCF of ~36.7 ($65/$1.77). This metric could improve if WMT were to scale back its annual CAPEX. This, however, is unlikely to occur in the foreseeable future. It is purposely spending more on CAPEX than it has historically because the returns from these investments, particularly the automation of its supply chain, are expected to yield returns that will allow it to increase its ROIC each year.
I wish you much success on your journey to financial freedom!
Note: Please send any feedback, corrections, or questions to finfreejourney@gmail.com.
Disclosure: I am long WMT.
Disclaimer: I do not know your circumstances and do not provide individualized advice or recommendations. I encourage you to make investment decisions by conducting your research and due diligence. Consult your financial advisor about your specific situation.
I wrote this article myself and it expresses my own opinions. I do not receive compensation for it and have no business relationship with any company mentioned in this article.