 Summary
- This TELUS Corporation stock analysis is based on Q1 2017 financial results and 2017 projections released May 11, 2017.
- TELUS reported industry-leading consolidated revenue and EBITDA growth of 2.9% and 6.4% respectively.
- Updated industry-leading 2017 targets reflect higher revenue and EBITDA of up to 4% and 7% respectively.
- The quarterly dividend, payable July 4, 2017, has been increased from $0.48 to $0.4925.
- TELUS represents a worthwhile long-term investment for conservative investors.
All dollar values in this article are in Canadian Dollars (CDN) unless otherwise noted.
Introduction
This post is a follow-up to my April 10, 2017 TELUS Corporation – A Solid Long-Term Investment at Current Levels post. In that post I postulated that shares were reasonably valued and suggested investors with a long-term investment time horizon look at adding or increasing their position.
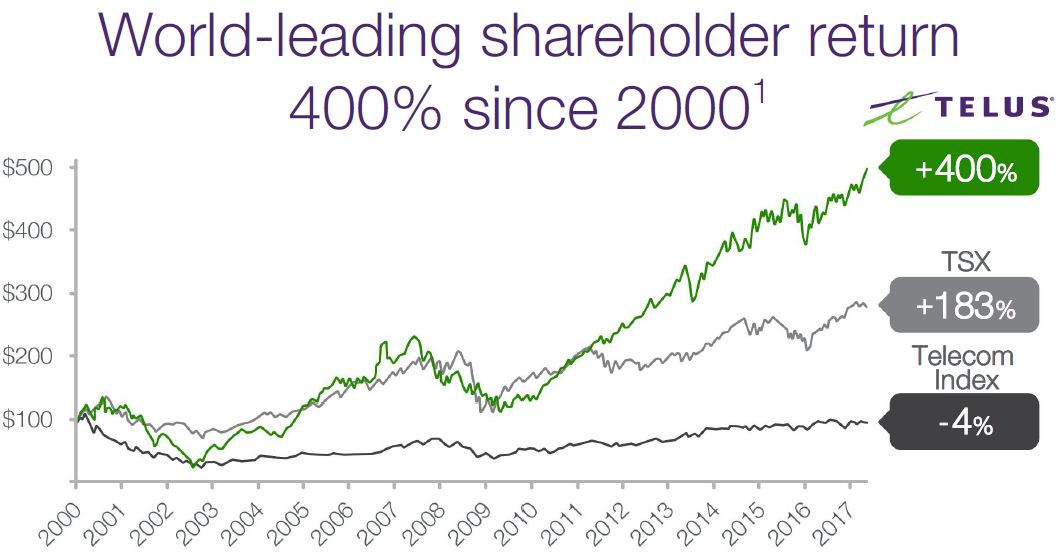
TELUS – World Leading Shareholder Returns – May 11 2017 AGM
Under the “Final Thoughts” segment of that post, I indicated I had initiated a position in TELUS Corporation (TSX: T) (NYSE: TU) by acquiring 200 shares (the TSX listed shares); this was done through one of our Registered Retirement Savings Plan accounts. I have subsequently acquired another 270 TU shares (the TSX listed shares) in early May. The most recent purchase was for our FFJ Portfolio.
Q1 2017 Financial Results
On May 11, 2017, TU held its 2016 Annual General Meeting and released its Q1 2017 results. The Press Release and Supplemental Investor Information can be found here.
I also provide the following snapshot of TU’s Q1 2017 and 2016 results and consolidated financial results for the last few years for reference purposes.
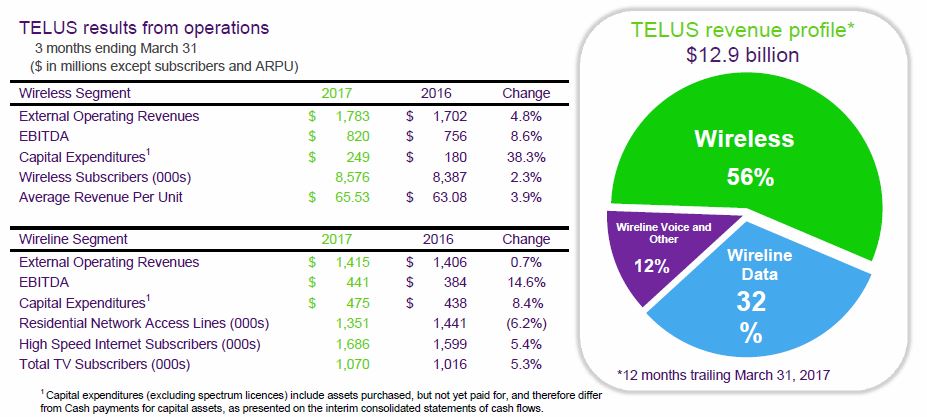
TELUS Q1 2017 Results from Operations
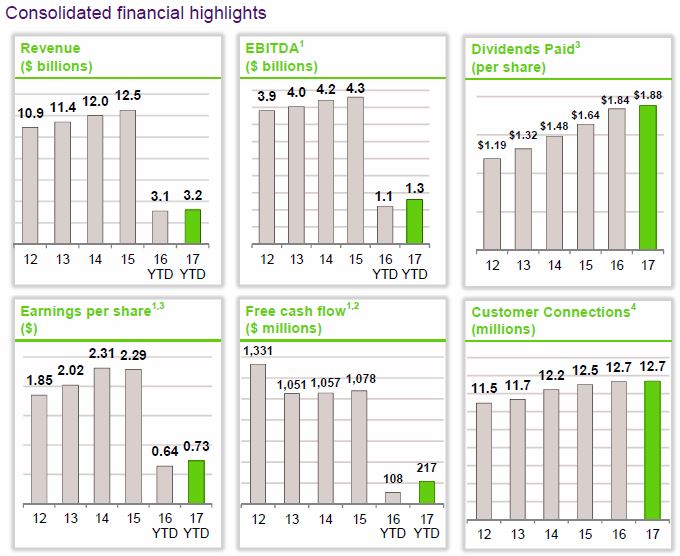
TELUS – Consolidated Financial Results
TU is making significant upgrades to its infrastructure. In addition, it very recently significantly expanded its presence in Manitoba. This includes the acquisition of more than 100,000 residents in Manitoba (approximately one-quarter of Bell MTS’ postpaid wireless customers) and 15 dealer locations; the transaction was valued at approximately $0.3B. This followed the completion of BCE’s acquisition of MTS.
TELUS’ Debt Levels
I have read recent blogs expressing concern about TU’s debt levels and I think these concerns are unfounded. The following is a debt analysis chart comparing the 4 major players (BCE Inc. (NYSE:BCE), Shaw Communications (NYSE:SJR), Rogers Communications (NYSE:RCI)), within the Canadian telecom industry. TU’s results do not appear to be exceedingly different from its major Canadian competitors.
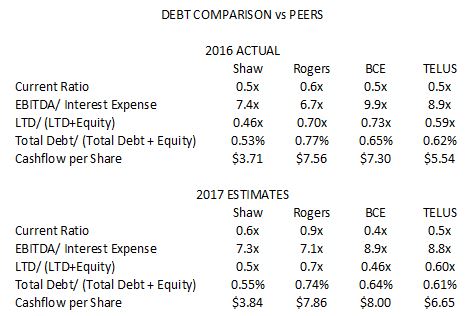
TELUS – Debt Comparison vs Peers
Source: Scotiabank Global Banking and Markets May 11 2017 Company Snapshots
TU operates in a highly capital intensive industry. In fact, TU is reaching a historic milestone for Canada’s 150th Birthday. By the end of 2017, it will have invested more than $150B in operations and infrastructure across Canada since 2000. It will also invest an additional $1.5B in new communications infrastructure and technology across Ontario through 2020, including $0.25B in 2017 alone.
I provided some color on TU’s Credit Ratings and Debt Maturity Schedule in my April 10, 2017 post. I provide additional information to allay any concerns readers may have regarding TU’s debt levels.
On March 6, 2017, TU issued USD $0.5B of senior unsecured notes with a 10.5-year maturity at 3.70% and $0.325B of senior unsecured notes with a 31-year maturity at 4.70%. Proceeds were used to fund the repayment, on maturity, of $0.7B of the principal amount outstanding on TUS’ Series CD Notes due March 2017, to repay a portion of outstanding commercial paper, and for general corporate purposes.
For the U.S. portion of the issuance, TU fully hedged the principal and interest obligations of the notes against fluctuations in the CDN $ fx rate for the entire term of the notes. It entered into fx derivatives (cross currency interest rate exchange agreements) that effectively converted the principal payments and interest obligations to CDN $ obligations with an effective fixed interest rate of 3.41% and an effective issued and outstanding amount of $0.667B (reflecting a fixed exchange rate of $1.3348).
TU’s average term to maturity of L/T debt (excluding commercial paper and the revolving component of the TELUS International (Cda.) Inc. (TELUS International) credit facility) has increased to approximately 11.3 years as at March 31, 2017, from approximately 10.4 years as at December 31, 2016. The weighted average interest rate on L/T debt (excluding commercial paper and the revolving component of the
TELUS International credit facility) decreased to 4.16% as at March 31, 2017, as compared to 4.22% as at December 31, 2016 and 4.32% as at March 31, 2016.
Furthermore, the conditions of TU’s revolving credit facility contains customary covenants, including a requirement that it not permit its consolidated leverage ratio to exceed 4:1 and that the consolidated coverage ratio not be less than 2:1 at the end of any financial quarter.
As at the end of Q1 2017, TU’s consolidated leverage ratio was approximately 2.73:1 and its consolidated coverage ratio was approximately 8.48:1. TU has indicated it fully expects these ratios will remain well above the covenants.
I view the above as positive signs that TU’s creditors are not raising “red flags” regarding TU’s ability to service its obligations.
Valuation
When I suggested TU was fairly valued in my April 10, 2017 post, TU was trading around $44.40 or USD $33.30. TU closed May 11, 2017 at $45.76 or USD $33.42.
On May 11, 2017, TU released the following comparison of its original targets and its revised targets.
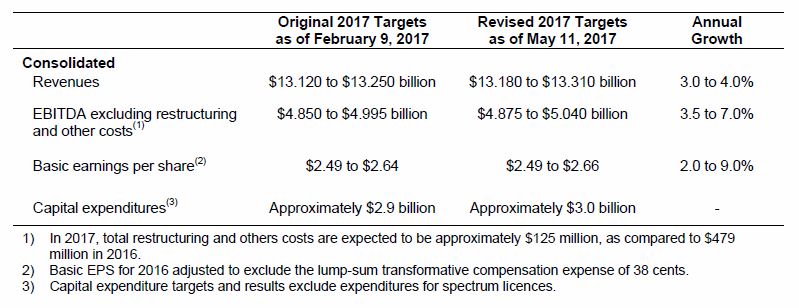
TELUS – Original and Revised 2017 Targets
While management has revised upwards the top of the range from $2.64 to $2.66, I prefer to err on the side of caution. I will, therefore, continue to use the mid-point of $2.57 which was based on the original target range and which I used in my April 10, 2017 post.
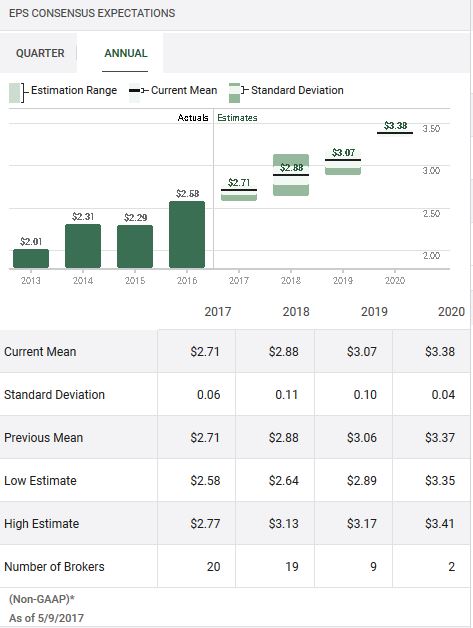
TELUS – TD WebBroker Annual EPS estimate May 9 2017
If I use the current market price of $45.76, I get a PE of ~17.81. This is slightly higher than the 17.2 level reflected in my previous post. The variance, however, is relatively immaterial if you intend to invest in TU for the long-term.
Dividends
On May 11, 2017, TU announced an increase in the quarterly dividend to $0.4925/share payable on July 4, 2017 to holders of record at the close of business on June 9, 2017. This represents a 7.1% increase from the $0.46 quarterly dividend paid on July 4, 2016 and a 2.6% increase from the $0.48 quarterly dividend paid on April 3, 2017. It also marks the 13th dividend increase since 2011.
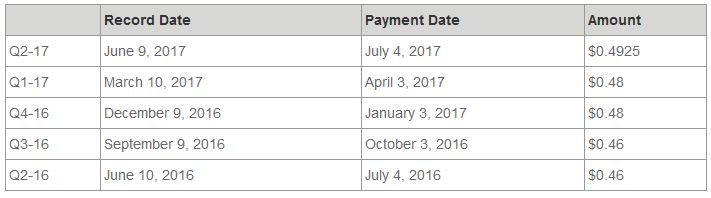
TELUS – Recent Dividend History
TU typically increases its quarterly dividend after every two quarters. If I use the new quarterly dividend of $0.4925 for two quarters and project a quarterly dividend of $0.5025 for the subsequent two quarters, I get an annual forward dividend of $1.99/share. Using the current stock price of $45.76 and the projected annual dividend of $1.99, I get a forward dividend yield of 4.35%. This, in my opinion, is a reasonably attractive dividend yield for a relatively safe investment.
TELUS Corporation Stock Analysis – Final Thoughts
I get the impression many investors are fixated on short-term results. This is borne out by comments to the effect that if a company’s stock price reaches a certainly level, the position will be dramatically reduced or liquidated. While every investor reserves the right to do as they see fit with their money, I decided several years ago that what worked best for me was to try and get a good understanding of a business and the industry in which it operates. This way, I feel more comfortable when investing in a company and it allows me not to panic in the event a company’s stock price turns south. In fact, if the company is solid, I actually hope for a drop in the stock price as it allows me to acquire shares at a more reasonable price.
Having said this, investors certainly have every right to be concerned given the current geopolitical environment and what appears to be another period of “irrational exuberance”. I think, however, that when investing in a company such as TU, one should stop looking out only 6 months to a year. I suggest TU be viewed as an investment to be held for decades. My rationale for this train of thought is that TU is making investments today for which it will reap the benefits many years into the future
Furthermore, investors need to remember that TU operates in a highly regulated industry where barriers to entry are extremely high. In addition, its customer service levels exceed those of its peers as evidenced by its industry-leading wireless postpaid churn of 0.93% (the lower the level the better) combined with strong average revenue per user growth of 3.9% and best-in-class lifetime revenue of $5,550 per client.
I stand by my final comments in my April 10, 2017 post that I am reasonably confident that once TU completes its current capital intensive project to expand its fibre footprint for the purpose of having an effective 5G network, FCF will be substantial. Given this, I am willing to live with slightly elevated debt levels and lower FCF levels for the next few years.
Note: I appreciate the time you took to read this article and hope you got something out of it. As always, please leave any feedback and questions you may have in the “Contact Me Here” section to the right.
Disclaimer: I have no knowledge of your individual circumstances and am not providing individualized advice or recommendations. I encourage you not to make any investment decision without conducting your own research and due diligence, and consulting your financial advisor about your specific situation.
Disclosure: At the time of writing this post I am long TSX: T and TSX: BCE (0.4% and 1.86%) of our overall holdings (not just in the FFJ Portfolio).
I wrote this article myself and it expresses my own opinions. I am not receiving compensation for it and have no business relationship with any company whose stock is mentioned in this article.
Nice article, among Telecomm stocks I see you own AT&T, Verizon. What percentage of your portfolio do they represent. What are your thoughts on the cell tower companies. If I remember correctly American Tower corp just bought a boat load of towers from verizon
Thank you very much.
AT&T represents ~2% and Verizon represents ~0.6% of our overall portfolio.
I don’t know anything about American Tower so I can’t comment. I see it operates as a US REIT. I am a Canadian resident and I shy away from Canadian REITs to begin with; I only own units in Smart REIT (TSX: SRU.UN). Given that American Tower is a US REIT I am not sure if I would ever acquire units in NYSE: AMT.
Given your “LoveMyDividends” handle, I presume you have a blog. I would welcome the opportunity to check it out. Mind sending me the link?
Cheers.