This Stryker Corporation: Dividend Stock Review is a Guest Post by Derek of EngineermyFreedom.com. Derek is an investor and blogger and podcast co-host on dividend growth stocks. He also works as a part-time freelance equity analyst with a leading newsletter in dividend stocks.
Stryker Corporation (SYK) is one of the world’s leading medical technology companies. It offers innovative products and services in Orthopaedics, Medical and Surgical, and Neurotechnology and Spine that help improve patient and hospital outcomes.
The company was incorporated in Michigan in 1946 as the successor company to a business founded in 1941 by Dr. Homer H. Stryker, an orthopedic surgeon, and inventor. It now operates in more than 75 countries and employs more than 40,000 people.
Stryker may not be well known because most of Stryker’s products are marketed directly to doctors, hospitals, and other healthcare facilities with a mission to “Make Healthcare Better”.
As a European Dividend Growth Investor, 60% of my holdings are from US-based companies. This is because companies in the US tend to reward their shareholders with increasing dividends. European companies are more conservative and typically try to keep payout ratios below 40% of free cash flow. This is why dividend cuts are more common with European companies than US companies.
A sustainable and growing dividend is the foundation of my Dividend Growth Strategy. I am, therefore, pleased that Stryker is a dividend champion with 28 years of dividend increases. However, the main questions are:
- Is the dividend sustainable?
- Would I buy Stryker?
Stryker Operating Segments
Stryker operates and reports its financial performance under three segments: Orthopedics, Medical and Surgical (MedSurg), and Neurotechnology and Spine.
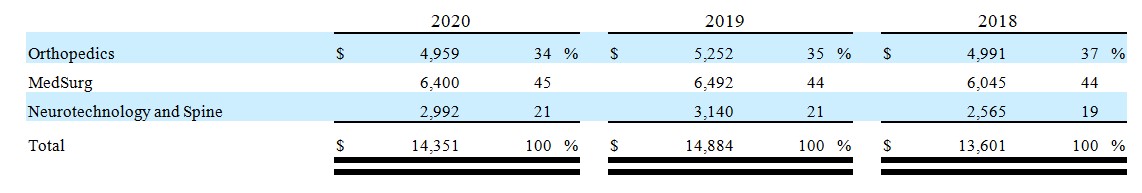
Source: Stryker 2020 10-K, page 3 of 160
Orthopedics
These products consist primarily of implants used in total joint replacements, such as hip, knee, and shoulder, and trauma and extremities surgeries. This segment aims to make orthopedic surgery and recovery simpler, faster, and more effective. This is achieved by using the Mako Robotic-Arm Assisted Surgical System. Mako is the only robotic-arm-assisted technology enabled by 3D CT-based pre-operative planning. This helps surgeons understand their patients’ anatomy and can help cut less bone in preparation for the implant.
According to OECD iLibrary, the main reason for hip and knee replacement is osteoarthritis, which leads to reduced function and quality of life. Osteoarthritis is a degenerative form of arthritis characterized by the deterioration of cartilage that cushions and smooths the movement of joints. My father-in-law who played football into late adulthood has had both his knees and hips replaced due to excessive stress placed on these joints in his playing days. Knee and hip replacements are on the rise over the last decade. This bodes well for Stryker as they constitute 56% of Orthopedics revenue combined.
MedSurg
Medical and Surgical equipment is the second largest segment and consists of 4 sub-sections.
- Instruments -> surgical equipment, patient and caregiver safety technologies, and navigation systems. It generated ~29% of net sales in this segment in FY2020.
- Endoscopy -> endoscopic and communications systems. It generated ~28% of net sales within this segment in FY2020.
- Medical -> patient handling, emergency medical equipment, and intensive care disposable products. This is the largest sub-segment with 39% of net sales in FY2020.
- Sustainability -> reprocessed and remanufactured medical devices. It generated ~4% of net sales in this segment in FY2020.
Neurotechnology and Spine
Neurotechnology and Spine products include neurosurgical, neurovascular, and spinal implant devices.
Stryker’s neurotechnology segment includes products used for minimally invasive endovascular techniques, and products for traditional brain and open skull-based surgical procedures. The Spine segment includes cervical and thoracolumbar systems that include fixation, minimally invasive, and interbody systems used in spinal injury, complex spine, and regenerative therapies.
Growth
On January 27th, 2021, Stryker reported Q4 and FY2021 results.
Income Statement
I start my analysis by looking at the income statement over a 10-year timeframe to review the average Revenue, Net Income, and Earnings Per Share (EPS) growth.
Stryker’s market cap is currently ~$90B and its book-value-per-share is ~$34.50. Revenue has grown from $7.32B in FY2010 to $14.351B in FY2020 for a ~6.9% compound annual growth rate (CAGR). This information is readily available in the Selected Financial Data section in the FY2014 10-K (page 17 of 243) and the FY2020 10-K (page 12 of 160).
During the same timeframe, EPS grew from $3.19 to $4.20 which is a CAGR of 2.79%. Diluted EPS dipped from $4.35 in FY2016 to $2.68 in FY2017 but recovered ~248.5% to $9.34 in FY2018.
The effective income tax rate for 2017 included the impact of complying with the Tax Cuts and Jobs Act of 2017 signed into law in December 2017. This was partially offset by the benefits from the adoption of ASU 2016-09 Stock Compensation improvements to Employee Share-Based Payment Accounting on January 1, 2017, and continued lower effective income tax rates as a result of the European regional headquarters.
The following effective income tax rate on earnings in FY2015 – FY2020 shows the extent to which Stryker benefited from tax planning: 17.1%, 14.3%, 50.6%, (50.8%), 18.7%, and 18.2%. This tax-planning will lower Stryker’s tax burden over a 9-year timeframe.
Operating Margin is a profitability indicator that reflects operating income relative to Net Revenue. A strong operating margin is essential to service fixed costs and debt. Stryker’s FY2020 Operating Margin deteriorated to 15.49% versus 21.21%, 22.12%, 20.82%, 20.74%, 21.69%, 20.6%, 19.85%, 18.82%, and 19.52% in FY2011 – FY2019. Due to COVID-19’s significant negative impact on Stryker’s operations and financial results, the company suspended certain in-process investments. This resulted in charges of $0.195B to impair certain long-lived assets (primarily the portion of Stryker’s investment in a new global ERP system that was in process of being developed for future deployment) and product line and other exit costs in 2020. These charges were included in the cost of sales and selling, general and administrative expenses and explain the dramatic decline in the Operating Margin.
Some of Stryker’s products are particularly sensitive to reductions in elective medical procedures; elective medical procedures were suspended in Q1 2020 in many markets where Stryker sells its products. Stryker’s 63.1% Gross Profit Margin also reflected a dip relative to FY2014 – FY2019 levels: 65.7%, 66.4%, 66.3%, 65.7%, 65.7%, and 65.1%.
Management has indicated that returning to FY2019 elective medical procedure levels is dependent upon the success and efficacy of the COVID-19 vaccines.
Balance Sheet
Stryker’s FY2019 and Fy2020 Balance Sheet can be found on page 24 of 160 in the FY2020 10-K.
in FY2020, Goodwill, Other Net Intangible Assets, Noncurrent Deferred Income Tax Assets, and Other Non-Current Assets amount to ~$21.871B of $34.33B of Total Assets; this is ~63.7% of Total Assets. Based on 380.3 million FY2020 weighted-average shares outstanding, and $12.459B of ‘hard assets’ (exclude ~$21.871B of the aforementioned ‘soft assets’), we get a tangible book value of ~$32.76.
Quite often, a company acquires another company and pays a price exceeding the acquired company’s tangible book value. The acquiring company reflects the difference between the purchase price and tangible book value of the acquired company on its balance sheet as “Goodwill”. When the ‘Goodwill’ component of a company’s Balance Sheet increases over time, it is a signal that the company is in acquisition mode.
The Goodwill/Total Assets ratio amounted to ~37.2% in FY2020 versus ~16.7 in FY2011. We can see Stryker’s acquisition history has been significant in recent years. In 2020, Stryker completed acquisitions for total net cash consideration of $4.222 billion. This included the completion of the Wright Medical acquisition in November 2020 that had been announced in November 2019. Wright’s products are now part of the Trauma and Extremities business within the Orthopedics segment.
Looking at Stryker’s FY2020 Balance Sheet, we see Total Liabilities of ~$21.246 versus Total Shareholder Equity of ~$13.084. This gives us a Total Debt/Equity ratio of ~162%.
When this ratio exceeds 1, I check the interest coverage and the Net Debt/ EBITDA. Interest coverage determines the extent to which a company can service the interest on its outstanding debts. The Net Debt/ EBITDA ratio reflects the time a company needs to operate at its current Net Debt/EBITDA level to pay all its debt. I typically like to see an interest coverage ratio above 4 and a Net Debt/ EBITDA ratio below 3. Interest Coverage is currently above 9 and the Net Debt/ EBITDA is 3.71.
My main concern is the high appetite for M&A activity as the ~$4B Wright Medical acquisition follows ~$2.5B of other M&A in the last two years. This has increased the net debt/EBITDA and the amount of goodwill on the balance sheet. However, the FYE2020 ~1.93:1 current ratio, high-interest coverage, over $2B cash, a $1.5B revolving credit facility that expires in August 2023, and a $1.5B unsecured revolving credit facility that matures in April 2021 give me comfort that Stryker can continue to meet its obligations.
I view Stryker’s balance sheet as acceptable.
Risk Assessment
On January 7, 2021, Moody’s re-affirmed Stryker’s Baa1 senior unsecured and issuer ratings revised the outlook from negative to stable. Moody’s expects the longer-term demand for medical devices to continue to rise. Moody’s was impressed by Stryker’s progress in key investment areas such as the strong growth in the Mako robotic platform.
Moody’s expects Stryker is to allocate a meaningful portion of Free Cash Flow (FCF) toward debt repayment following the Wright Medical acquisition. The total debt/EBITDA ratio is expected to trend toward 3 times in the next 12 – 24 months.
S&P Global last affirmed Stryker’s long-term debt A- rating in May 2020 with a negative outlook.
Moody’s rating is the top tier of the ‘Lower Medium Grade’. S&P Global’s rating is 1 notch higher at the lowest tier of the ‘Upper Medium Grade’.
Moody’s rating defines Stryker as having ADEQUATE capacity to meet its financial commitments. However, adverse economic conditions or changing circumstances are more likely to lead to a weakened capacity of the obligor to meet its financial commitments.
S&P Global’s rating defines Stryker as having a STRONG capacity to meet its financial commitments. It is, however, somewhat more susceptible to the adverse effects of changes in circumstances and economic conditions than obligors in higher-rated categories.
Both ratings are investment grade and meet my requirements.
Dividend Quality
With shares trading at ~$236 and a $0.63 quarterly dividend, the dividend yield is ~1.07%. If you are seeking dividend income, it might be difficult to get excited about Stryker’s starting yield. Dividend Growth investors, however, use the dividend growth rate (DGR) as a preferred metric.
I typically prefer companies with a starting yield at least 1.5 times the ~1.48% average S&P 500 dividend yield as of March 17, 2021. Naturally, there are always exceptions and I am willing to consider a lower starting yield if the dividend growth is sufficient.
Part of my Investment thesis is to invest in companies that show a good history of increasing dividends and good growth potential. Companies that generate sustainable earnings growth often make the best dividend companies as it is easier to raise the dividend when earnings are rising.
Stryker is a dividend champion having increased its dividend for 28 consecutive years. On December 2, 2020, Stryker declared a $0.63/quarter dividend or $2.52/year. This was a ~9.6% increase from the prior $0.56/quarter.
In the FY2011 – FY2020 timeframe, Stryker has generated the following Free Cash Flow (FCF): $1.208B, $1.447B,$1.691B, $1.549B, $0.711B, $1.425B, $0.961B, $2.038B, $1.542B and $2.79B. This is a ~8.73% CAGR.
During the same period, Stryker’s annual dividend amounted to: $0.75, $0.90, $1.10, $1.26, $1.42, $1.57, $1.74, $1.93, $2.14, and $2.36. This is a ~12.15% CAGR.
The Payout Ratio is a good indicator of the sustainability of dividends. As a European Dividend Investor, I am used to a conservative rate below 50%. However, for US companies I like anything under 70%. Stryker’s typical dividend/FCF is ~30% – 50% with a ~39% 10-year average.
When the dividend growth rate exceeds the FCF growth rate and is growing, I become somewhat concerned. In Stryker’s case, however, the FCF payout ratio is so low my concern is alleviated.
Share Repurchases
The weighted average number of diluted issued and outstanding shares in the FY2011 – FY2020 timeframe is (in millions of shares rounded): 390, 383, 382, 383, 381, 379, 380, 380, 380, and 380.
Stryker cancelled its share repurchase program in Q1 2020 in light of the pandemic to preserve cash. I expect the share repurchase program to be reinstated once business conditions return to some form of normalcy.
Valuation
Management provided FY2021 adjusted diluted EPS guidance of $8.80 – $9.20 ($9.00 mid-point) in the Q4 and FY2020 Earnings Release. Also, 28 brokers have provided FY2021 guidance in the $8.84 – $9.20 range with a mean of $9.07. I am using $9.00 in adjusted diluted EPS to determine a reasonable share price at which I would consider acquiring shares.
Stryker’s FY2011 – FY2020 annual PE ratios average 33.58 (15.78, 16.17, 32.25, 56.15, 30.27, 27.29, 33.09, 48.38, 23.27, and 53.15). The PE ratio is all over the map but let’s go with a ~25 PE.
Using management’s FY2021 adjusted diluted EPS guidance, my $9.00 estimate, and a 25 forward adjusted diluted PE, I get a reasonable valuation of ~$225.
- 25 x $8.80 = $220;
- 25 x $9.20 = $230;
- 25 x $9 = $225.
I like to have a ~10% margin of safety so I would like the share price to retrace closer to the $200 before I consider initiating a position.
Conclusion
Stryker is a solid, stable company that has been increasing its dividends for the last 28 years. I have absolutely no concerns about dividend safety.
I am also encouraged that dividend increases are a priority for the company as per the FY2020 10-K (page 13 of 160).
“Our goal is to achieve sales growth at the high-end of the medical technology (MedTech) industry and maintain our long-term capital allocation strategy that prioritizes: (1) Acquisitions, (2) Dividends, and (3) Share repurchases.”
I would like to thank Charles for bringing this company to my attention. A company with a 1% dividend yield would not usually pass my initial screening process. Perhaps I need to revisit my screening process!
Based on my valuation calculations and my margin of safety requirement, a ~$200 share price is the level at which I would consider initiating a position. I have added Stryker to my watchlist and will most likely start a small position if the share price retraces to the ~$200 level. Naturally, this depends on what other investment opportunities exist and what funds I have available.
Disclosure: Derek has no position in SYK and has no plan to initiate a position in the next 72 hours.
Disclaimer: Derek is not a licensed or registered investment adviser or broker/dealer. He is not providing you with individual investment advice. Please consult with a licensed investment professional before you invest your money.