 Summary
- SPGI is the largest of the 10 statistical rating organizations recognized by the US Securities and Exchange Commission.
- The company has undergone a significant transformation over the last few years and is now focused exclusively on the high-growth, high-margin businesses—Standard & Poor’s Ratings Services, S&P Dow Jones Indices, S&P Capital IQ and Platts.
- SPGI’s long-term debt ballooned in FY2015 when it paid $1.375B in penalties to finalize the long outstanding issues surrounding its failure to properly identify financially risky investments which led to the Financial Crisis.
- I am willing to overlook ~1% dividend yield since I envision SPGI’s shares will grow in value over time. I would, however, like to see the stock price retrace to the ~$166 level. With the volatility I anticipate we will see in the markets, I am cautiously optimistic I will get my entry price at some stage in 2018.
Introduction
In the first of two articles on the leading publicly traded credit rating agencies in North America I reviewed Moody’s Corporation (NYSE: MCO). In this article I provide my opinion on S&P Global Inc. (NYSE: SPGI), the industry leader.
Industry Overview
Please refer to the MCO article for a high level industry overview.
Business Overview
SPGI was founded by Henry Varnum Poor in 1860 when he published an investor’s guide to the U.S. railroad industry. A timeline of SPGI’s evolution subsequent to 1860 can be found here.
The company is a leading provider of transparent and independent ratings, benchmarks, analytics and data to the capital and commodity markets worldwide.
- the capital markets include asset managers, investment banks, commercial banks, insurance companies, exchanges, trading firms and issuers;
- the commodity markets include producers, traders and intermediaries within energy, metals, petrochemicals and agriculture.
It serves its global customers through a broad range of products and services available through both third-party and proprietary distribution channels.
The company’s operations consist of three reportable segments: Ratings, Market and Commodities Intelligence and S&P Dow Jones Indices (“Indices”).
In December 2017, management announced that S&P Global Platts, a business line within Market and Commodities Intelligence, would be managed as a separate reportable segment effective January 1, 2018. The results of S&P Global Market Intelligence and S&P Global Platts will be reported separately beginning with Q1 2018.
In 2010, a Growth and Value Plan was conceived by the Board of Directors and management to create two new companies: McGraw-Hill Financial (‘Financial’) and McGraw-Hill Education (‘Education’).
In November 2012, the company entered into an agreement with Apollo Global Management, LLC for the sale of Education.
The rationale for the sale of Education was to allow that part of the business to continue to develop digital learning systems for better outcomes for students and professionals around the world. The retention of Financial under the Financial name would allow management to sharpen its focus on the high-growth, high-margin businesses—Standard & Poor’s Ratings Services, S&P Dow Jones Indices, S&P Capital IQ and Platts. The company’s new mission would be to promote sustainable growth by bringing transparency and essential insights to the global capital, commodities and commercial markets.
Financial continued its evolution in 2015. Strategic alternatives for the J.D. Power line of business were evaluated. In addition, the company paid $1.375B in penalties to finalize the long outstanding issues surrounding its failure to properly identify financially risky investments which led to the Financial Crisis. In addition, the senior leadership team proposed Financial be renamed S&P Global so as to better reflect its core businesses and to capitalize on one of the most recognizable brands in financial markets.
S&P Global was launched in April 2016. In that same year, the company:
- made significant progress in the integration of SNL Financial and S&P Capital IQ;
- completed the sale of J.D. Power for $1.1B in September;
- divested two pricing businesses in which it did not have critical mass (Standard & Poor’s Securities Evaluations, Inc. and Credit Market Analysis);
- exited the Equity Research business;
- made 3 tuck-in acquisitions to build out Platts’ analytical offerings.
In March 2017, SPGI announced that it had entered into a strategic relationship with Kensho Technologies, Inc., a provider of next-generation analytics, machine learning, and data visualization systems to Wall Street’s premier global banks and investment institutions. Both companies agreed to a long-term commercial relationship which would result in product and data collaboration between Kensho and SPGI’s Market Intelligence division, a leader in multi-asset class research data and insights.
In September 2017, SPGI announced that it had formed a strategic partnership and had taken a minority stake in Algomi, a fintech company with offices in New York, Hong Kong and London. Algomi is an innovative fintech company that has created a bond information network that enables buy side and sell side firms, as well as exchanges, to harness data to improve financial trading decisions via greater transparency and artificial intelligence-powered trade facilitation.
In late February 2018, SPGI acquired Panjiva, Inc., a privately-held company that provides deep, differentiated, sector-relevant insights on global supply chains, leveraging data science and technology to make sense of large, unstructured datasets. It provides clients with macro data covering 95% of global trade flows, as well as transactional data covering 35% of global trade flows. The company tracks supply data from retailers, exporters and shippers across a myriad industries and commodities.
On the February 6, 2018 Q4 and FY2017 Earnings Conference Call, SPGI’s President and CEO indicated that SPGI would continue to increase investments in new technologies.
SPGI’s gross revenue has grown steadily subsequent to the Financial Crisis having increased from $3.639B in FY2010 to $6.063B in FY2017.
In addition to growth via acquisition, other operating margin expansion opportunities exist. Shareholders can also expect EPS growth from continued share buybacks.
SPGI faces similar risks as MCO. Should economic growth slow and/or should interest rates rise, there is the possibility the demand for corporate debt and ratings may slow from that evidenced in 2017 as many issuers took advantage of attractive rates and tight spreads in 2017.
Impact of the Tax Cuts and Jobs Act (TCJ) on SPGI
SPGI recorded in Q4 2017 a net one-time charge of $0.149B. This charge included a
$0.173B tax expense from the deemed repatriation of foreign earnings. It was partially offset by a $0.024B benefit from the revaluation of net deferred tax liabilities at the lower enacted corporate rate.
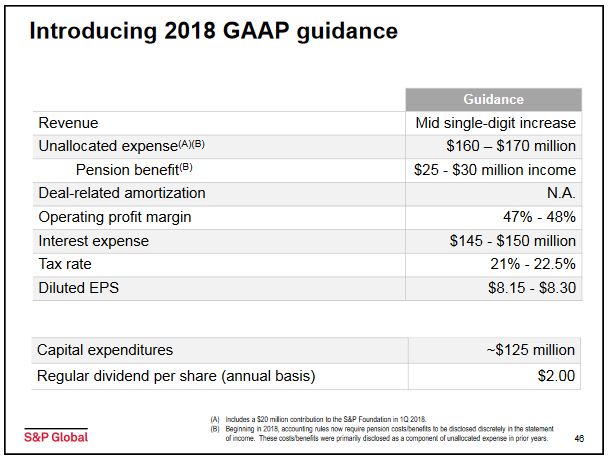
The company expects a significant reduction in its effective tax rate to 21% – 22.5% in 2018. This will generate ~$0.2B of additional free cash flow.

 Source: S&P Global Q4 and FY2017 Earnings Conference Call – February 6, 2018
Q4 and FY2017 Financial Results and FY 2018 Outlook
SPGI’s February 6, 2018 Earnings Release can be found here.


Source: S&P Global Q4 and FY2017 Earnings Conference Call – February 6, 2018
FY2018 reported revenue is expected to increase mid single-digits. On a U.S. GAAP basis, diluted EPS is expected to be $8.15 – $8.30 and adjusted diluted EPS is expected to be $8.45 – $8.60. Adjusted diluted EPS excludes amortization of intangibles related to acquisitions.
Credit Ratings
MCO has assigned a Baa1 long-term credit rating to SPGI while Fitch has assigned a BBB+ rating. Both ratings are lower medium grade.
Free Cash Flow (FCF)
Of the ~$2.8B in cash and cash equivalents at the end of Q4 2017, ~$2.1B was held outside the US.
Cash provided by operating activities was $2.02B for FY2017 and FCF of $1.78B was a $0.453B increase from 2016.
If we exclude tax on gains from divestitures and the after-tax payments associated with legal and regulatory settlements and insurance recoveries then FCF was $1.85B; this is a $0.273B increase from 2016.
FY2018 FCF excluding certain items is expected to be ~$2.3B.
 Source: S&P Global Q4 and FY2017 Earnings Conference Call – February 6, 2018
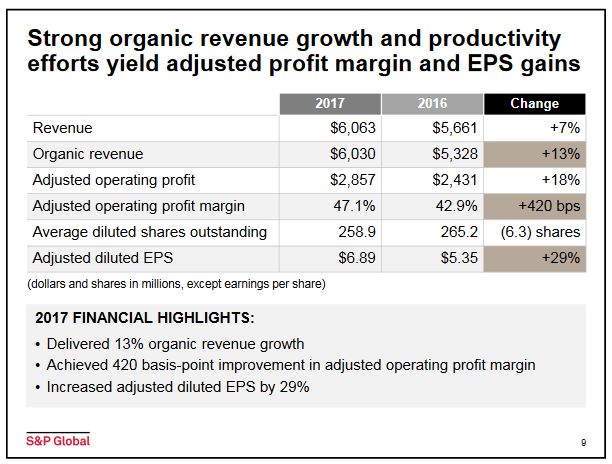
Valuation
FY2017 diluted EPS amounted to $5.78 versus $7.34 reported in FY2016 representing a 27% decline. Adjusted diluted EPS of $6.89 was up 29% from $5.34 in FY2016.
On the basis of SPGI’s March 2 closing stock price of $189.02, I get a forward PE range of ~22.8 – ~23.2 using the projected FY2018 diluted EPS range of $8.15 – $8.30. On the basis of projected adjusted diluted EPS of $8.45 – $8.60 I get a forward adjusted diluted PE range of ~22 – ~22.4.
A forward PE of ~20 or below is what I would be prepared to pay for SPGI. On this basis I am looking for a price ~$166 (20 x $8.3).
Dividend, Dividend Yield, and Dividend Payout Ratio
SPGI’s dividend history can be found here and stock split history can be found here.
SPGI returned $0.421B to shareholders in the form of dividends during FY2017.
As a result of U.S. tax reform, SPGI’s Board of Directors approved on February 2, 2018 a 22% increase in the quarterly cash dividend ($0.41/share increased to $0.50/share). This dividend will be payable on March 12, 2018 to shareholders of record on February 26, 2018.
SPGI’s dividend has grown at an average compound annual growth rate of 9.8% since 1974. In addition, SPGI has paid a dividend each year since 1937 and it is one of fewer than 25 companies in the S&P 500 that has increased its dividend annually for at least the last 45 years.
Based on SPGI’s $189.02 closing stock price on March 2, 2018, the new $2.00 annual dividend represents a ~1% dividend yield. This low dividend yield will, unfortunately, likely dissuade some investors from taking a closer look at SPGI as a potential valuable addition to their investment portfolio.
The $1.64 annual dividend in FY2017 amounted to ~28.4% of the diluted EPS of $5.78 or ~23.8% of the adjusted diluted EPS of $6.89. The projected $2.00 annual dividend for FY2018 represents a payout ratio in the range of ~24% – 24.5% of SPGI’s projected diluted EPS of $8.15 – $8.30 or ~23.3% – 23.7% of projected adjusted diluted EPS $8.45 – $8.60. Regardless of the projected EPS figure used to determine the forward dividend payout ratio, SPGI’s earnings should easily cover the dividend.
Share Repurchases
SPGI returned $1.4B to shareholders in FY2017 (~$1.0B in share repurchases and ~$0.421B in dividends).
Share repurchases were the primary reason for the 2+% reduction in diluted shares outstanding during 2017. During Q4, SPGI received 0.5 million shares from its Q3 accelerated share repurchase program and repurchased an additional 0.9 million shares. In 2018, consistent with its capital management philosophy, SPGI anticipates it will continue its share repurchase program, subject to market conditions.
The diluted weighted average number of shares outstanding (in millions) in FY2011 – FY2017 amounted to 303.6, 284.6, 279.8, 271.5, 274.6, 265.2, and 258.9. While there was a slight increase in FY2015, the long-term trend is favorable.
Final Thoughts
My thoughts surrounding an investment in SPGI are much the same as those for MCO.
SPGI certainly dropped the ball when it completely missed the opportunity to forewarn investors of the risks which ultimately resulted in the Financial Crisis. It paid a heavy price as evidenced by the company’s long-term debt having ballooned in FY2015 to $3.468B from $0.795B in FY2014; the bulk of this increase was attributed to the $1.375B Financial Crisis related settlement.
In addition to the additional oversight authority granted to the US Securities and Exchange Commission in recent years, I am confident SPGI’s management wants to avoid further damage to the company’s reputation and it certainly does not want to face further fines of the magnitude incurred.
If another debacle were to occur, I strongly suspect SPGI’s reputation would suffer irreparable damage. Management is well aware of this, and therefore, I am reasonably comfortable that systems, procedures, and processes are now in place to avoid another blunder of significant magnitude.
Yield hungry investors will likely have no interest in SPGI. The low dividend yield is not a deal breaker from my perspective since I look at a company’s overall potential return; I look for returns in the form of dividends AND capital gains.
SPGI certainly has an enviable dividend track record. I would be pleased if SPGI’s future dividend growth approximates the average compound annual growth rate of 9.8% since 1974.
In addition to an attractive long-term compound annual dividend growth rate, management is prepared to repurchase outstanding shares when the stock price is attractive.
As with MCO, I intend to initiate a position in SPGI. I do, however, view the current price of $189.02 as a bit on the rich side and will patiently wait for a ~$166 or lower entry price. This would be a pullback of ~12% which I am cautiously optimistic will occur in 2018.
Thanks for reading!
Note: I sincerely appreciate the time you took to read this article. Please send any feedback, corrections, or questions to charles@financialfreedomisajourney.com
Disclaimer: I have no knowledge of your individual circumstances and am not providing individualized advice or recommendations. I encourage you not to make any investment decision without conducting your own research and due diligence. You should also consult your financial advisor about your specific situation.
Disclosure: I do not currently hold a position in any company referenced herein and do not intend to initiate a position within the next 72 hours.
I wrote this article myself and it expresses my own opinions. I am not receiving compensation for it and have no business relationship with any company whose stock is mentioned in this article.