![]()
Summary
- MCD has significantly re-energized its business in the last few years under new leadership.
- The refranchising strategy has yielded significant cost savings to date.
- I am bullish on MCD but view it as being currently overvalued at ~$164. I would add to my existing position if it retraces to ~$144.
Introduction
McDonald’s (NYSE: MCD) share price peaked at ~$178 on January 26th and subsequently slipped to ~$148 on March 2nd. Subsequent to this date, MCD’s stock price has experienced wide fluctuations. On April 30th, MCD experienced a ~$9/share spike when it released its Q1 results but pulled back ~$4 on May 1st.
Given that MCD released its Q1 2018 results on April 30th and the fact I have not reviewed it subsequent to my January 24, 2017 article, I thought it would be an opportune time to revisit MCD.
Business Overview
MCD franchises and operates McDonald’s restaurants. Of the 37,241 restaurants in 120 countries as at FYE2017, 34,108 were franchised (21,366 franchised to conventional franchisees, 6,945 licensed to developmental licensees and 5,797 licensed to foreign affiliates primarily in Japan and China) and 3,133 were operated by MCD.
The business is structured into the following segments that combine markets with similar characteristics and opportunities for growth, and reflect how management reviews and evaluates operating performance:
- U.S. – MCD’s largest segment;
- International Lead Markets – established markets including Australia, Canada, France, Germany, the U.K. and related markets;
- High Growth Markets – markets MCD believes have relatively higher restaurant expansion and franchising potential. This includes China, Italy, Korea, the Netherlands, Poland, Russia, Spain, Switzerland and related markets;
- Foundational Markets & Corporate – the remaining markets in the MCD system, most of which operate under a largely franchised model. Corporate activities are also reported within this segment.
As at FYE2017, the U.S., International Lead Markets and High Growth Markets accounted for 35%, 32% and 24% of total revenues, respectively.
Investors who use stock screeners exclusively to identify investment opportunities would very likely eliminate MCD as a potential investment if one of the ‘screening’ metrics is ‘sales growth past 5 years’. Looking at ‘Total Revenues’ for 2012 – 2017, we see that MCD reported $22.567B in FY2012 and $22.820B in FY2017. These figures would suggest that MCD has been spinning its wheels during this timeframe. This is why it is extremely important to delve into the 10-K reports.
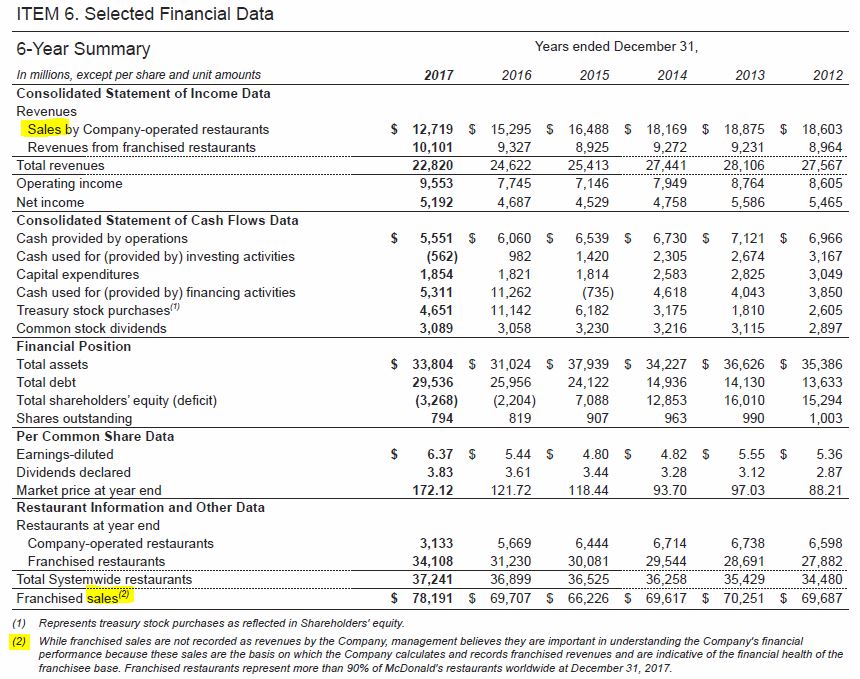
Looking closely at the 6-Year Summary of Selected Financial Data extracted from the 2017 10-K, we see that MCD has been converting its company-owned outlets into franchised-owned outlets and a few thousand new franchised outlets have also been opened.
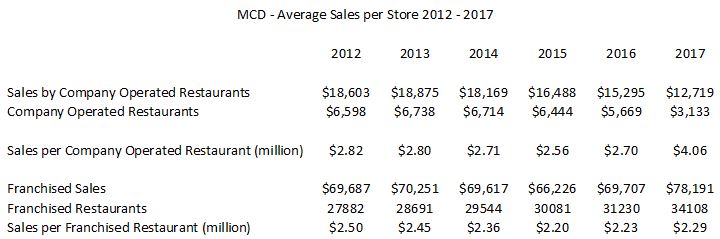
Company-owned stores certainly add top line revenue while franchised stores only add rent and franchise fees paid to MCD. If you look at the table below, however, you will see that a key benefit to having a higher proportion of franchised outlets is that franchised restaurants’ occupancy expenses are ~17% – ~18.50% of revenue; this compares with ~80% – 85% for company operated restaurants. What we see from these results is that MCD does not need to devote as much capital to growing or maintaining stores as franchise owners now carry some of that burden.
Sales per company operated restaurant exceed those operated by franchisees with a noticeable increase in FY2017. This is likely attributed to MCD’s decision to retain the ‘best’ stores and to franchise the rest.
 Q1 2018 Results
MCD’s Q1 2018 results reported on April 30, 2018 can be found here.
MCD has embarked on an aggressive plan in the US market. Since the start of 2018, MCD has modernized and improved hospitality in nearly 1,000 restaurants; the plan is to bring the ‘Experience of the Future’ to an additional 1,000 restaurants every quarter in 2018. The ‘Experience of the Future’ initiative calls for the upgrading and renovation of restaurants to provide a modern dining experience to customers. Under the new format, MCD customers will be able to order food using touch screen kiosks and will get tableside food delivery.
Globally, MCD marked its 11th consecutive quarter of positive comparable sales with growth of 5.5% in Q1. Guest count grew by 0.8%, marking the 5th consecutive quarter of positive global guest count growth. The most significant improvements were in Japan, France, Australia, and Canada, where MCD experienced double-digit increases in the key measures of customer satisfaction.
While MCD has produced strong results in various areas of its business, it still continues to be challenged in the US from the perspective of consistently growing comparable guest counts, especially when current overall industry traffic is negative. In the US, guest count declined in Q1 due to the very competitive ‘breakfast day’ and because of MCD’s conscious decision to eliminate most local value offers.
2018 and 2019 Outlook
MCD does not generally provide specific guidance on changes in comparable sales.
Interest expense for FY2018 is expected to increase ~5% – 7% compared with 2017 due primarily to higher average borrowings.
The effective income tax rate for FY2018 is expected to be ~25% – ~27% but certain aspects of the Tax Act are expected to be clarified. As a result, MCD’s effective tax rate could change from this projected range.
FY2018 capital expenditures of ~$2.4B are projected with ~$1.5B being dedicated to MCD’s U.S. business.
MCD has indicated it expects to contribute to about 250 restaurant openings. Developmental licensees and affiliates will contribute capital towards the opening of approximately 750 restaurants, for a total of about 1,000 expected restaurant openings in 2018. MCD expects net additions of about 600 restaurants in 2018.
MCD expects to return about $24B to shareholders over the 3 year period ending 2019.
MCD expects to modestly increase its debt levels as the business grows while maintaining its credit metrics within current ranges.
Beginning in 2019, MCD expects to achieve the following long- term, average annual financial targets:
- System-wide sales growth of 3-5%;
- Operating margin in the mid-40% range;
- EPS growth in the high-single digits;
- Return on incremental invested capital (ROIIC) in the mid-20% range. ROIIC is calculated by dividing the change in operating income plus depreciation and amortization (numerator) by the cash used for investing activities (denominator), primarily capital expenditures.
Long-Term Debt
In 2012, before MCD embarked on its aggressive share repurchase program, long-term debt stood at ~38.5% of its total liabilities and shareholders’ equity. As at FYE2017, long-term debt stood at ~87.4%.
In 2012, fixed-rate debt as a percent of total debt amounted to 74%. This level was held constant in 2013 and 2014; the weighted-average annual interest rate of MCD’s total debt was 4%.
In 2017, fixed-rate debt as a percentage of total debt amounted to 89%. This level increased from 81% and 82% in 2015 and 2016. The weighted-average annual interest rate of total debt was 3.3% versus 3.8% and 3.5% in 2015 and 2016.
While MCD has certainly taken advantage of the low interest rate environment over the past several years, let’s see where MCD stacks up on debt service.
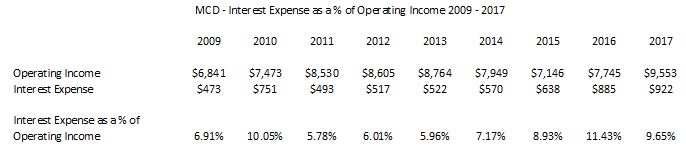
I draw your attention to MCD’s interest expense / operating income found in the following Consolidated Operating Results tables for FY2009 – FY2017.
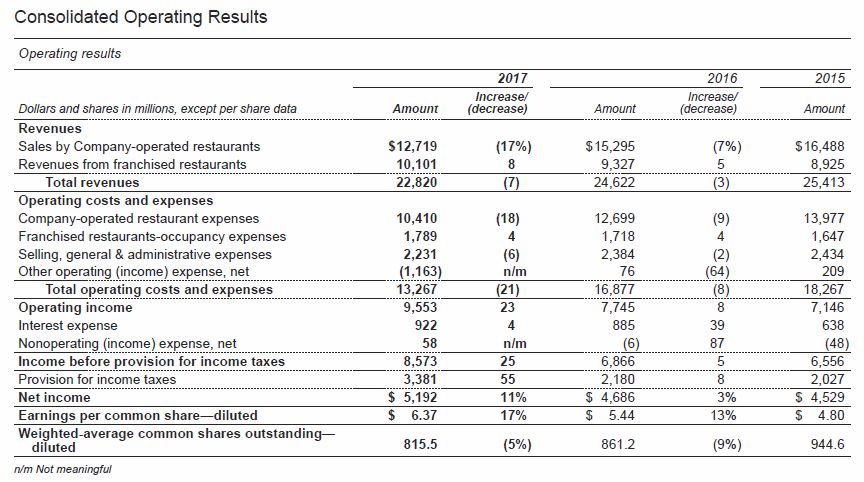
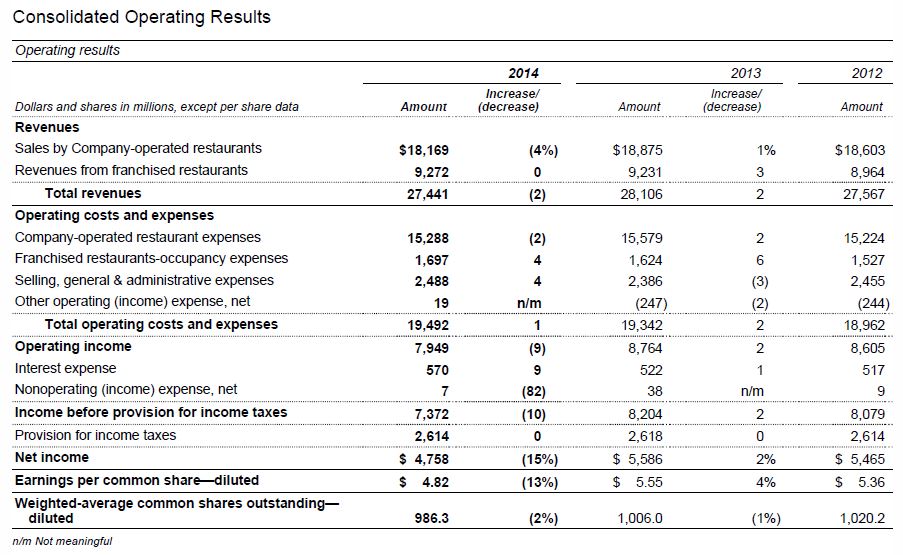
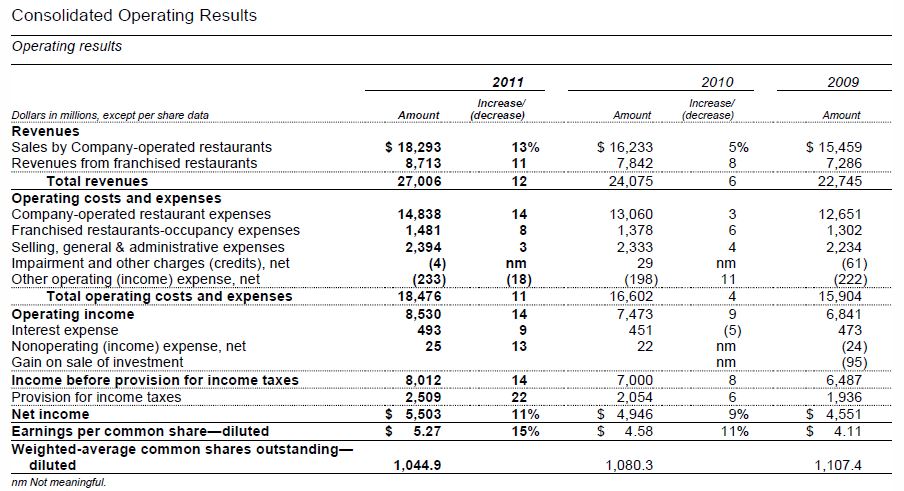
Source: MCD 10-Ks
Despite the rapid growth in debt in recent years, MCD’s interest expense / operating income before interest and taxes has increased somewhat relative to FY2011 – FY2014 but not at a level which suggests cause for concern.
On March 16, 2018, MCD issued an aggregate principal amount of US $1.5B of the Company’s medium-term notes pursuant to its existing medium-term notes program. The following tranches of its medium-term notes were issued:
- US $0.5B of 3.350% Medium-Term Notes Due 2023, as described in Pricing Supplement No. 9, dated March 14, 2018;
- US $0.5B of 3.800% Medium-Term Notes Due 2028, as described in Pricing Supplement No. 10, dated March 14, 2018;
- US $0.5B 4.450% Medium-Term Notes Due 2047, as described in Pricing Supplement No. 11, dated March 14, 2018.
Once again, MCD has recently taken advantage of this attractive interest rate environment.
Credit Ratings
As at FY2012, Standard & Poor’s and Moody’s rated, with a stable outlook, MCD’s long-term debt A and A2, respectively. Both ratings are the middle tier of the upper medium grade rating description.
Standard & Poor’s and Moody’s currently rate, with a stable outlook, MCD’s long-term debt BBB+ and Baa1, respectively. Both ratings are the upper tier of the lower medium grade rating description.
Despite the two notch downgrade in MCD’s long-term debt credit ratings during the 2012 – 2017 timeframe, I still view MCD’s credit ratings as acceptable for my purposes.
Valuation
In FY2017, MCD reported diluted EPS of $6.37. Based on management’s projection for EPS growth in the high single digits I estimate FY2018 EPS will be ~$6.88.
As previously noted, MCD peaked at ~$178 on January 26th at which time the forward PE was ~25.87 ($178/$6.88). This is well in excess of what I consider a reasonable valuation for MCD.
MCD slipped to ~$148 on March 2nd thus giving us a forward PE of ~21.51.
MCD then spiked to ~$167.44 when it released its Q1 results thus resulting in a revised forward PE of ~24.34. Even with a slight pullback to $163.44 on May 1st, MCD’s forward PE of ~23.76 is still well in excess of what I would be prepared to pay.
MCD is certainly a much better company than it was a few years ago when it appeared to have lost its mojo; under new leadership MCD’s business has certainly been reinvigorated. I do not, therefore, expect MCD to have a PE level in the mid teens like it did in 2008 – 2010, 2012, and 2013. Having said this, a forward PE of ~24 leaves little margin for error and a reasonable return on investment will likely be hard to achieve.
I would be prepared to pay ~$144 which, on the basis of $6.88 in FY2018 EPS, would give us a forward PE of ~21.
I recognize this would mean a drop of ~$20/share or ~12% from the current $163.44. In my opinion, this is not totally out of the realm of possibility. We have a somewhat unpredictable market and I suspect there will be further pullbacks similar to those experienced in the last few months.
Dividend, Dividend Yield, Dividend Payout Ratio, and Share Repurchases
MCD’s dividend history can be found here and stock split history can be found here.
Based on the current ~$163.44 stock price as at the close of business on May 1st, MCD’s $4.04 annual dividend provides investors with a 2.47% dividend yield.
MCD’s 9.50% compound annual dividend growth rate for 2008 – 2018 can be found below.
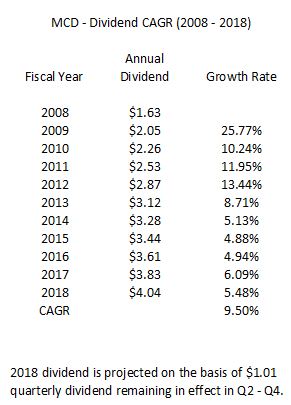
MCD’s projected FY2018 annual dividend of $4.04 is ~59% of the $6.88 projected FY2018 EPS. While high, this level is lower than that evidenced in FY2014 – 2016. In addition, MCD generates strong free cash flow (ranging from a low of $3.7B in FY2017 to a high of $4.725B in FY2015).
Final Thoughts
While I am not prepared to add to my existing MCD position at current levels I am open to increasing my MCD exposure at the right price. A level close to ~$144 is what I seek.
MCD has scheduled its annual shareholders’ meeting for May 24, 2018. I will be following up to see what is communicated at that meeting.
I wish you much success on your journey to financial freedom.
Thanks for reading!
Note: I sincerely appreciate the time you took to read this post. As always, please leave any feedback and questions you may have by clicking on “Contact Me” found below.
Disclaimer: I have no knowledge of your individual circumstances and am not providing individualized advice or recommendations. I encourage you not to make any investment decision without conducting your own research and due diligence. You should also consult your financial advisor about your specific situation.
Disclosure: I am long MCD.
I wrote this article myself and it expresses my own opinions. I am not receiving compensation for it and have no business relationship with any company whose stoc