![]()
At the time of my February 11, 2026 S&P Global (SPGI) post, SPGI has just released its Q4 and FY2025 results and FY2026 guidance February 10. In that post I disclose the following purchases through ‘Core’ accounts in the FFJ Portfolio:
- 50 shares @ ~$438.5154 on February 6; and
- 50 shares @ ~$413.085 on February 10.
On April 29, I acquired an additional 50 shares @ $428.775 in a ‘Core’ account. My SPGI exposure currently consists of 600.09676 SPGI shares in two ‘Core’ accounts and 300 shares in a ‘Side’ account.
Business Overview
Part 1 in the FY2025 10-K and the company’s website explain SPGI’s business and risk factors.
Mobility Division Spin-Off
In my prior post I state that on April 29, 2025, SPGI announced its intent to separate S&P Global Mobility (Mobility) from SPGI. The separation will result in Mobility becoming a standalone public company.
On February 3, 2026, the company officially announced that the new entity will be named Mobility Global, Inc..
The separation is to be tax-free to shareholders with a target completion by late 2026 (within the original 12-to-18-month window provided during the April 29, 2025 announcement).
Unlocking Artificial Intelligence (AI) Potential
In the Q1 2026 earnings call, SPGI highlights that while fixed subscriptions provide the floor for valuation, recurring variable streams provide the upside.
With the surge in Agentic AI and high-frequency data needs, SPGI is pivoting toward more usage-based pricing models for its AI-native tools (like ChatIQ). This shift is intended to capture more value from heavy users without raising the entry price for smaller subscription clients.
SPGI structures unlocking AI potential around three core pillars:
- Product Innovation;
- Commercial Monetization; and
- Workforce Enablement.
Product Innovation
The center of SPGI’s product information transformation is Kensho Technologies. SPGI has built a system that allows Large Language Models (LLMs) to ingest SPGI’s proprietary, high-quality data.
By using Kensho’s extraction tools to automate the collection of data that used to require manual entry, SPGI is able to scale its data coverage (especially in high-growth areas like Private Markets and Energy Transition) without a linear increase in headcount.
Kensho LLM-ready API: Launched in early 2026, this tool allows institutional clients to connect models like GPT-4 or Claude directly to SPGI’s financial databases. It uses a simplified structure that supports “function calling,” enabling AI to answer complex queries such as ‘Compare the EBITDA trends of the Top 5 hyperscalers relative to their AI infrastructure spend.’
ChatIQ: A natural-language interface embedded in Capital IQ Pro. It allows analysts to perform document while providing clickable citations back to the source document to ensure auditability. In essence, this intelligence can instantly summarize thousands of pages of transcripts or SEC Filings such as 10-Qs and 10-Ks.
NERD & Link: These tools clean messy, unstructured global data (news, PDFs, audio) and link it to SPGI’s standardized IDs, creating the high-fidelity training sets required for Agentic AI.
Commercial Monetization From ‘Seats’ to ‘Value’
SPGI is fundamentally changing how it makes money from AI. On the Q1 2026 earnings call, management highlighted a pivot away from traditional seat-based licensing toward enterprise value-based and usage-based pricing.
API Volume Growth: Contracted Application Programming Interface (API) usage surged in Q1 2026, with API call volumes increasing 5x quarter-over-quarter. API is a bridge that allows two different pieces of software to talk to each other. In essence, an API allows one computer program to as” another program for specific data or to automatically perform a task.
Premium Pricing: SPGI is charging a premium for AI-ready data (data that is already cleaned, tagged, and formatted for LLM ingestion. This is driving higher Average Revenue Per User (ARPU).
Workforce Enablement
SPGI has launched the AI Academy to upskill its 40,000 employees. It uses a three-stage roadmap to ensure usage of the technology:
- Access: Providing all staff with secure, internal-only versions of generative AI tools.
- Application: Automating internal “messy” workflows, such as initial credit research drafts or data entry for private company financials.
- Acceleration: Using AI to reduce the “time-to-market” for new data sets from months to weeks.
Financial Results
Q1 FY2026
Material related to the April 28 Q1 2026 earnings release is accessible here.
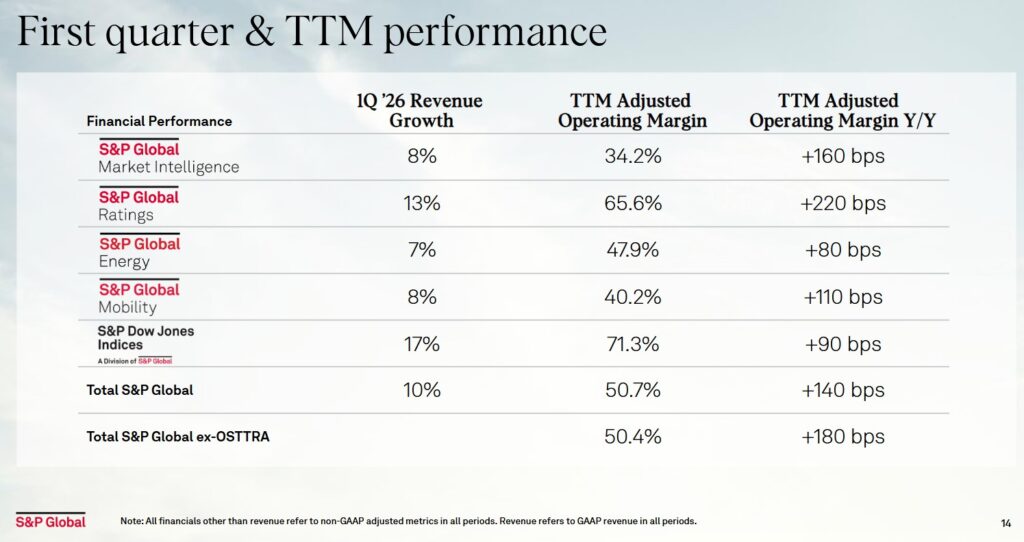
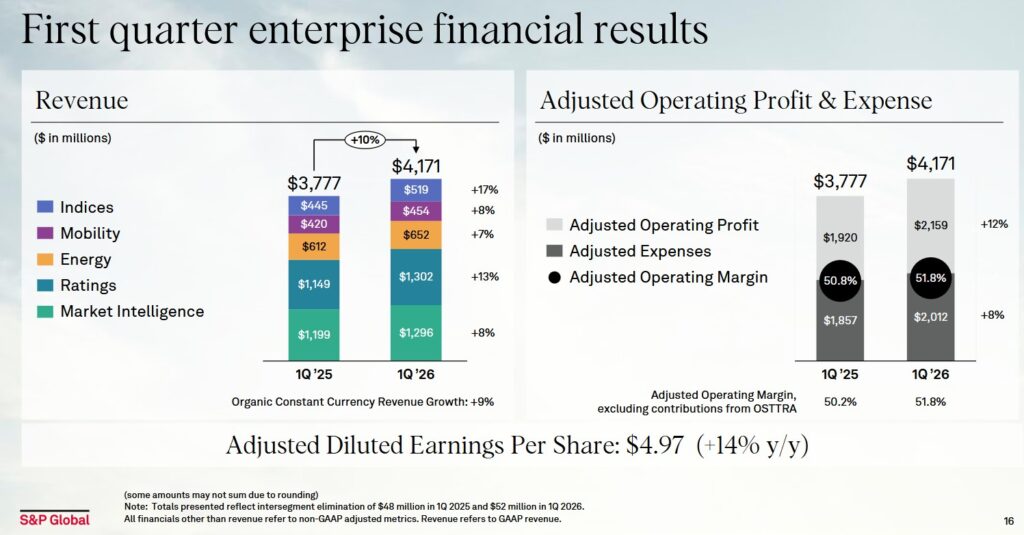
Details about each business segment’s performance in Q1 2026 relative to Q1 2025 is in the Q1 2026 related material.
Operating Cash Flow (OCF), Free Cash Flow (FCF), and CAPEX (FY2019 – FY2025 and Q1 2026)
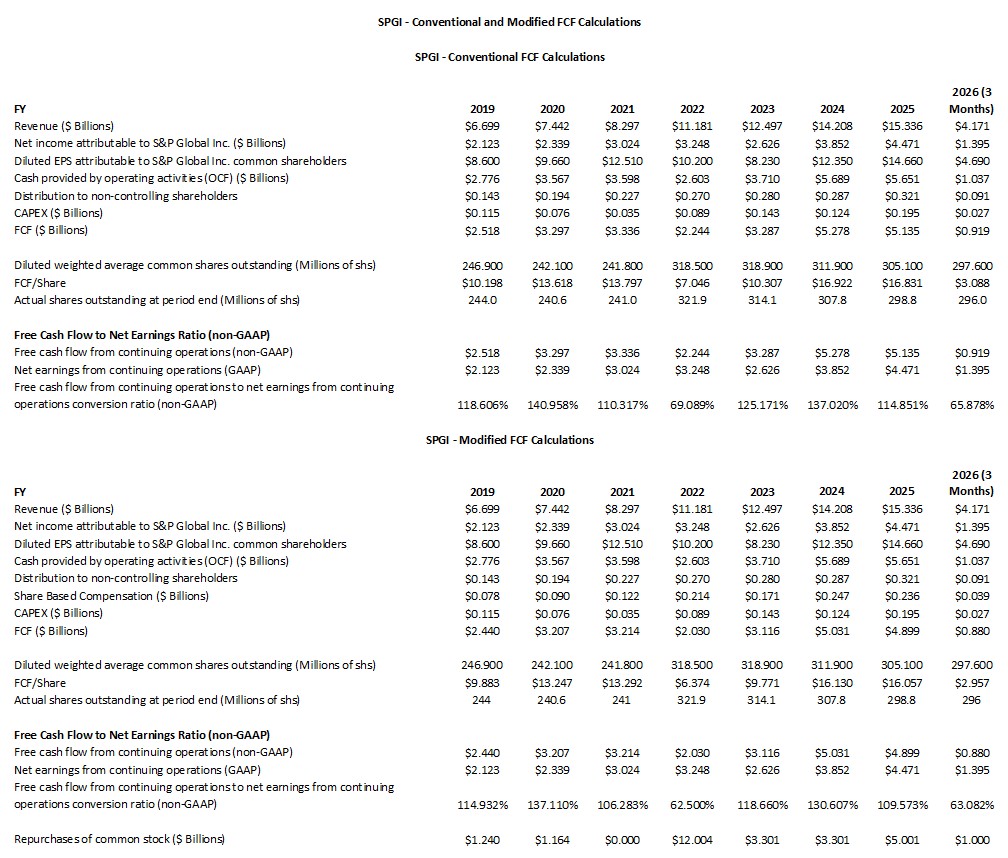
FCF is a non-GAAP metric, and therefore, its method of calculation is inconsistent. Historically, SPGI deducts CAPEX from OCF to calculate its FCF. My preference is to also deduct share-based compensation (SBC) from a company’s OCF. An explanation for this is provided in prior posts.
The following reflects SPGI’s FCF using the conventional and modified calculation methods.
NOTE: A direct comparison should not be made between Q1 2026 FCF conversion ratios and prior fiscal years.
The following reflects how SPGI determines FCF in Q1 2025 and Q1 2026.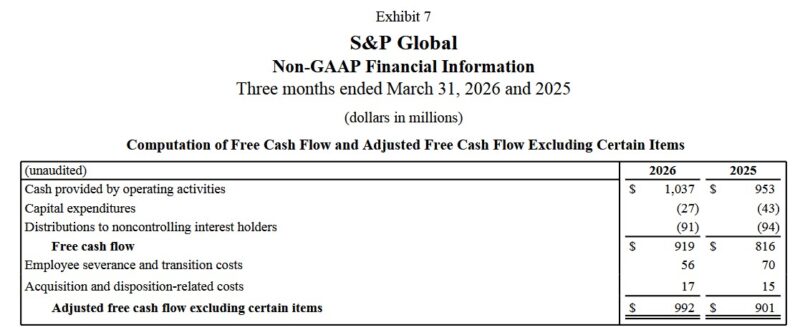
Capital Allocation
During the FY2019 – FY2025 time frame, SPGI transitioned from a steady-state financial data provider to an expanded information powerhouse through its $44B acquisition of IHS Markit announced in 2020 and completed in 2022. Its capital allocation strategy during this period was characterized by a disciplined rule of returning 85% of adjusted free cash flow to shareholders while executing massive strategic reconfigurations.
SPGI has now expanded into high-growth adjacencies with added depth in private markets, energy transition, and supply chain data.
In order to obtain regulatory approval for the IHS Markit acquisition, SPGI divested several assets, including its CUSIP Global Services business (sold to FactSet for ~$1.9B) and its Engineering Solutions division (sold to KKR for ~$1.2B).
As noted earlier in this post, SPGI will also be separating S&P Global Mobility into a standalone public entity. This move signals a refined focus on the company’s 4 core pillars: Ratings, Market Intelligence, Energy, and Indices.
In addition to its 50+ year track record of dividend increases, it has repurchased more than $26B of its shares in FY2019 – FY2025.
A significant portion of capital is being allocated toward revenue from new/enhanced products. SPGI generally allocates ~$1B+ annually to technology. In the past couple of years, SPGI has shifted its technology spend heavily toward Generative AI integration across its data platforms and ‘Market Intelligence’ workflows.
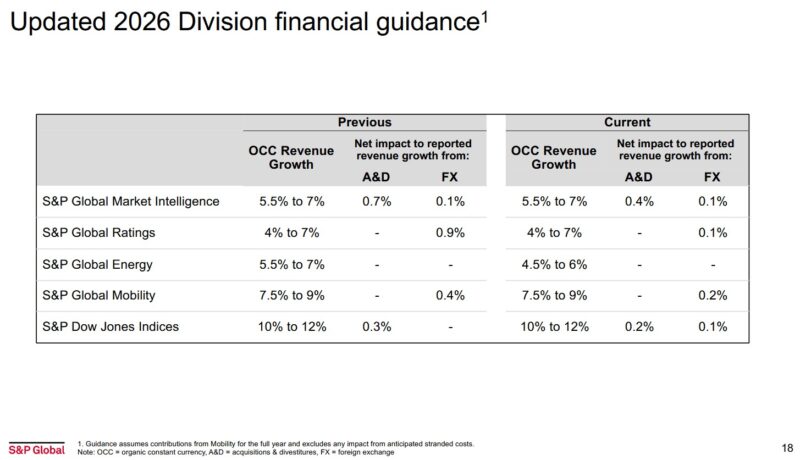
FY2026 Guidance
The following reflects SPGI’s updated FY2026 guidance for the company as a whole and by division.
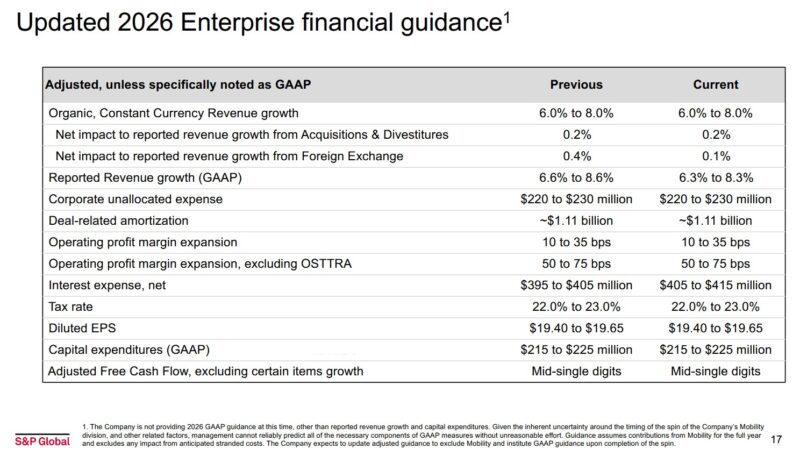
On the Q1 2026 earnings call, management states:
The conflict in Iran has led to the largest energy shock since the 1970s and counterbalance what was previously a broadly favorable economic environment for our business. Our current outlook assumes the situation stabilizes by the end of the second quarter, we acknowledge the risk of a protracted conflict. We assume 3.2% global GDP growth, including 2.2% growth in the U.S. We also assume 3.2% CPI growth in the U.S. We expect near-term energy client demand to remain suppressed given our expectation for ongoing market uncertainty.
Should the conflict persist longer or escalate, we could see more significant direct headwinds, particularly in our energy business, and significant indirect headwinds in our market-sensitive businesses, depending on equity market reaction and credit market conditions. We continue to see favorable market conditions for issuance in 2026, even though we now only expect 1 rate cut in the U.S.
We also entered the year with encouraging maturity walls, as we discussed on our fourth quarter call, and we are encouraged by the growth of announced M&A. Some of the strength in issuance in the first quarter was driven by front-end loading of hyperscaler issuance relative to our initial expectations. Given both the outperformance in the first quarter and the more modest expectations for Q2, we do not expect to see acceleration in Ratings revenue growth in the second quarter.
Given the external environment, particularly the impact of the Iran conflict and the energy disruption on both the demand and supply side, we currently expect to deliver organic constant currency revenue growth in the range of 4.5% – 6%, 1 percentage point lower than the previous guidance.
Importantly, our guidance assumes that the current elevated level of disruption in the energy market persists through the second quarter, though supply chain disruptions would not fully be resolved until later this year. For our indices business, our full-year guidance is unchanged. However, the underlying assumptions have been adjusted to reflect the current market dynamic. Our guidance now assumes equity markets roughly flat from current levels and low double-digit growth year-over-year in ETD volumes.
ROIC and WACC
Return on Invested Capital (ROIC) provides an indication of a company’s efficiency. In essence, is a company actually creating value or ‘burning’ cash for the sake of growth?
A company with a higher ROIC is mathematically worth more because it requires less reinvestment to achieve that growth.
A good indication of how well a company is performing is to compare ROIC to the Weighted Average Cost of Capital (WACC). WACC, however, is not a metric officially reported by SPGI but it can be roughly estimated based on the company’s credit profile and market conditions.
The generally accepted high-level formula used by Wall Street is:
ROIC = NOPAT/Average Invested Capital
with the Net Operating Profit After Tax (NOPAT) formula being Operating Income (EBIT) x (1-tax rate)
This shows how much profit the core business makes while ignoring how much debt the company has.
The Average Invested Capital is the total money tied up in the business.
- The Operating Approach formula is
- The Financing Approach is
One shortcoming with ROIC is that it is a non-GAAP metric meaning the input data plugged into the ROIC formula is inconsistent.
SPGI’s financial profile during the 2019–2025 period was defined by the massive $44B IHS Markit merger, which caused a temporary structural dip in ROIC followed by a steady recovery through 2025 as synergies were realized.
Before the 2022 merger with IH Markit, SPGI was an exceptionally ‘asset-light’ business with an ROIC often exceeding 40% – 50%. The 2022 merger, however, fundamentally altered the denominator of the ROIC = NOPAT/Average Invested Capital equation.
In 2022 – 2023, upon closing the IHS Markit deal, SPGI’s invested capital base expanded significantly due to the large amount of goodwill and intangibles added to the balance sheet. This caused ROIC to drop into the low teens (10% – 13%) on a reported basis.
In 2024 – 2025, SPGI’s ROIC improved driven by cost synergies, margin expansion, and asset divestitures.
SPGI’s WACC remained relatively stable but faced upward pressure during the high-interest-rate environment of 2023–2024. It has, however, maintained a a STRONG capacity to meet its financial commitments.
Its cost of debt has stabilized as the company has proactively managed its debt maturity profile.
Like many of its peers in the financial data sector, SPGI’s WACC is estimated to sit in the ~8% – ~9.5% range. Its ROIC is ~10% – ~10.5% which implies that SPGI ROIC exceeds its WACC by low single digits (ie. ~0.5 – ~2.5%
Risk Assessment
SPGI has a target gross leverage range of 2 – 2.5 times trailing 12-month EBITDA. Given the expected loss of Mobility EBITDA, the current leverage of 2.3 times will increase to 2.4 times at FYE2026.
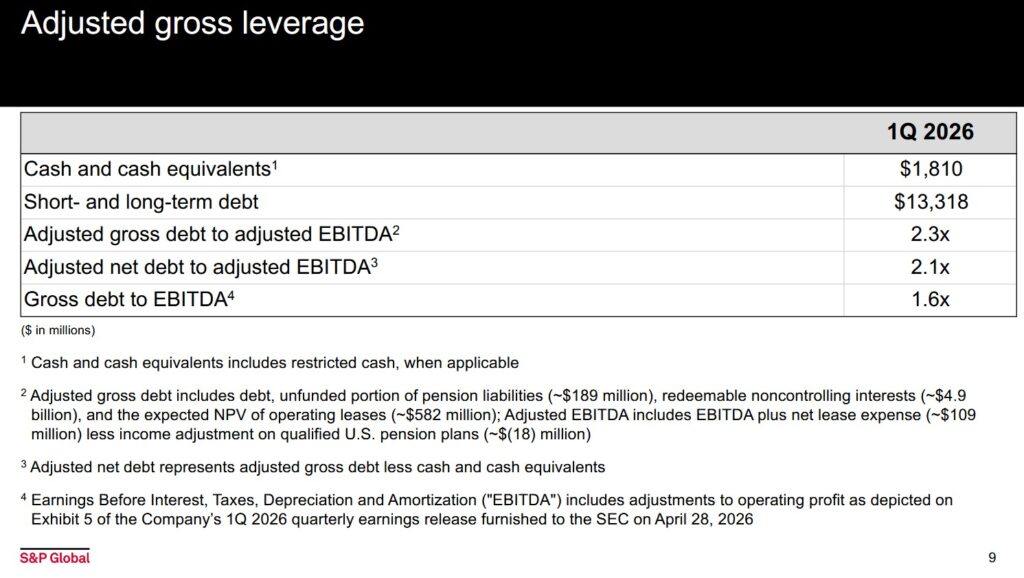
In conjunction with the spin-off of Mobility, ~$2B of debt will be issued. Proceeds will fund a cash payment to SPGI from which there will be a combination of incremental share repurchases and some debt reduction.
The company generates ample FCF and I see no reason why SPGI should not be able to meet its contractual short- and long-term obligations.
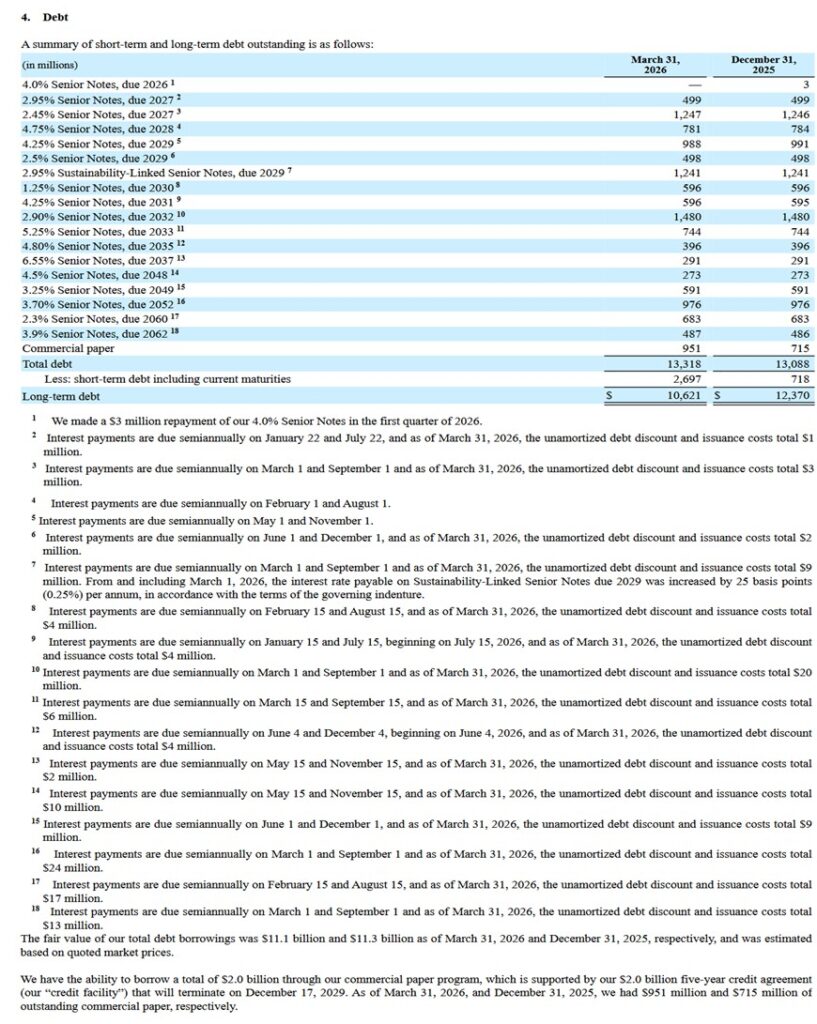
Moody’s continues to assign an A3 rating to SPGI’s domestic senior unsecured debt. This is the lowest tier within the upper-medium investment-grade group of ratings. This rating was affirmed on October 2, 2025.
This rating means SPGI has a STRONG capacity to meet its financial commitments. It is, however, somewhat more susceptible to the adverse effects of changes in circumstances and economic conditions than obligors in higher-rated categories.
SPGI’s credit risk is acceptable from my perspective.
Dividend and Dividend Yield
SPGI’s dividend history on its website only dates back to 1995 but its track record of consecutive years of dividend increases extends well beyond this.
At the end of May, we can expect SPGI to declare its second quarterly $0.97/share dividend.
I hold SPGI shares in taxable accounts. As a Canadian resident, I incur a non-recoverable 15% dividend withholding tax. In addition, I must declare dividend income annually. Being in the highest income tax bracket, I take ANOTHER ‘haircut’.
I prefer that a company:
- retain money to grow the business if it can generate returns well in excess of its cost of capital; and/or
- repurchase undervalued shares.
Share Repurchases
Following completion of the February 2022 ~$44B IHS Markit acquisition, SPGI’s weighted average diluted shares outstanding surged from 241.8 million shares in FY2021 to 318.5 million in FY2022 (see table in the Operating Cash Flow (OCF), Free Cash Flow (FCF), and CAPEX section of this post). By FYE2025 and the end of Q1 2026, the actual shares outstanding were 298.8 million and 296 million.
On the Q1 2026 earnings call, management states:
Given the strength and resilience of our business and our confidence in its long-term profitable growth, we believe the current share price reflects an attractive opportunity to increase our repurchases from the expected 85% of adjusted free cash flow to at least 100% or to roughly $4.5B for the year.
Valuation
On April 29 I acquired additional shares @ $428.775. Using this purchase price and SPGI’s $19.40 – $19.65 FY2026 adjusted diluted EPS outlook, the forward adjusted diluted PE range is ~21.8 – ~22.1.
The forward-adjusted diluted PE levels using the current share price and broker estimates are:
- FY2026 – 24 brokers – ~21.9 using a mean of $19.62 and low/high of $19.50 – $19.88.
- FY2027 – 24 brokers – ~19.4 using a mean of $22.09 and low/high of $21.46 – $22.68.
- FY2028 – 13 brokers – ~17.0 using a mean of $25.21 and low/high of $24.14 – $29.00.
NOTE: Revisions to these estimates are likely over the next few days.
SPGI’s FY2025 FCF using my modified method of calculating FCF is $4.899B (see the Operating Cash Flow (OCF), Free Cash Flow (FCF), and CAPEX (FY2019 – FY2025) section of this post). The weighted average diluted shares outstanding in FY2025 was 305.1 million, 297.6 million in Q1 2026 and 296 million at the end of Q1 2026.
As noted earlier, if SPGI’s valuation remains attractive, it could repurchase $4.5B of its outstanding shares in FY2026. It has already repurchased $1B thus leaving $3.5B in repurchases in the remainder of the current fiscal year. If it can repurchase shares at an average price of $460, this amounts to ~7.608 million shares. Keeping in mind that SPGI issues shares as part of its various employee compensation packages, I estimate SPGI could reduce the outstanding number of shares by ~7.5 million shares.
Deduct 7.5 million shares from the 296 million outstanding at the end of Q1 2026 and we arrive at 288.5 million shares. For calculation purposes, I estimate the weighted average diluted outstanding shares for FY2026 will be ~292 million.
In FY2024 and FY2025, SPGI generated $5.031B and $4.899B of FCF calculated using my modified method of calculating FCF. If it can generate $4.9B of FCF in FY2026 then SPGI should generate ~$16.78 of FCF/share ($4.9B/292 million).
Divide my $428.775 purchase price by $16.78 and the P/FCF is ~25.6. This is just slightly higher than my ~25 estimate in my February 11, 2026 post.
For the sake of comparison, this is what I reflect in my February 11, 2026 post:
SPGI projects a FY2026 adjusted diluted EPS of $19.40 – $19.65. This fell short of the Wall Street consensus of ~$19.96.
With shares trading at ~$401 at the February 10 market close, the forward adjusted diluted PE range is ~20.4 – ~20.7.
The forward-adjusted diluted PE levels using the current share price and broker estimates are:
- FY2026 – 25 brokers – ~20.5 using a mean of $19.59 and low/high of $16.62 – $20.04.
- FY2027 – 24 brokers – ~18.2 using a mean of $22.02 and low/high of $18.72 – $22.70.
- FY2028 – 11 brokers – ~16.1 using a mean of $24.90 and low/high of $24.25 – $25.94.
Considering SPGI just released its results, I fully expect these estimates to change over the next few days.
I place little reliance on earnings estimates beyond the next 4 quarters since much can change beyond this time frame. We also know that SPGI will spin-off its Mobility segment in late 2026. The current broker estimates will require amendments in due course to account for the spin-off.
SPGI’s FY2025 FCF using my modified method of calculating FCF is $4.899B (see the Operating Cash Flow (OCF), Free Cash Flow (FCF), and CAPEX (FY2019 – FY2025) section of this post). The weighted average diluted shares outstanding in FY2025 is 305.1 million. This gives us ~$16.06 FCF/share for FY2025. This is lower than the ~$17.90 FCF/share I calculate in my prior post. SPGI’s current ~$401 share price, however, is considerably lower than $512.96 on September 18. Divide ~$401 by ~$16.06 and the P/FCF is ~25. In my prior post I calculate P/FCF as being ~28.7.
We also know that at FYE2025, the number of diluted shares outstanding was 298.8 million. Divide FCF of $4.899B by 298.8 million and the FCF/share is ~$16.4. Divide ~$401 by ~$16.40 and the P/FCF is ~24.5.
Final Thoughts
At the time of my 2024 Year End Review, SPGI shares were trading at ~$496 and it was my was my 17th largest holding.
SPGI had become my 6th largest holding (350 shares in a ‘Core’ account and 200 shares in a ‘Side’ account in the FFJ Portfolio) and shares were trading at ~$527.30 when I completed my 2025 Mid-Year Portfolio Review.
It was my 4th largest holding (450 shares in a ‘Core’ account and 300 shares in a ‘Side’ account in the FFJ Portfolio) when I completed my 2025 Year-End Investment Holdings Review. Shares were trading at ~$522.59.
Following my 50 share purchase on April 29, my total SPGI exposure is 900.09676 shares.
AI’s impact on SPGI is subject to debate. It may disrupt SPGI’s business. I am, however, siding with management’s opinion that the benefits from AI are likely to outweigh any negative impact. Nevertheless, the recent heightened level of volatility and uncertainty is prompting me to lower my fair value estimate to ~$520 – ~$530 from my prior ~$560 – ~$570 estimate. The $40 reduction is similar to the reduction I reflect in my April 28 Moody’s post.
I wish you much success on your journey to financial freedom!
Note: Please send any feedback, corrections, or questions to finfreejourney@gmail.com.
Disclosure: I am long SPGI.
Disclaimer: I do not know your circumstances and do not provide individualized advice or recommendations. I encourage you to make investment decisions by conducting your research and due diligence. Consult your financial advisor about your specific situation.
I wrote this article myself and it expresses my own opinions. I do not receive compensation for it and have no business relationship with any company mentioned in this article.