![]()
Summary
- In an effort to increase my exposure to the Industrial Goods sector, I have recently increased my 3M (NYSE: MMM) exposure and have initiated a position in Stanley Black & Decker (NYSE: SWK). I am looking to increase my exposure further and have identified Illinois Tool Works (NYSE: ITW) as a candidate.
- I viewed ITW as too expensive in January 2018. The stock price has subsequently pulled back ~$36 from late January 2018.
- Earnings projections for FY2018 have been revised upwards for the 2nd time subsequent to ITW’s December 1, 2017 Investor Day.
Introduction
Currently, the only companies within the Industrial Goods space within our overall holdings are:
- 3M (NYSE: MMM)
- United Technologies (NYSE: UTX)
- Emerson Electric (NYSE: EMR)
- Stanley Black & Decker (NYSE: SWK)
In this regard, I have been looking to possibly add another industrial. I have been monitoring a few companies of which one is Honeywell (NYSE: HON). In my January 5, 2018 article I indicated I would bide my time for a more favorable entry point. While HON has retraced ~$7, I think there is a strong probability it will pull back further.
I also recently wrote about SWK and added shares of this company to our holdings.
The other industrial I have been monitoring is Illinois Tool Works (NYSE: ITW). Earlier this year I viewed it as too expensive. It has subsequently retraced ~$36 from the ~$179 high of late January 2018 and earnings projections have been revised upward twice subsequent to the December 1, 2017 Investor Day. I, therefore, thought it would be an opportune time to determine whether ITW warrants a position in our portfolio.
Business Overview
ITW was founded in 1912 and incorporated in 1915. It is a global manufacturer of a diversified range of industrial products and equipment with 85 divisions in 56 countries.
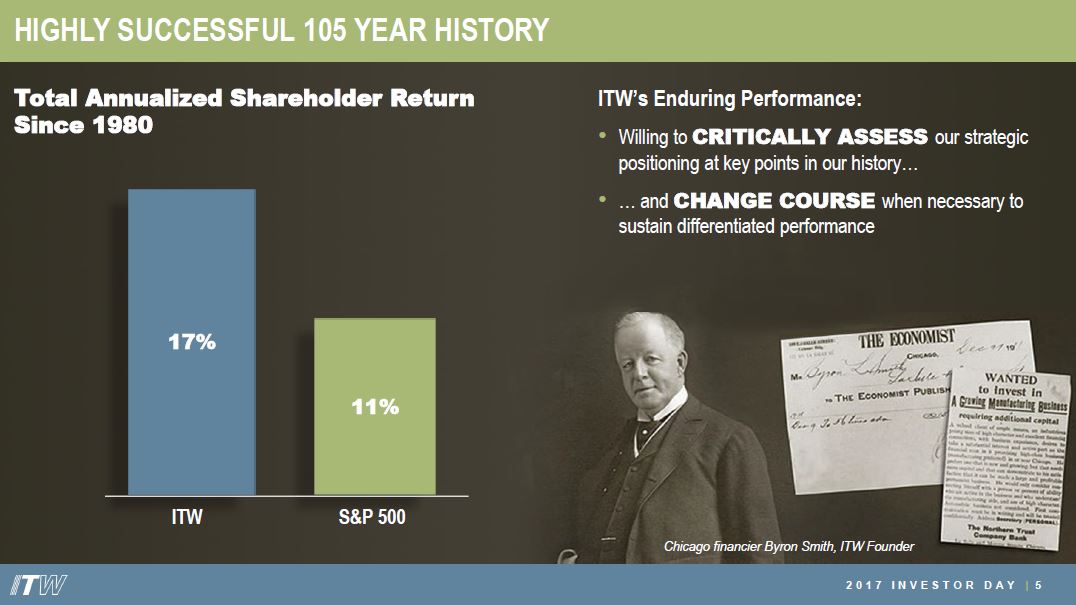
Source: ITW 2017 Investor Day Presentation – December 1 2017
Operations are organized and managed based on similar product offerings and end markets. There are 7 reporting segments:
- Automotive OEM;
- Food Equipment;
- Test & Measurement and Electronics;
- Welding;
- Polymers & Fluids;
- Construction Products;
- Specialty Products.
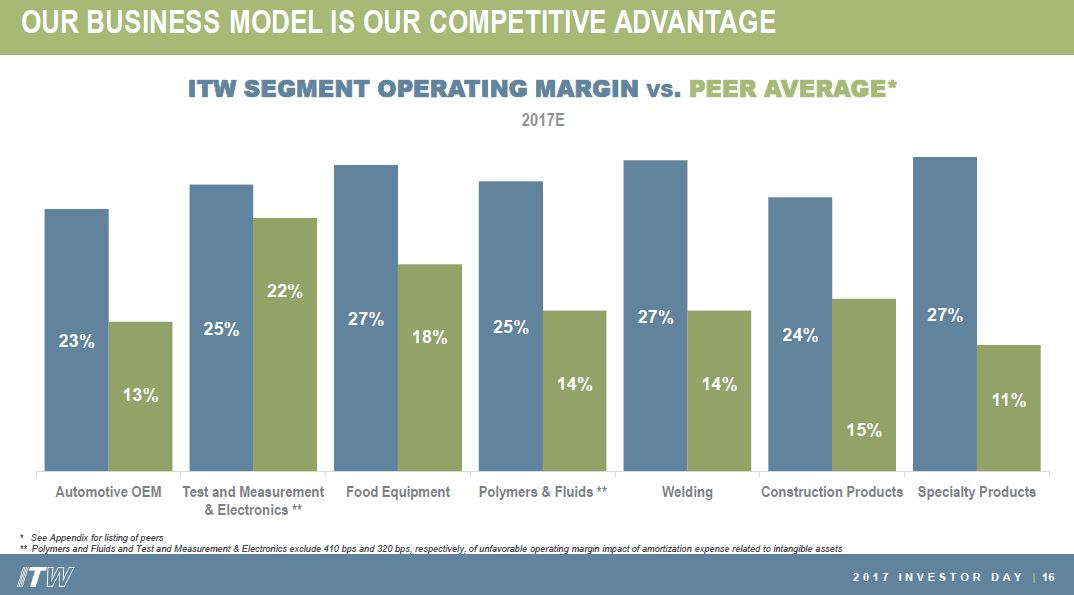
Source: ITW 2017 Investor Day Presentation – December 1 2017
Details of 2017 Revenue, Operating Margin, and Organic Growth Potential for each reporting segment can be found in ITW’s 2017 Investor Day Presentation of December 1, 2017.
ITW’s Business Model, comprised of 3 unique elements, is the company’s competitive advantage.
- 80/20 front to back process – this is the operating system that is applied in every ITW business. ITW focuses on its largest and best opportunities (the “80”) and eliminates cost, complexity and distractions associated with the less profitable opportunities (the “20″);
- Customer-back innovation – this is ITW’s unique innovation approach which is built on insight gathered from the 80/20 front to back process. The businesses position themselves as the go-to problem solver for their “80” customers. By focusing on understanding customer needs and subsequently creating unique solutions to address those needs, ITW has been able to add to its portfolio of more than 17,000 granted and pending patents;
- The decentralized, entrepreneurial culture enables ITW’s businesses to be fast, focused, and responsive. By combining a focused and simple organizational structure with outstanding execution, ITW delivers best-in-class services adapted to each business’ customers and end markets.
The following are ITW’s 2018 – 2022 Annual Performance Goals. If ITW achieves these goals, investors should be aptly rewarded.
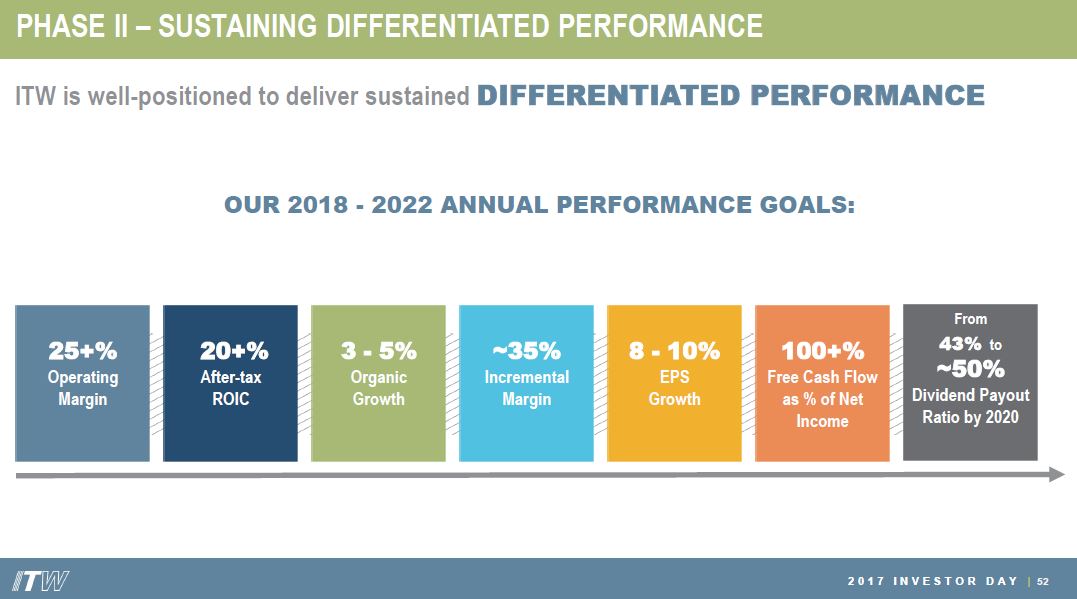
Source: ITW 2017 Investor Day Presentation – December 1 2017
Q1 2018 Results and 2018 Outlook
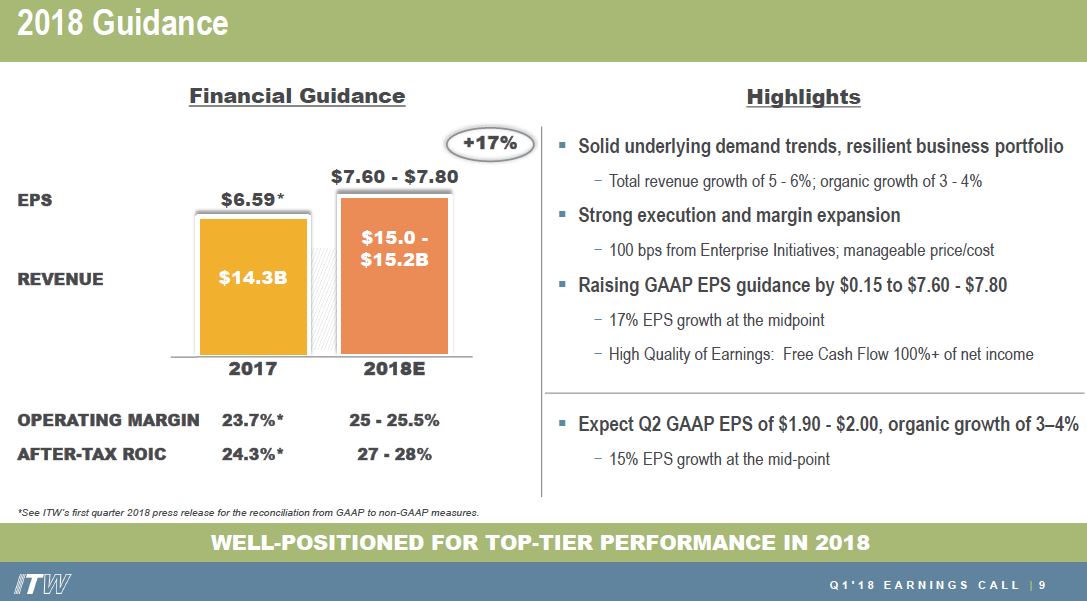
ITW reported Q1 2018 results and provided a revised forecast for FY2018 on April 26, 2018.
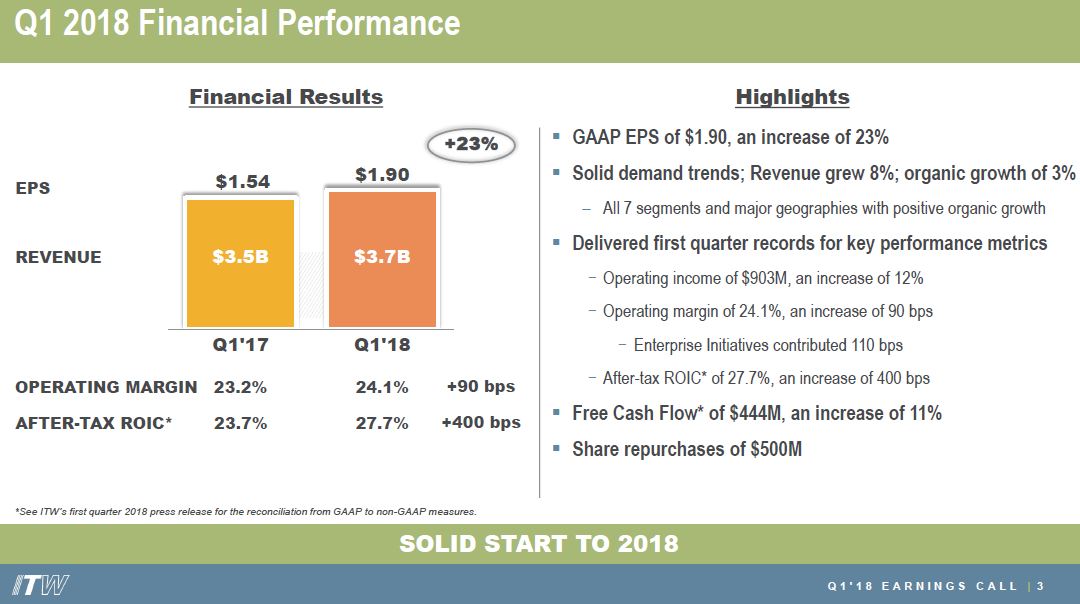
Source: ITW Q1 2018 Presentation – April 26 2018
Q1 2018 performance for each reporting segment can be found in the Q1 2018 presentation.
Company-wide revenue increased ~8% relative to Q1 2017 with solid demand trends and positive organic growth evidenced in all segments with Welding and Test & Measurement and Electronics both leading the way.
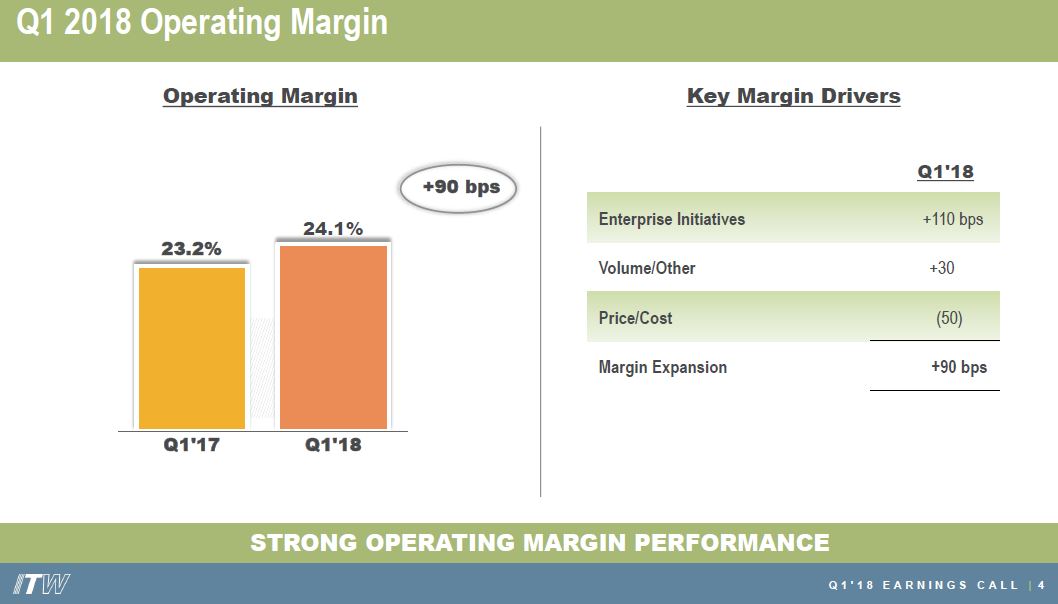
Operating margin improved 90bps to 24.1% (a new Q1 record) relative to Q1 2017 and after-tax return on invested capital was 27.7%, up 400bps, with ITW’s new lower tax rate being a key driver.
Free cash flow (FCF) was $0.444B, up 11% versus Q1 2017, and was 68% of net income.
ITW has repatriated over $1B in cash and expects to bring back another $1B by FYE2018. This has helped it accelerate its planned share repurchases to $0.5B in Q1.
The strategy is to recover raw material cost inflation with price adjustments on a dollar-for-dollar basis. That was achieved in Q1 and same is expected for the balance of FY2018.
ITW’s model is to source and produce where its sells products and management is currently assessing the impact of proposed tariffs. It has already incorporated what it knows about the impact of steel and aluminum tariffs into its business plan and guidance. Management has indicated it believes price/cost is manageable and it expects to continue to cover material and freight cost inflation going forward.
FY2018 EPS guidance has been raised to $7.60 – $7.80/share from $7.45 – $7.65; this is a 17% EPS growth at the $7.55 midpoint. Organic revenue growth of 3% – 4% for FY2018 is projected with enterprise initiatives having a 100 bps positive impact.
Credit Ratings
Moody’s rates ITW’s Senior Unsecured Long-Term Debt as A2 (mid-point of the upper medium grade) while S&P Global rates it A+ (top-end of the upper medium grade). Neither rating is under review.
These are relatively attractive credit ratings which gives me comfort that ITW should be able to continue to service its obligations.
Valuation
On December 1, 2017, ITW’s 2018 guidance called for GAAP EPS of $7.05 – $7.25 which included the settlement of a confidential legal matter. On that day, ITW closed at $164.87 thus giving us a forward PE range of ~22.74 – ~23.39.
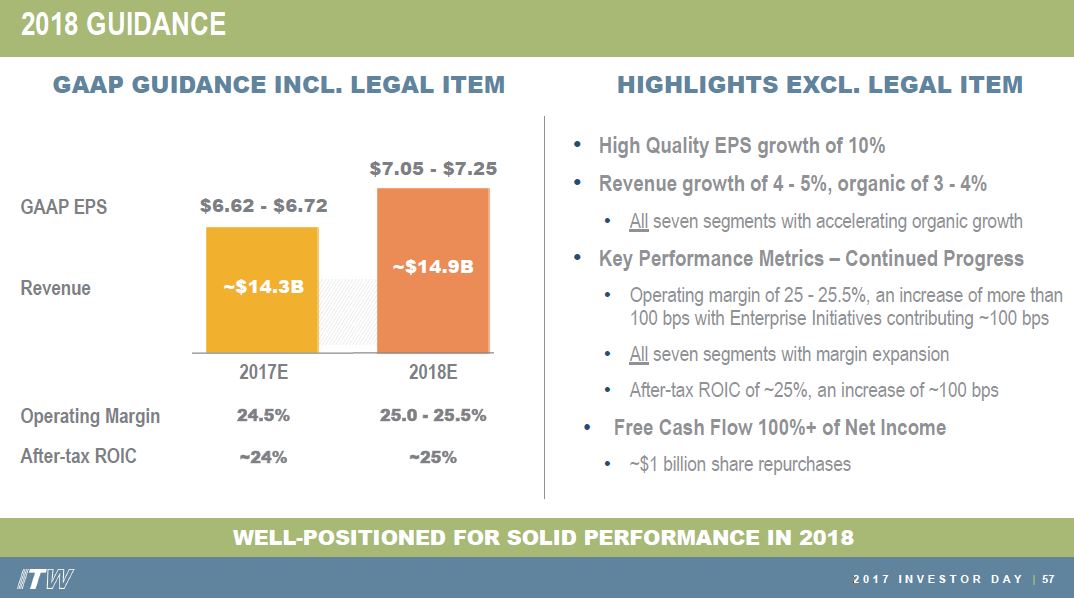
Source: ITW 2017 Investor Day Presentation – December 1 2017
When Q4 2017 results were presented January 24, 2018, ITW raised its GAAP EPS guidance to $7.45 – $7.65. ITW closed at $173.76 that day. Using these metrics, ITW’s forward PE range was ~22.71 – ~23.72.
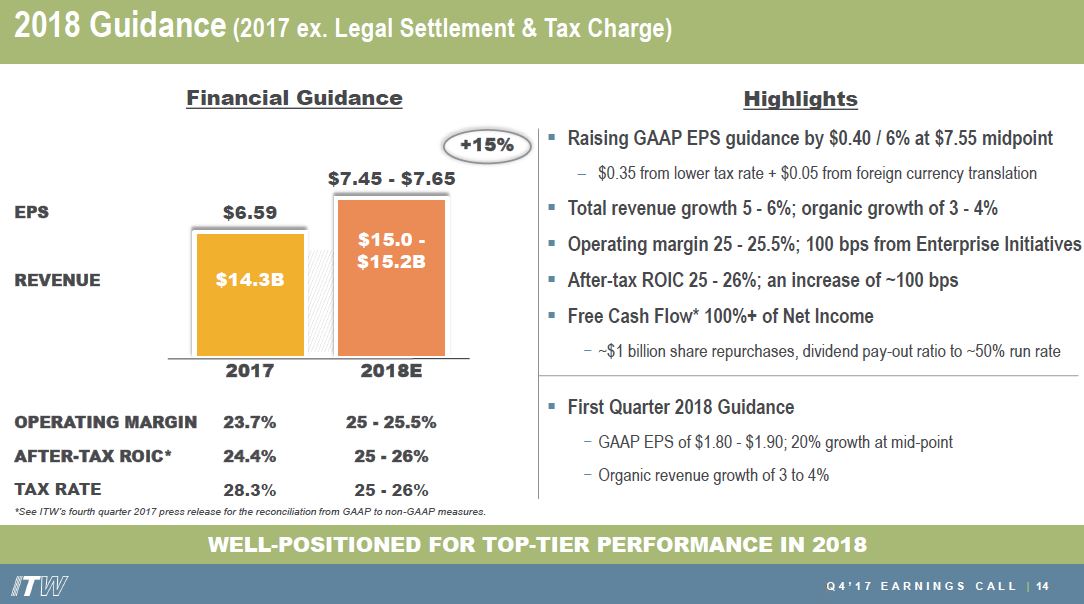
Source: ITW Q4 and FY2017 Presentation – January 24 2018
GAAP EPS projections have once again been revised. Now the projected range is $7.60 – $7.80. On April 26, 2018 when Q1 2018 results were released, ITW closed at $141.41. On this basis, ITW’s forward PE range is ~18.13 – ~18.61.
Source: ITW Q1 2018 Presentation – April 26 2018
This most recent valuation is far more attractive when I compare it to ITW’s 5 year average PE level of ~19.7.
Dividend, Dividend Yield, Dividend Payout Ratio, and Share Repurchases
One would expect that a company with a lengthy history of consecutive annual dividend increases would readily make information available on their website. ITW, however, has not. A 28 year dividend history, however, can be found here.
The following is the compound annual growth rate of ITW’s dividend for the 2008 – 2018 timeframe. As with many other companies within the Industrial Goods sector, dividend growth was scaled back during the Financial Crisis.
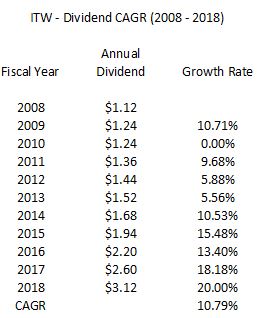
ITW is taking liberty with its claim that it has a 50+ year history of dividend growth. It kept its $0.31/quarter dividend constant for 8 consecutive quarters; it increased its $0.28/quarter dividend to $0.31/quarter half way through 2008 and increased its $0.31/quarter dividend to $0.34/quarter halfway through 2010.
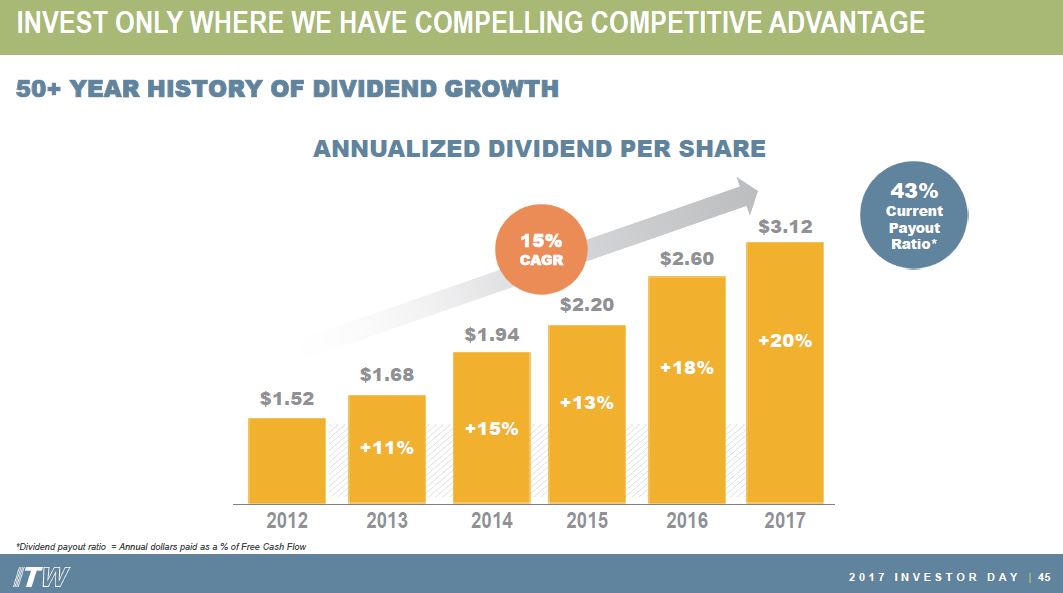
Source: ITW 2017 Investor Day Presentation – December 1 2017
On February 15, 2018, ITW’s Board of Directors declared a dividend on the company’s common stock of $0.78/share for Q1 2018 payable April 10, 2018 to shareholders of record as of March 30, 2018.
This most recent dividend represents the 3rd consecutive dividend at the $0.78 level. We can reasonably expect a 4th dividend at this level thus giving us an annual dividend of $3.12. This results in a ~2.19% dividend yield based on the April 27, 2018 $142.57 closing stock price.
Based on the recent projected GAAP EPS range of $7.60 – $7.80, the $3.12 annual dividend represents a ~40% – ~41% dividend payout ratio. If ITW’s Board of Directors decides to increase the quarterly dividend by ~15% to $0.90/share after the next quarterly $0.78/share dividend payable in mid July, the $3.60 annual dividend would represent a ~46% – ~47.4% dividend payout ratio. I view this dividend payout ratio as acceptable and it is keeping with ITW’s stated annual performance goal of increasing the dividend payout ratio to ~50% by 2020.
ITW has reduced the weighted average diluted common shares outstanding to 346.8 million as at FYE2017 (page 58 of 114 of the 10-K) from 556 million as at FYE2007 (page 74 of 136 of the 10-K).
Funding for the repurchase of ITW’s outstanding shares has come from profits generated through normal business operations and from a significant increase in long-term debt at extremely attractive interest rates (refer Note 8 on page 60 of 114 in ITW’s FY2017 10-K for which a link has been provided above). For comparison purposes, please refer to the schedule of ITW’s long-term debt as at FYE2007 found on page 91 of 136 of the FY2007 10-K. Looking at the interest rates on the long-term debt in both 10-Ks, it is readily apparent ITW has taken considerable advantage of the low interest rate environment over the last several years.
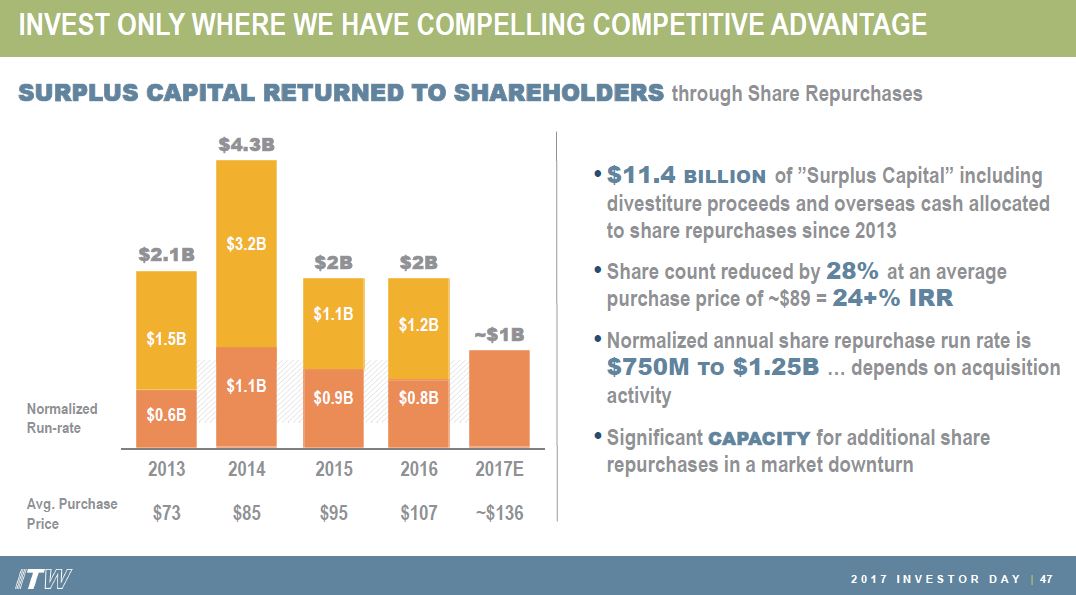
Source: ITW 2017 Investor Day Presentation – December 1 2017
Management has indicated that it intends to repurchase another ~$1B of outstanding shares in FY2018 using FCF.
Final Thoughts
It is entirely possible ITW could pull back further but I will readily admit that my ability to forecast stock prices over the short-term, especially in the current environment, is spotty at best. I am, however, relatively comfortable in my ability to determine whether a company will be less/more valuable well into the future.
In my opinion, ITW is a very well run company and I think it is now reasonably valued based on FY2018 projections; I intend to initiate a position shortly.
I wish you much success on your journey to financial freedom.
Thanks for reading!
Note: I sincerely appreciate the time you took to read this post. As always, please leave any feedback and questions you may have by clicking on “Contact Me” found below.
Disclaimer: I have no knowledge of your individual circumstances and am not providing individualized advice or recommendations. I encourage you not to make any investment decision without conducting your own research and due diligence. You should also consult your financial advisor about your specific situation.
Disclosure: I do not currently own shares in ITW but intend to purchase shares within the next 72 hours.
I wrote this article myself and it expresses my own opinions. I am not receiving compensation for it and have no business relationship with any company whose stock is mentioned in this article.