 Summary
- In my January 31, 2018 article I stated that I perceived Stanley Black & Decker to be overvalued despite the pullback from its early January highs. Subsequent to my previous article, SWK has retraced further.
- SWK released its Q1 2018 results on April 20, 2018 and has revised its GAAP EPS range to $7.40 – $7.60 from $7.80 – $8.00. Adjusted EPS guidance of $8.30 – $8.50 and a Free Cash Flow (FCF) conversion of ~100% were reiterated.
- SWK offers long-term growth potential and a lengthy record of annual dividend increases but yield hungry investors will likely overlook SWK because of its unattractive dividend yield.
Introduction
This Stanley Black & Decker (NYSE: SWK) article is a follow up to my January 31, 2018 article in which I indicated I was of the opinion that SWK was overvalued. I, therefore, indicated I would bide my time before initiating a position.
SWK is certainly an investor friendly company. It provides considerable investor information which can be viewed here.
Be aware that as I compose this article, the ‘Download Investor Presentation’ link takes you to a January 2018 presentation. This presentation does not reflect the very recent downward revised FY2018 Diluted GAAP EPS guidance. This article, however, provides my opinion on SWK as a potential investment taking into consideration the reduced GAAP guidance.
Vision and Strategic Imperatives
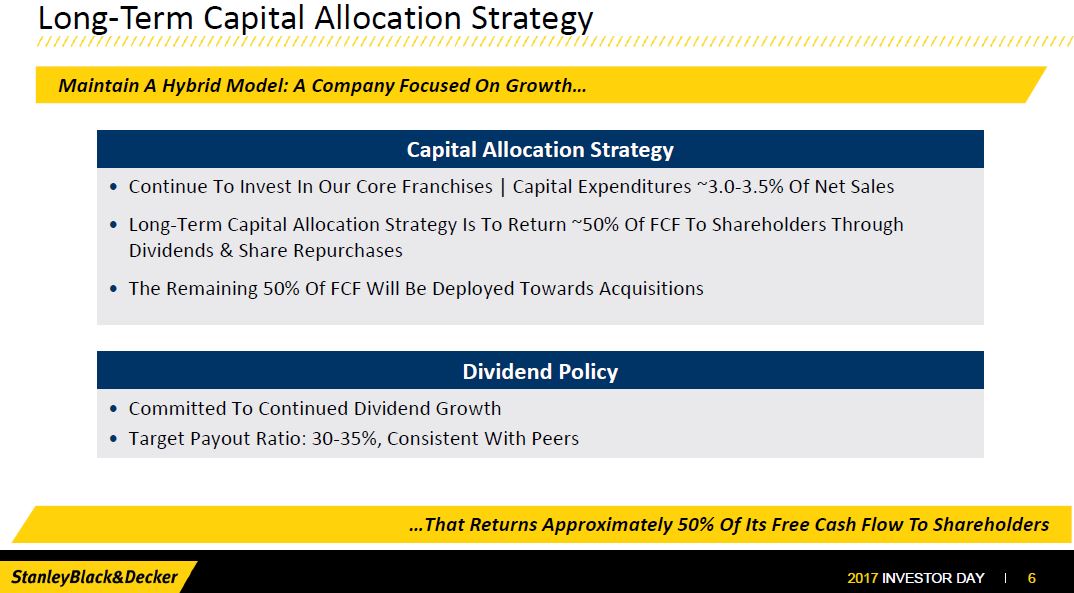
Many investors make investment decisions on the basis of short-term results. In my opinion, this is short-sighted. I, therefore, think it is important to ‘tune out the noise’ and to focus on management’s strategic vision and goals and objectives which it has communicated to its shareholders. In this regard, I strongly encourage you to review SWK’s Investor Day Presentation of May 16 2017.
The following are three key images from this presentation investors need to keep in mind when assessing SWK as a potential long-term investment.
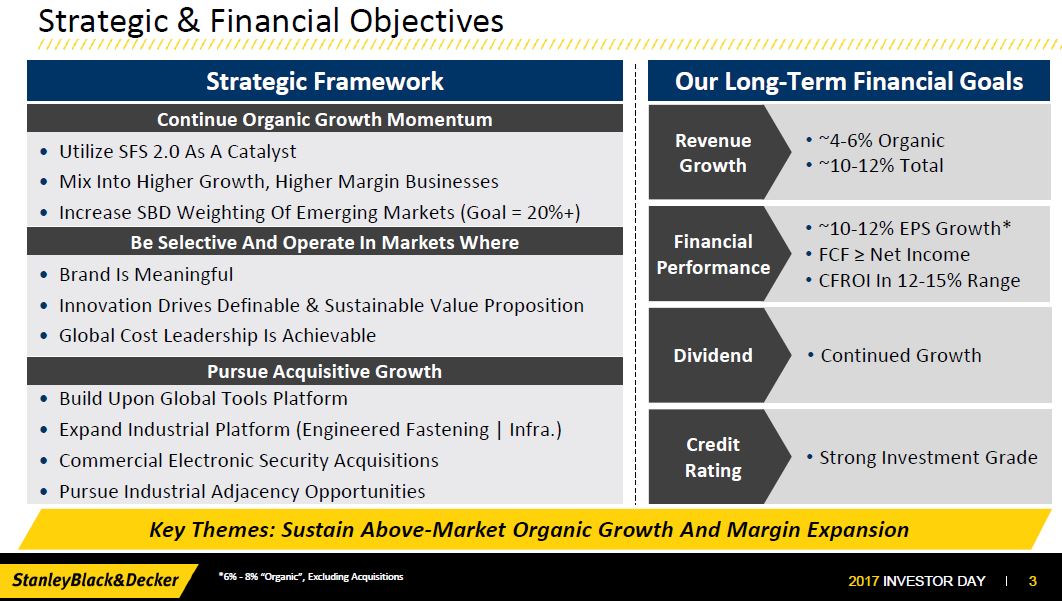
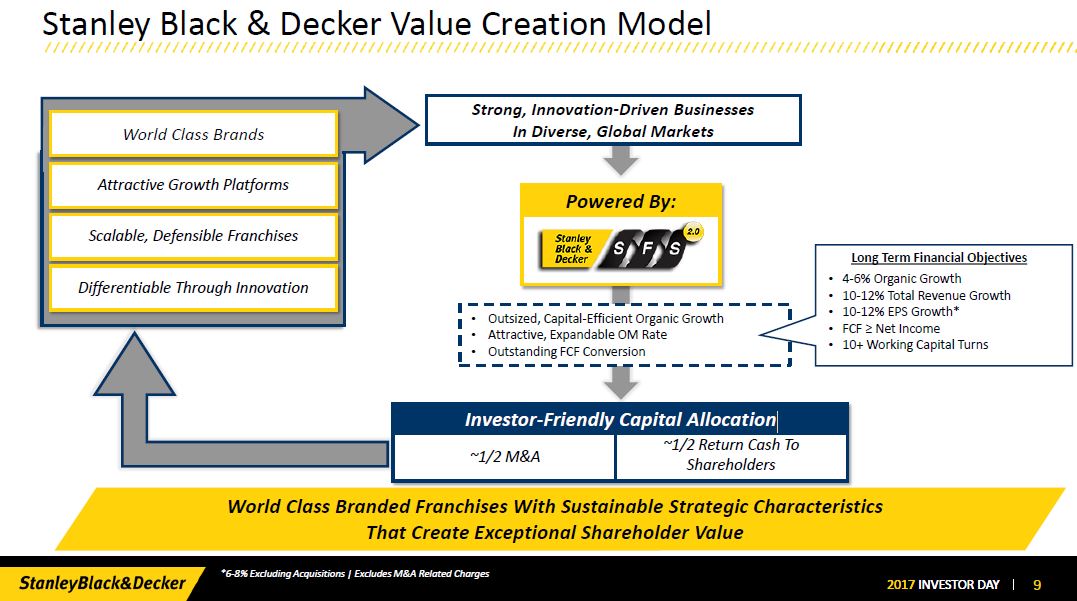
I view these long-term financial objectives as ambitious yet achievable. If they are achieved, SWK shareholders should be aptly rewarded if an investment in SWK is made at a reasonable valuation.
Q1 2018 Results
On April 20, 2018, SWK released its Q1 2018 results.
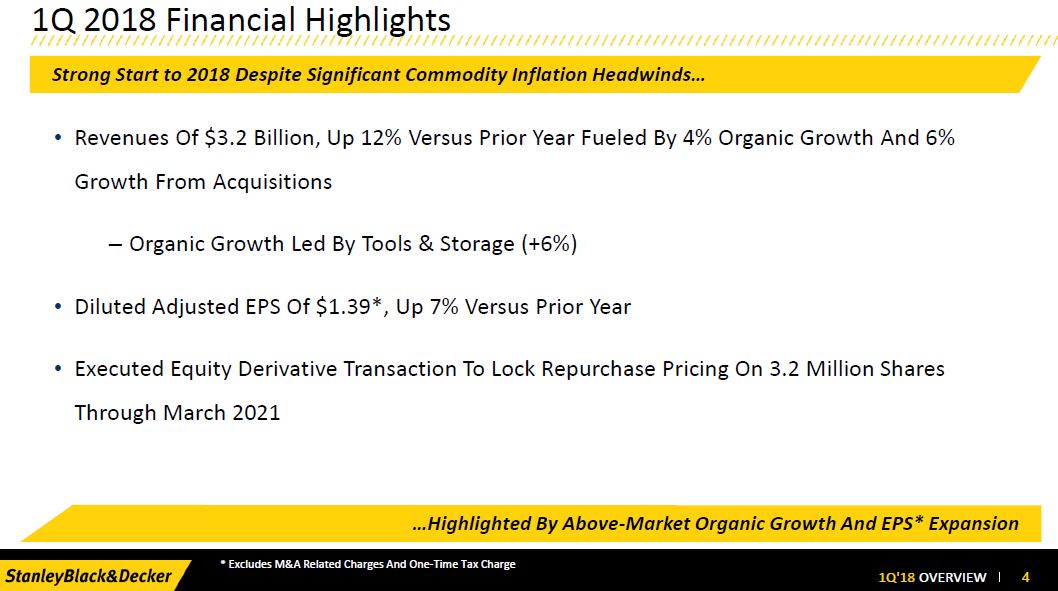
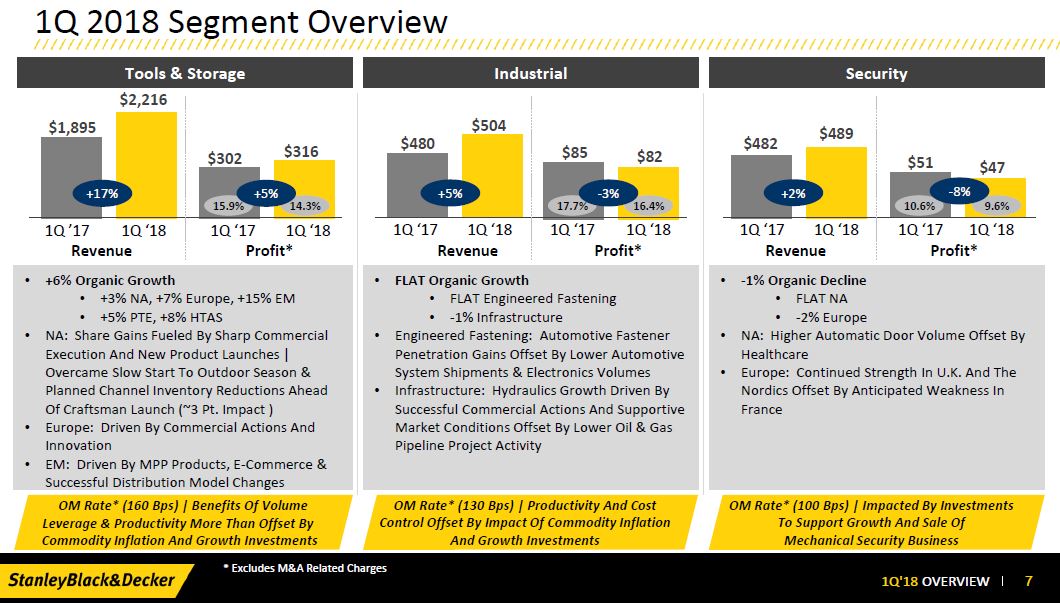
Source: SWK Q1 2018 Earnings Presentation – April 20 2018
If we exclude one-time charges, SWK had a reasonably strong start to FY2018 despite significant commodity headwinds.
On a GAAP basis, SWK has revised its FY2018 Diluted GAAP EPS guidance range to $7.40 – $7.60 from $7.80 – $8.00; adjusted EPS guidance of $8.30 – $8.50 and a FCF conversion of ~100% were reiterated. This downward revision is attributed to various charges related to mergers and acquisitions including Nelson Fasteners and the ongoing refinement of the one-time tax charge in the recently enacted U.S. tax legislation; SWK’s 32.4% tax rate includes a $23.1 million charge related to the refinement of the one-time tax charge from the recently enacted U.S. tax legislation. If we exclude these charges, SWK’s tax rate was 23.0% versus 25% in Q1 2017.
FY2018 Outlook
Management has made the following key assumption changes to SWK’s prior EPS outlook:
- Incremental price, cost and productivity actions as well as accretion associated with the Nelson Fastener Systems acquisition (+~ $0.15);
- Higher commodity inflation expectations, including the impacts from the recently announced steel and aluminum tariffs (-~ $0.15) – ~$180 million in higher commodity inflation.
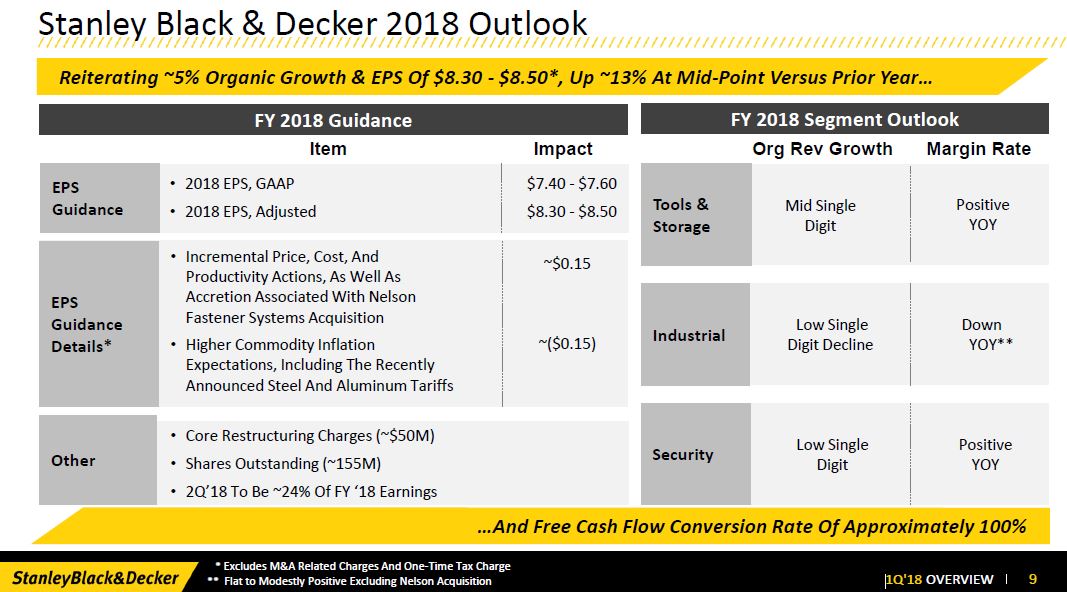
Source: SWK Q1 2018 Earnings Presentation – April 20 2018
Q2 earnings are expected to be 24% of FY2018 performance. This reflects the price/cost dynamic management referenced on its Q4 and FY2017 conference call. Benefits from price increases are expected late in Q2 which should result in a significant benefit commencing Q3.
SWK has historically experienced a free cash outflow in Q1 due to working capital seasonality and this past quarter was no exception. Management, however, continues to forecast a FCF conversion rate of ~100% despite some modest pressure year-over-year resulting from higher levels of inventory in Tools & Storage to support new product launches, including Craftsman.
FY2017 diluted adjusted EPS amounted to $7.45 (a ~14% increase from FY2016). This reflected strong operational performance and accretive acquisitions. FY2018 projections call for 5% organic growth with 13% adjusted EPS expansion from FY2017 levels despite the ~$180 million in commodity inflation.
The 5% projected organic growth is expected to contribute $0.50 – $0.60 of this 13% increase. Cost and productivity savings and acquisitions should provide another $0.45 – $0.50. Both should more than offset the $0.25 – $0.30 projected negative impact from commodity price inflation.
Valuation
At the time of my January 31, 2018 article, SWK had projected a GAAP EPS range of $7.80 – $8.00 and an adjusted diluted EPS range of $8.30 – $8.50 for fiscal 2018.
Using SWK’s January 30, 2018 closing stock price of $166.36, I arrived at a forward PE range of ~20.8 – ~21.3 and an adjusted PE range of ~19.57 – ~20.04.
Now that SWK’s stock price has retraced to $144.21 as at April 20, 2018 and SWK’s GAAP EPS range has been revised to $7.40 – $7.60 (the adjusted diluted EPS range remains unchanged), we now have a forward PE range of ~18.98 – ~19.49 and an adjusted forward PE range of ~16.97 – ~17.37.
I viewed SWK’s valuation at the end of January 2018 as being somewhat excessive. Despite the downward revision in SWK’s GAAP forecast I now view SWK’s current valuation as enticing.
Dividend, Dividend Yield, Dividend Payout Ratio, and Share Repurchases
SWK’s dividend history can be found here and its announcement of its 4th consecutive quarterly dividend at the $0.63 level can be found here.
At the time of my January 31st analysis, SWK’s dividend yield was ~1.5%. The pullback in SWK’s stock price, however, has now improved the dividend yield to ~1.75% ($2.52/$144.21).
The outlook for 2018’s adjusted EPS is $8.30 – $8.50/share. On this basis, SWK’s dividend payout ratio will be in the ~29.6% – ~30.4% range. If we use SWK’s revised projected GAAP EPS range of $7.40 – $7.60, the dividend payout ratio is ~33% – ~34%. This is right within SWK’s stated 30% – 35% target dividend payout ratio range.
I strongly suspect SWK will announce a dividend increase in July with respect to its September 2018 dividend. In my opinion, the dividend increase will be in the 4.5% – 7% range which will be similar to the 2015 – 2017 dividend increases.
SWK may be unappealing to investor focused exclusively on dividend income. The company, however, offers investors with the opportunity to generate capital gains over the long-term. Toward this end, SWK entered into a capped call transaction that provides it the right to purchase 3.2 million shares through March 2021. Management indicated ‘this transaction supports our long-term strategy to return approximately 50% of FCF to shareholders via dividends and opportunistic share repurchases.’
SWK had ~170 million shares outstanding in FY2011. The weighted average diluted shares outstanding in FY2017 amounted to 152.5 million but this represented a slight increase from FY2016’s level of ~148 million. SWK’s share count has subsequently increased from the FY2017 level but on the Q1 2018 earnings conference call, management indicated that it anticipates a reduction in share count to roughly ~155 million shares for 2018.
Final Thoughts
SWK’s transformation over the last few years has been somewhat of an under-the-radar success story in the U.S. industrial sector.
In 2015, management outlined its plan to open new industry verticals and to expand in emerging markets. The plan was also to improve operating margin and to increase FCF. The company has made good on these plans to date through operational improvements of which a reduction in working capital requirements has been front and center.
Operating margins in 2008 – 2010 were 10.4%, 10.3%, and 9.2%. In 2015 – 2017, operating margins were 14.2%, 14.4%, and 14%.
FCF in 2008 – 2010 was $376, $446, and $553 million. In 2015 – 2017, FCF was $870, $1138, and $976 million.
Despite these impressive improvements, I indicated in my January 31, 2018 article that I viewed SWK as being somewhat expensive. With SWK’s stock price having retraced ~$27/share subsequent to that article, I am now of the opinion investors initiating a position in SWK can expect to generate a reasonable long-term investment return.
I am now prepared to initiate a position through a non-registered account (for US readers this is a non tax advantaged account). My wife and I are at the stage where we must withdraw funds from our tax advantaged accounts prior to their conversion to retirement accounts which come with mandatory minimum annual withdrawal requirements. Failure to do this will place us in a position where all withdrawals will be taxed at the highest marginal tax rate.
Given that SWK shares will be purchased through taxable accounts, we will incur a 15% withholding tax on all dividend income. This will drop the SWK dividend yield to ~1.5% (($2.52*.85)/$144.21). I do not, however, view SWK as a dividend income investment. I view it primarily as an investment with the potential to provide long-term capital gains.
I wish you much success on your journey to financial freedom.
Thanks for reading!
Note: I sincerely appreciate the time you took to read this post. As always, please leave any feedback and questions you may by clicking on “Contact Me Here” at the bottom of this page.
Disclaimer: I have no knowledge of your individual circumstances and am not providing individualized advice or recommendations. I encourage you not to make any investment decision without conducting your own research and due diligence. You should also consult your financial advisor about your specific situation.
Disclosure: I do not currently own shares in SWK but intend to purchase shares within the next 72 hours.
I wrote this article myself and it expresses my own opinions. I am not receiving compensation for it and have no business relationship with any company whose stock is mentioned in this article.