
I last reviewed CME Group (CME) in this November 14, 2022 post at which time the most recently available financial information was for Q3 and YTD2022.
At the time of that post, my CME exposure consisted of 382 CME shares in a ‘Core’ account and 321 shares in a ‘Side’ account within the FFJ Portfolio. On November 28, 2022, however, I acquired another 50 shares @ ~$173.59.
In January, CME distributed its annual ‘special’ dividend. I also received the quarterly dividend in March and July which was automatically reinvested. My CME exposure is now 447 shares in a ‘Core’ account and 330 shares in a ‘Side’ account.
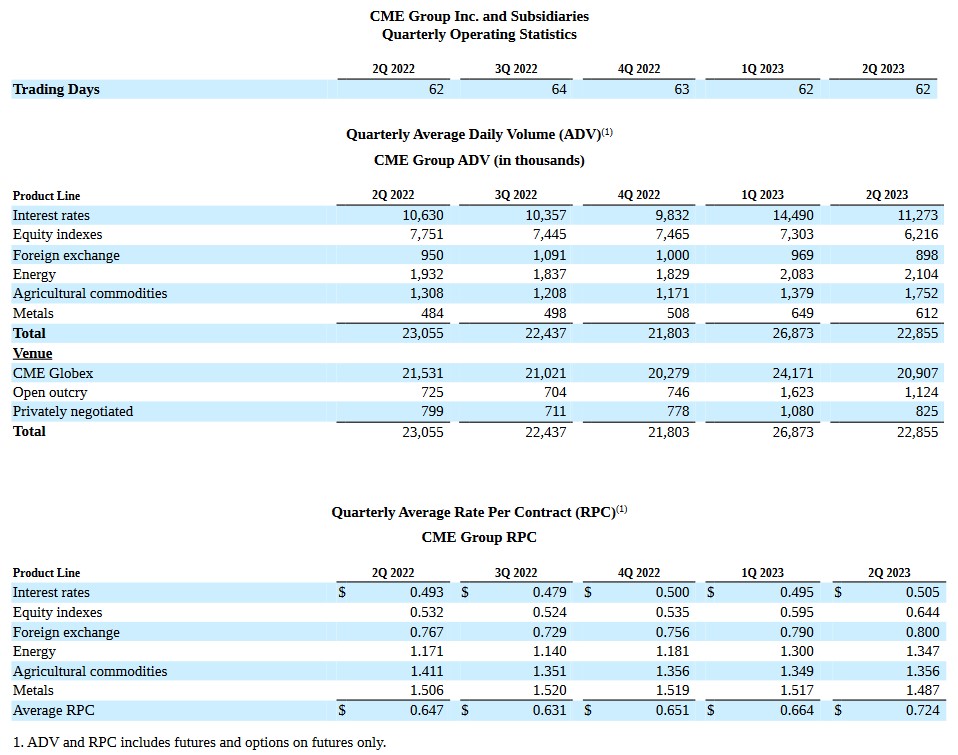
On July 5, CME reported its 2nd highest June and Q2 average daily volume on record. It then followed up with the release of Q2 and YTD2023 results on July 26.
This is an opportune time to revisit CME.
Overview
A high-level overview of the company is provided in previous posts that are accessible in the FFJ Archives. The best way to familiarize yourself with CME, however, is to read Part 1 in the 2022 Form 10-K.
Financials
Q2 and YTD2023 Results
CME’s Q2 and YTD2023 results are reflected in Form 8-K.
Revenue of ~$1.36B in Q2 2023 was ~10% higher than in Q2 2022 and ~$0.768B. Net Income Attributable to Common Shareholders was ~17.4% higher than in Q2 2022. YTD performance has been impressive but if we look at the quarterly average daily volume (see below), we see that volume can significantly vary from quarter to quarter based on market conditions; CME’s revenue is primarily transactional so it is extremely difficult to predict CME’s quarterly performance.
The same applies to NASDAQ, Inc. (NDAQ) which is precisely the reason why it recently announced its intent to acquire Adenza from Thoma Bravo for $10.5B in cash and shares of common stock; I touch upon this in my July 20 Nasdaq – Promising Long-Term Outlook post. Through this acquisition, NDAQ intends to increase the percentage of annual recurring revenue.
In recent quarters, options have become a larger part of CME’s global customers’ risk management and trading strategies. The YTD average daily volume in the options franchise across all asset classes is up 26%; the non-U.S. options business is up 33%.
CME is witnessing growing demand for weekly options expirations across all asset classes, with weekly options volume up 21% YTD and growing to 26% of total options trading.
In addition to equities, commodities traders have also embraced shorter-dated expirations. These allow CME’s global customers to hedge specific event risks such as crop reports and OPEC meetings.
Agricultural weekly options were up 168% in Q2, which contributed to a record quarter for agricultural products overall.
In energy, the West Texas Intermediate (WTI) weekly options grew 126% versus Q2 2022 and gold weekly options were up 33% YoY.
The strength of CME’s options franchise allows it to deliver significant capital and operational efficiencies to meet its customers’ needs for short-dated options to help them most effectively manage risk across their entire portfolio.
On the Q2 earnings call, the question arose regarding the potential for future M&A given M&A announcements from some of CME’s domestic and international peers.
Management responded that much can happen in the future. What will likely shape CME’s future, however, is the technology growth it has with its Google partnership. CME’s 10-year strategic partnership deal with Google Cloud will allow CME to transform derivative markets to cloud adoption. Co-innovation will also enable CME to deliver expanded access, new products and more efficiencies for more market participants. In conjunction with this new strategic partnership, Google made a $1B equity investment in a new series of non-voting convertible preferred stock.
CME thinks this strategic partnership with Google will allow it to do certain things its competitors may be unable to do. As a result, CME may not need to do M&A to accomplish its growth goals.
In addition, on July 18, CME and The Depository Trust & Clearing Corporation (DTCC), the premier post-trade market infrastructure for the global financial services industry, announced enhancements to their existing cross-margining arrangement. This will increase capital efficiencies for clearing members that trade and clear both U.S. Treasury securities and CME Group Interest Rate futures. The proposed changes, subject to regulatory approval, are expected to launch in January 2024.
CME has stated that it will only entertain M&A transactions that can strategically benefit its investors and clients.
Outlook
While CME has delivered double-digit adjusted earnings growth in each of the last 8 quarters, predicting volumes or market conditions over the short term is extremely difficult. However, over a 5-, 7- or 10-year period, CME has grown earnings by a compound annual growth rate of 10% – 12%. This growth has been achieved despite multiple periods of 0% rate policy and the impact of the pandemic on the global economy.
CME is ideally positioned to capitalize on the need for greater risk management. The plan is to accelerate growth through customer expansion, new product and service innovation while enhancing capital efficiency. Management has stated that its goal is to deliver growth in the coming decade above historical averages.
Credit Ratings
CME has yet to release its Q2 2023 Form 10-Q in which we can find the details of its debt. However, looking at CME’s schedule of outstanding debt found in the Q1 Form 10-Q, we see very little difference between the amounts owing at the end of Q1 and Q2.

Source: CME – Q1 2023 Form 10-Q
Looking at the Q2 2023 Balance Sheet (Form 8-K), no short-term debt was outstanding and the long-term debt outstanding was $3,423.8 (a very minor variance from the Q1 2023 balance owing).
We see from the schedule of outstanding debt that no debt matures until March 2025.
There are no changes to CME’s senior unsecured long-term debt ratings from those at the time of my November 14, 2022 post.
- Moody’s: Aa3 with a stable outlook
- S&P Global: AA- with a stable outlook
- Fitch: AA- with a stable outlook
All are the lowest tier of the high-grade category and are investment grade. These ratings define CME as having a VERY STRONG capacity to meet its financial commitments. It differs from the highest-rated obligors only to a small degree.
CME’s credit risk is acceptable for my purposes.
Dividend and Dividend Yield
CME’s dividend history is accessible here.
CME’s dividend policy targets a regular quarterly dividend of between 50% – 60% of the prior year’s cash earnings. In addition, CME declares its ‘special annual variable dividend’ within the first 2 weeks of December for distribution in mid-January.
NOTE: Since the implementation of the special annual variable dividend policy in early 2012, CME has returned over $21.5B to shareholders in the form of dividends.
This ‘special annual variable dividend’ increases or decreases from year to year based on operating results, capital expenditures, potential merger and acquisition activity and other forms of capital return, including regular dividends and share buybacks during the prior year.
Given how this ‘special annual variable dividend’ is determined, it is very difficult to predict the amount to be declared. I do, however, compare prior year results relative to the current fiscal year results at the end of Q3 to try and predict the upcoming ‘special annual variable dividend’.
When I wrote my November 14, 2022 post, I compared CME’s YTD2022 results against those for the first 9 months of the recent prior fiscal years. I envisioned the declaration of at least a $3/share ‘special dividend’. Based on 4 quarterly $1/share dividends plus the $3/share ‘special annual variable dividend’, investors who held shares since at least the beginning of 2022 would receive $7/share in total annual dividend income.
With shares trading at ~$174, I estimated a ~4% dividend yield.
CME ended up declaring a $4.50 special dividend on December 8 for distribution on January 18, 2023. As a result, my $7 estimate ended up being $8.50. Using the ~$174 share price, the dividend yield was ~4.88%.
I also anticipated that CME would declare a $0.05 dividend increase in February for distribution near the end of March. CME ended up declaring a $0.10 dividend increase; the quarterly dividend is now $1.10.
CME has not repurchased shares in recent years; the weighted average number of issued and outstanding shares in FY2011 – FY2022 (in millions) is 334, 332, 334, 336, 338, 339, 340, 344, 358, 359, 359, and 359. The weighted average number of issued and outstanding shares in Q2 2023 is still ~359.
While management continues to discuss alternative means by which to return capital to shareholders that includes share repurchases, the current dividend policy has appealed to CME’s shareholders. It is, therefore, unlikely that CME will start to repurchase shares in the foreseeable future.
Valuation
CME’s diluted PE in FY2011 – FY2022 is 12.92, 18.77, 27.53, 29.45, 24.22, 26.89, 33.12, 14.20, 35.28, 30.34, 33.70, and 22.94.
When I wrote my October 2021 post, CME had generated $5.60 in diluted EPS in the first 3 quarters of FY2021 and I envisioned FY2021 EPS of $7.45 – $7.50. Using the $7.475 mid-point and a ~$217 share price, I estimated a forward diluted PE of ~29.
Using the broker guidance from the two online trading platforms I use, CME’s forward adjusted diluted PE levels were:
- FY2021 – 17 brokers – mean of $6.63 and low/high of $6.20 – $7.07. Using the mean estimate, the forward adjusted diluted PE is ~32.7.
- FY2022 – 17 brokers – mean of $7.27 and low/high of $6.54 – $8.05. Using the mean estimate, the forward adjusted diluted PE is ~30.
- FY2023 – 15 brokers – mean of $7.89 and low/high of $6.80 – $9.14. Using the mean estimate, the forward adjusted diluted PE is ~27.5.
When I reviewed CME on February 9, 2022, it had recently reported $7.29 in FY2021 GAAP diluted EPS. With shares trading at ~$250, the diluted PE based on FY2021 results was ~34.3.
Using the current ~$250 share price and broker estimates, the forward adjusted diluted PE levels were:
- FY2022 – 19 brokers – mean of $7.34 and low/high of $6.83 – $7.89. Using the mean estimate, the forward adjusted diluted PE is ~34.
- FY2023 – 17 brokers – mean of $7.95 and low/high of $7.50 – $8.91. Using the mean estimate, the forward adjusted diluted PE is ~31.
- FY2024 – 3 brokers – mean of $8.34 and low/high of $7.86 – $8.85. Using the mean estimate, the forward adjusted diluted PE is ~30.
When I wrote my May 10, 2022 post, CME was trading at $201.60. Using the current broker estimates, the forward adjusted diluted PE levels were:
- FY2022 – 18 brokers – mean of $7.89 and low/high of $7.63 – $8.35. Using the mean estimate, the forward adjusted diluted PE is ~25.6.
- FY2023 – 18 brokers – mean of $8.44 and low/high of $7.84 – $9.33. Using the mean estimate, the forward adjusted diluted PE is ~24.
- FY2024 – 12 brokers – mean of $8.97 and low/high of $7.87 – $9.53. Using the mean estimate, the forward adjusted diluted PE is ~22.5.
On July 27, 2022, I acquired additional shares at $195.135. Using the current broker estimates, the forward adjusted diluted PE levels were:
- FY2022 – 17 brokers – mean of $7.91 and low/high of $7.33 – $8.23. Using the mean estimate, the forward adjusted diluted PE is ~24.7.
- FY2023 – 17 brokers – mean of $8.43 and low/high of $7.87 – $9.21. Using the mean estimate, the forward adjusted diluted PE is ~23.
- FY2024 – 12 brokers – mean of $8.88 and low/high of $8.14 – $9.94. Using the mean estimate, the forward adjusted diluted PE is ~22.
On November 14, 2022, shares were trading at ~$174. Using the current broker estimates, the forward adjusted diluted PE levels were:
- FY2022 – 14 brokers – mean of $7.98 and low/high of $7.82 – $8.07. Using the mean estimate, the forward adjusted diluted PE is ~22.
- FY2023 – 15 brokers – mean of $8.36 and low/high of $7.73 – $8.70. Using the mean estimate, the forward adjusted diluted PE is ~21.
- FY2024 – 13 brokers – mean of $8.69 and low/high of $7.96 – $9.38. Using the mean estimate, the forward adjusted diluted PE is ~20.
Shares closed at ~$199 on July 31. Using the current broker estimates, the forward adjusted diluted PE levels are:
- FY2023 – 17 brokers – mean of $9.03 and low/high of $8.81 – $9.27. Using the mean estimate, the forward adjusted diluted PE is ~22.
- FY2024 – 17 brokers – mean of $9.22 and low/high of $8.58 – $9.74. Using the mean estimate, the forward adjusted diluted PE is ~21.6.
- FY2025 – 10 brokers – mean of $9.77 and low/high of $8.96 – $10.34. Using the mean estimate, the forward adjusted diluted PE is ~20.4.
Despite the ~$25.41 share price increase from my ~$173.59 purchase price on November 28, 2022, CME’s valuation is almost the same.
Final Thoughts
When I completed my Mid 2023 Investment Holdings Review, CME was my 19th largest holding.
Although CME appears to be slightly undervalued, I am refraining from adding to my exposure. I am looking to increase my exposure in companies that are facing short-term headwinds and which appear to have temporarily fallen out of favour. CME is not such a company.
Rather than add to my CME exposure at this point, I will patiently wait in the hope of a better valuation at a later date.
I wish you much success on your journey to financial freedom!
Note: Thanks for reading this article. Please send any feedback, corrections, or questions to finfreejourney@gmail.com.
Disclosure: I am long CME.
Disclaimer: I do not know your circumstances and am not providing individualized advice or recommendations. I encourage you not to make any investment decisions without conducting your research and due diligence. You should also consult your financial advisor about your specific situation.
I wrote this article myself and it expresses my own opinions. I am not receiving compensation for it and have no business relationship with any company whose stock is mentioned in this article.