I last reviewed HD in this June 7, 2021 post at which time I concluded shares were too richly valued. HD’s share price subsequently ballooned to ~$420 toward the end of 2021. It has, however, now retraced to ~$303. This share price pullback piqued my interest and based on my analysis, I am now an HD shareholder. I share my thoughts in this post in the event you want to consider Home Depot (HD) for its attractive total investment return potential.
Overview
Most investors are undoubtedly familiar with HD to some extent. Investors who are slightly less familiar with the company are strongly encouraged to, at the very least, read Part 1 Item 1 in the FY2021 Form 10-K.
HD serves two primary customer groups…consumers and professional customers. Each group has very diverse needs and HD has developed varying approaches to meet them.
Within the Consumers group of customers are DIY (Do It Yourself) customers. These are typically homeowners who purchase products and complete their own projects and installations. There is also a second subset within this group, commonly referred to as the DIFM (Do It For Me) customers. This group of customers is the intersection of DIY customers and Professional customers. DIFM customers are typically homeowners who use Professionals to complete their projects or installations.
HD currently offers installation services in a variety of categories (eg. flooring, cabinets and cabinet makeovers, countertops, furnaces and central air systems, and windows). DIFM customers can purchase these services in HD stores, online, or in their homes through in-home consultations.
DIY customers propelled HD at the start of the COVID-19 pandemic as being homebound led to many homeowners tackling renovation projects. The Professionals business, however, has outpaced business derived from DIY customers in terms of growth over the past few quarters.
Professional customers include the likes of contractors, electricians, plumbers, etc. Although they represent less than 10% of HD’s customer base, they account for ~50% of FY2021’s ~$151B of sales. Such a large percentage of the business coming from professionals benefits HD because this group spends much more than DIY shoppers. In contrast, Lowe’s derives only ~20% – ~25% from the professional customer base.
HD has invested ~$11B in its stores, associates, digital experience, and supply chain over the past few years as it executes its One Home Depot Strategy.
HD is building 150 new distribution centres to help speed up the replenishment of store shelves and to quickly deliver purchases to Professional customers; some of these facilities are about as large as 14 football fields. These distribution centres are being strategically located so that HD can deliver large bulky items directly to job sites on the same day or next day basis to ~90% of the population in HD’s market.
This distribution network also works in tandem with HD’s e-commerce platform. HD has ~233 million website visits per month making it the 5th leading e-commerce website in the US behind Amazon, eBay, Walmart, and Etsy. Furthermore, HD’s sales from e-commerce channels have increased by ~100% over the last 2 years.
HD has noticed that customers who shop online often end up shopping for more products in conjunction with the pick up of their online order.
Management deems these investments necessary for it to continue to be the top choice among professionals. Professionals need access to a wide selection of inventory and they need it fast. This is why HD has rolled out features such as customized pricing, personalized offers, differentiated search results, sales support, tool rental, multi-location delivery, and a loyalty program.
On the Q4 2021 Earnings call, management highlighted a Professional customer in Dallas whose annual spending tripled from $100,000to $300,000 simply because they downloaded the mobile app, joined the ‘Pro loyalty program’, and started using delivery to make frequent planned purchases.
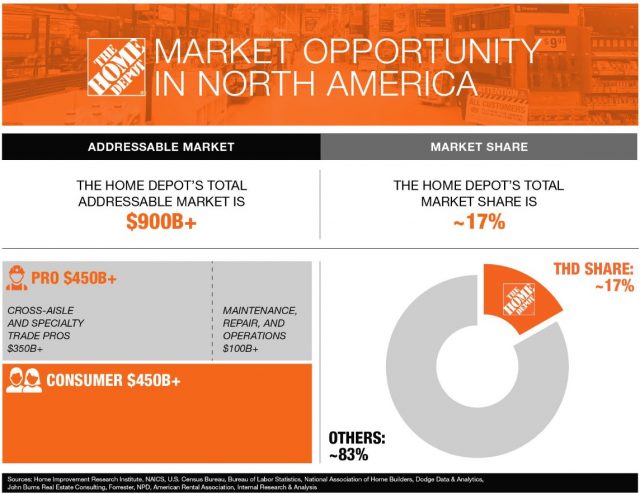
Management believes HD’s ability to serve the ‘Professional’ customer base will be an important driver of growth as it strives to reach a $200B sales milestone.
Financials
Q4 and FY2021 Results
On February 22, 2022, HD released Q4 and FY2021 results for the fiscal year which ended January 30, 2022. All material related to this earnings release is accessible here.
In comparison to FY2021’s ~$151B of sales, HD’s FY2019 sales were ~$110B. To put this in context, it took HD 9 years, from 2009 to 2018, to grow the business by over $40B.
In FY2021, operating expenses were ~18.4% of sales, a decrease of ~170 basis points from FY2020. HD’s operating expense leverage in FY2021 reflects a decrease in COVID-related costs that were partially offset by wage increases at the end of 2020 and throughout 2021.
During the year, HD opened 7 new stores and added 14 new stores through a small acquisition. HD reported a store count of 2,317 and retail selling square footage of ~241 million square feet at FYE2021. Total sales per retail square foot were ~$605 in FY2021, the highest in HD’s history.
FY2022 Outlook
On the FY2021 earnings call with analysts, management indicates that:
‘the broader housing environment continues to be supportive of home improvement. Demand for homes continues to be strong and existing home inventory available for sale remains near record lows, resulting in support for continued home price appreciation.’
Customer feedback suggests that the demand for home improvement projects of all sizes is healthy. While the consistent and resilient demand witnessed for home improvement is encouraging,
broader uncertainty remains about the impact of inflation, supply chain dynamics and how consumer spending will evolve. Establishing FY2022 guidance based on these macroeconomic fundamentals, therefore, is challenging.
As a result, management’s FY2022 guidance is based on the run-rate of dollar demand observed over Q3 and Q4 2021. This dollar run-rate is then adjusted for historical seasonality to calculate the sales outlook. Assuming there are no material shifts in demand, HD calculates that:
- Sales growth and comparable sales growth will be slightly positive;
- Operating margin will be relatively flat with FY2021 ~15.2%;
- Net interest expense will be ~$1.5B;
- The tax rate will be ~24.6%; and
- Diluted EPS growth will be in the low single digits.
The plan is to invest ~$3B in the form of capital expenditures in FY2022. This is in keeping with the annual expectation of ~2% of sales.
Operating Cash Flow (OCF) Free Cash Flow (FCF)
The Condensed Consolidated Statement of Cash Flows in the FY2011 – FY2021 Form 10-Ks reflect OCF of (in $B) 6.65, 6.98, 7.63, 8.24, 9.37, 9.78, 12.03, 13.17, 13.69, 18.84, and 16.57.
Back out capital expenditures (CAPEX) in FY2011 – FY2021 and FCF (in $B) is 5.43, 5.66, 6.24, 6.80, 7.87, 8.16, 10.13, 10.72, 11.01, 16.38, and 14.
Credit Ratings
HD’s senior unsecured domestic currency credit ratings remain unchanged from the time of my June 2021 review. The ratings and outlook are:
- Moody’s: A2 and stable;
- S&P Global: A and stable; and
- Fitch: A and stable.
These ratings are the middle tier of the upper-medium grade category and define HD as having a STRONG capacity to meet its financial commitments. However, it is somewhat more susceptible to the adverse effects of changes in circumstances and economic conditions than obligors in higher-rated categories.
These investment-grade ratings are acceptable for my purposes.
Dividends and Share Repurchases
Dividend and Dividend Yield
Investing solely based on dividend metrics is a poor way to make investment decisions. I think investors would be better served by looking at an investment’s total potential return (dividends and capital gains potential).
From a dividend perspective, HD was trading at ~$311 and the annual $6.60 dividend yielded ~2.1% (see HD’s dividend history) at the time of my June 7, 2021 post.
Fast forward to early April 2022 and the quarterly dividend is $1.90. With shares trading at ~$303, the $7.60 annual dividend yields ~2.5%.
During FY2016 – FY2021, HD has distributed $3.404B, $4.212B, $4.704B, $5.958B, $6.451B, and $6.985B for a total of ~$31.7B.
There is nothing foreseeable to raise a concern about HD’s ability to extend its track record of consecutive quarters of dividend payments.
Share Repurchases
In FY2016 – FY2021, HD repurchased $6.88B, $8B, $9.963B, $6.965B, $0.791B, and $14.809B of issued and outstanding shares for a total of ~$47.41B. The dramatic drop in the value of shares repurchased in FY2020 is because HD suspended share repurchases in March 2020 when COVID-19 hit North America. HD resumed share repurchases in Q1 2021.
Valuation
At the time of my previous post, HD had generated $11.94 of diluted EPS in FY2020 and $3.86 in Q1 2021. Management provided no guidance but I felt that FY2021 diluted EPS of ~$13.50 – ~$14 was not unreasonable. Using the current ~$311 share price, the forward diluted PE range was ~22.2 – ~23 and ~22.6 using the $13.75 midpoint.
Using the $13.75 midpoint and a forward diluted PE of 20 that I deemed to be a reasonable earnings multiple, I considered ~$275 to be a level at which I would consider initiating a position.
HD ended up generating $15.53 of diluted EPS in FY2021. Using a 20 PE, a ~$310 share price seems like a reasonable level at which to initiate a position. Shares, however, are currently trading at ~$303 so the PE is ~19.5 based on FY2021’s diluted EPS of $15.53.
By way of comparison, HD’s FY2011 – FY2021 historical PE levels based on diluted EPS are 18.04, 21.93, 22.25, 23.86, 24.77, 21.73, 26.29, 18.76, 21.71, 22.96, and 19.27.
HD’s adjusted diluted EPS guidance from 32 brokers was a mean of $14.16 and a range of $13.44 – $15.37 when I wrote my June 7, 2021 post. With shares trading at ~$311, the forward adjusted diluted PE range was ~20 – ~23 and ~22 using the mean guidance.
Now, the valuation levels based on the current ~$303 share price and adjusted diluted EPS broker estimates are:
- FY2023 – 31 brokers – mean of $16.10 and low/high of $15.65 – $16.85. Using the mean estimate, the forward adjusted diluted PE is ~18.8.
- FY2024 – 30 brokers – mean of $17.32 and low/high of $16.50 – $18.50. Using the mean estimate, the forward adjusted diluted PE is ~18.4.
- FY2025 – 12 brokers – mean of $18.54 and low/high of $17.73 – $19.21. Using the mean estimate, the forward adjusted diluted PE is ~16.34.
HD’s valuation using adjusted earnings estimates is superior to when I last reviewed HD.
What About Lowe’s?
As part of my HD analysis, I looked at Lowe’s (LOW), HD’s smaller major competitor.
LOW’s valuation based on forward diluted EPS guidance from analysts is more attractive. The valuation, based on the current ~$202.50 share price and adjusted diluted EPS broker estimates are:
- FY2023 – 30 brokers – mean of $13.48 and low/high of $13.10 – $13.91. Using the mean estimate, the forward adjusted diluted PE is ~15.
- FY2024 – 29 brokers – mean of $14.95 and low/high of $14.20 – $16.26. Using the mean estimate, the forward adjusted diluted PE is ~13.6.
- FY2025 – 14 brokers – mean of $16.75 and low/high of $14.20 – $19.95. Using the mean estimate, the forward adjusted diluted PE is ~12.1.
Several of HD’s financial metrics, however, are superior (eg. Operating margin, OCF, FCF, Return on Invested Capital).
Furthermore, while LOW’s domestic senior unsecured debt credit ratings are investment grade, I like that HD’s ratings are two levels above those assigned to LOW; LOW’s ratings are the top tier of the lower medium-grade investment-grade category.
- Moody’s: Baa1 and stable;
- S&P Global: BBB+ and stable; and
- Fitch does not rate Lowe’s.
The ratings define LOW as having an ADEQUATE capacity to meet its financial commitments. However, adverse economic conditions or changing circumstances are more likely to lead to a weakened capacity for LOW to meet its financial commitments.
Final Thoughts
In my recent FFJ Portfolio – March 2022 Report, I mention that after my February and early March purchases, I have found it to be increasingly difficult to identify attractive investment opportunities. HD, however, appears to have fallen out of favour with the broad investment community judging from the ~28.3% decline in share price from the 52 week high that was attained in December 2021.
Despite significant inflationary pressures, HD is likely to continue to benefit from a healthy degree of housing turnover. In addition, it is perpetually improving its merchandising and distribution network. Its flexible distribution network should lead to faster time to delivery thus improving the DIY experience and enabling it to continue to increase the level of business derived from the all-important ‘Professionals’.
On a final note, it is important to understand that HD is in an industry that is sensitive to economic fluctuations and especially spending trends tied to the housing market.
HD experienced strong headwinds during the Financial Crisis. If the US economy were to slip into another major recession, it is not beyond the realm of possibility that HD’s results could experience weakness. I, however, think HD is perhaps the strongest industry participant and is better positioned to weather a major economic downturn than its competition.
I like HD’s long-term outlook and consider shares to be reasonably valued. Therefore, I have acquired 200 HD shares @ ~$303/share in a ‘Side’ account within the FFJ Portfolio.
I wish you much success on your journey to financial freedom!
Note: Please send any feedback, corrections, or questions to finfreejourney@gmail.com.
Disclosure: I am long HD.
Disclaimer: I do not know your circumstances and do not provide individualized advice or recommendations. I encourage you to make investment decisions by conducting your research and due diligence. Consult your financial advisor about your specific situation.