![]() I last analyzed Paycom Software, Inc. (PAYC) in my November 7, 2025 post at which time the Q3 and YTD2025 results were the most recent. Although the Q4 and FY2025 results were released on February 11, the Form 10-K was only made available shortly before I departed on a ski vacation.
I last analyzed Paycom Software, Inc. (PAYC) in my November 7, 2025 post at which time the Q3 and YTD2025 results were the most recent. Although the Q4 and FY2025 results were released on February 11, the Form 10-K was only made available shortly before I departed on a ski vacation.
Although my ~$227.0705 average cost is well in excess of the current $117 share price I have no intention of ‘throwing in the towel’. The company is:
- profitable;
- essentially debt free;
- generates positive free cash flow;
- repurchases shares; and
- growing (albeit at a slower pace than a few years ago).
Business Overview
PAYC provides cloud-based human capital management (HCM) solution delivered as software-as-a-service (SaaS) for small to mid-sized companies predominantly located in the United States. It is, however, slowly expanding its international capabilities to accommodate US companies with international operations.
It offers functionality and data analytics that businesses need to manage the employment life cycle from recruitment to retirement. Its HCM solution provides a suite of applications in the areas of talent acquisition, including applicant tracking, background checks, on-boarding, e-verify, and tax credit services, and time and labor management, such as time and attendance, scheduling, time-off requests, and labor allocation solutions.
PAYC is currently transitioning from a period of hyper-growth to a strategy focused on operational efficiency and upmarket expansion. The current market share is estimate is less than 5% of the total addressable market. In an effort to grow market share it is significantly increasing its physical footprint and sales capacity.
In early 2025, PAYC opened new offices in Raleigh, Los Angeles, and Providence, bringing the total number of outside sales teams to 57. By early 2026, management indicated they had increased their specialized sales teams from 8 to 10 to better convert their new go-to-market pitch.
PAYC has traditionally served small-to-midsize businesses but is now prioritizing enterprise clients (companies in excess of 1,000 employees). In FY2025, revenue from clients with over 1,000 employees grew faster than the total revenue.
The company is aggressively moving beyond the US to diversify its revenue. Its software now supports users in over 180 countries and 15 languages. Following expansions into Canada and Mexico, PAYC officially entered the UK market in 2024. This serves as a beachhead for further European expansion, allowing it to capture multinational clients that previously required multiple disparate systems.
The company is betting that its Beti (automated payroll) and IWant (AI-driven navigation) tools will drive growth by improving retention and creating a moat around existing clients.
The best sources of information to learn about the company are PAYC’s website and the FY2025 Annual Report/Form 10-K.
Financials
Q4 and FY2025 Results
Details of PAYC’s Q4 and FY2025 results are accessible here.
At FYE2025, PAYC’s total assets were $7.599B. Back out $5.137B in funds held for clients and total assets amount to $2.462B. Of this amount, short and long-term deferred contract costs total ~$1.017B or ~41.3% of PAYC’s ‘true’ total assets. The value of this asset reflected on the FYE2026 Balance Sheet exceeds the value of Property and Equipment (~$0.687B)! It is, therefore, important to determine the extent to which we can ‘rely on this asset’.
Deferred contract costs is common for ‘Software as a Service’ (SaaS) companies. It does, however, create a specific profile of financial health we must closely monitor.
Deferred contract costs primarily represent the sales commissions and other incremental costs paid to acquire new customers. Under US GAAP, companies must capitalize the ‘incremental costs of obtaining a contract’ if they expect to recover those costs.
PAYC treats these costs as an asset from a ‘matching principal perspective. If it were to expense the full sales commission immediately upon signing a client, it would show a massive loss in the first month of the contract and artificial profit in later months. By capitalizing these costs PAYC ‘matches’ the expense to the revenue it generates over the life of the client.
GAAP rules define an asset as something that provides a future economic benefit. Since these commissions result in a multi-year contract that will bring in recurring revenue, the cost is seen as an investment in a future stream of income. Instead of hitting the income statement all at once, the costs of acquiring a client are amortized (expensed) over the estimated life of the client relationship. In the case of PAYC, this period is generally ~10 years but this period is regularly reviewed based on client retention data.
The ’10-year’ amortization period is management’s estimate. If a company uses a longer period than its competitors, its annual expenses will look lower and its assets higher, which can artificially inflate the stock’s valuation metrics.
Automatic Data Processing (ADP) and Paychex (PAYX) follow the same accounting standards as PAYC. They, however, use different amortization periods based on their specific customer retention data.
PAYX focuses heavily on small businesses. They generally go out of business or switch providers more frequently than the mid-to-large enterprises PAYC targets. PAYX, therefore, cannot justify a 10-year amortization period as easily as PAYC. It, therefore, must expense the costs of acquiring customers faster to match the reality of their shorter client lifespans. ADP, on the other hand, has the broadest mix of clients. It has a higher retention rate with its ‘major accounts’ (often 10+ years). The smaller client segment of its business sees more frequent turnover.
Should these companies suddenly increase their amortization period, investors need to step back and determine whether this change is justifiable. If the change is not justifiable, the change may be because the company wants to ‘boost’ reported earnings without actually improving the business.
The primary risk is that this asset only has value if the customers stay. If the business environment changes, what looked like an asset can quickly become a liability. If, for example, PAYC amortizes a commission over 10 years, but the client leaves after 5 years, the company must immediately ‘write off’ the remaining 5 years of that asset. A sudden spike in churn could lead to massive impairment charges.
Investors also need to consider that PAYC has disbursed the cash for these commissions but only a fraction is recorded as an expense. Given this, Net Income can look significantly better than Free Cash Flow (FCF). Healthy GAAP earnings supported by deferred costs can be misleading…..especially if a company is struggling with cash. Fortunately, this is not currently an issue with PAYC.
Another thing to consider with this ‘asset’ is that it has no resale value. Deferred contract costs cannot be sold to another company to recoup value. If a PAYC client goes under, PAYC must writedown to $0 the remaining value of the deferred asset associated with this failed client.
In FY2022 – FY2025, PAYC’s research and development (R&D) expenses amounted to $0.1483B, $0.199B, $0.2426B, and $0.2834B. Funding is predominantly provided from cash generated through normal business operations.
Total CAPEX of $0.275B in 2025 represented ~13% of total revenues compared to $0.197B or ~10% of total 2024 revenue as it invested ~$0.1B to expand its data center footprint and capabilities to support automation and AI initiatives.
On the Q4 earnings call, management focused on ‘full solution automation’ and the rollout of their latest AI tools.
The Beti (automated payroll) and GONE (automated time-off) solutions are significantly reducing labor costs for clients. Beti reportedly reduces payroll labor by up to 90%.
Much of the call focused on IWant, a new AI command-driven tool that allows users to navigate the platform via voice and text. Management expects this to drive higher engagement among ‘non-daily’ users.
Operating Cash Flow (OCF), Free Cash Flow (FCF), and CAPEX (FY2019 – FY2025)
PAYC deducts CAPEX from its net cash provided by continuing operating activities to determine its FCF. I address my rationale for also deducting share based compensation (SBC) when determining FCF in my How Stock Based Compensation Distorts Free Cash Flow post.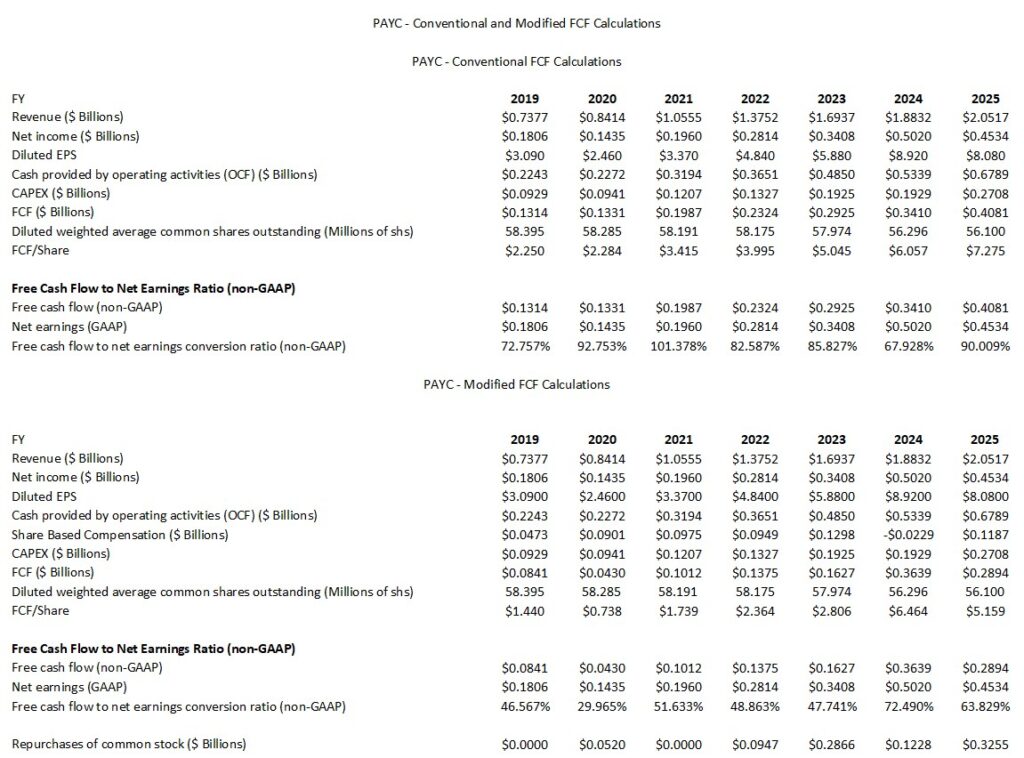
NOTE: The FY2024 SBC is negative because of the $117.5 million administrative credit recorded in Q1 2024. This was a one-time, non-cash accounting benefit resulting from the forfeiture of a 2020 CEO performance award.
In November 2020, PAYC granted founder and CEO (Chad Richison) a massive performance-based equity award consisting of 1.61 million shares. This award was designed to vest only if PAYC’s stock price hit extremely high targets (specifically $1,000 and $1,750 per share).
In February 2024, PAYC appointed a Co-CEO. Under the terms of the original 2020 agreement, the transition to a Co-CEO structure triggered the immediate termination and forfeiture of Chad Richison’s performance award.
Because PAYC had been gradually expensing the estimated value of this award over the previous years, GAAP rules required PAYC to reverse those previously recognized expenses once the award was forfeited. This reversal appeared as a $117.5 million credit (a reduction in expense) to the company’s General and Administrative expenses.
FY2026 Outlook
PAYC’s FY2026 outlook is:
- Total revenue of $2.175B – $2.195B, representing YoY growth of ~6% – ~7%. Analysts expected roughly $2.23B.
- Recurring and other revenue growth of ~7% – 8% YoY.
- Interest on funds held for clients of ~$0.103B.
- Adjusted EBITDA of $0.950B – $0.970B, representing a margin of ~44% at the midpoint.
- Full year GAAP and non-GAAP tax rates of 29% and 27%, respectively. The difference between the two is primarily attributed to the tax impact of stock-based compensation and non-deductible executive compensation under Section 162.
- Stock compensation of ~8% of total revenue. Based on the $2.185B midpoint of FY2026 revenue guidance, this implies an SBC expense of ~$0.175B.
Management’s cites a cautious macroeconomic environment, including hiring slowdowns and layoffs in several sectors, which impacts transaction-based revenue for why the company is providing a subdued FY2026 revenue outlook.
Competition remains intense but PAYC’s push into AI-driven automation is their primary differentiator to maintain pricing power.
On the Q4 2025 earnings call, analysts asked if the high EBITDA margins (43% – 44%) are being prioritized at the expense of faster revenue growth. Management indicates the focus is on ‘profitable, sustainable growth’ rather than buying market share.
ROIC and WACC
Return on Invested Capital (ROIC) provides an indication of a company’s efficiency. In essence, is a company actually creating value or ‘burning’ cash for the sake of growth?
A company with a higher ROIC is mathematically worth more because it requires less reinvestment to achieve that growth.
A good indication of how well a company is performing is to compare ROIC to the Weighted Average Cost of Capital (WACC). WACC, however, is not a metric officially reported by PAYC but it can be roughly estimated based on the company’s credit profile and market conditions.
The generally accepted high-level formula used by Wall Street is:
ROIC = NOPAT/Average Invested Capital
with the Net Operating Profit After Tax (NOPAT) formula being Operating Income (EBIT) x (1-tax rate)
This shows how much profit the core business makes while ignoring how much debt the company has.
The Average Invested Capital is the total money tied up in the business.
- The Operating Approach formula is
- The Financing Approach is
One shortcoming with ROIC is that it is a non-GAAP metric. This means the input data plugged into the ROIC formula is inconsistent.
PAYC continues to demonstrate high capital efficiency as it maintains a significant spread between its returns and its cost of capital.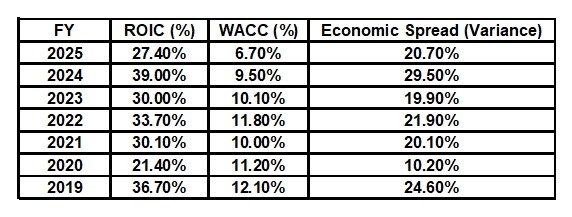
The $117.5M administrative credit recorded in Q1 2024 went straight to the bottom line, making the 2024 GAAP Net Income and Operating Income look much higher than the actual operational performance of the business. This is why the 2024 ROIC surged to 39%. Because this was a one-time benefit, the YoY comparison looks like a collapse in profitability. In reality, 2025 was a normalized year. The 2024 numbers were simply inflated by this non-cash accounting reversal.
Its ROIC is generally in the ~20% range and is excellent for the professional services and software industry.
The reason for the high ROIC is because of high gross margins (typically in the low 80s%) and the transition to more automated products like Beti, which reduces the human capital required to manage client accounts.
PAYC’s relatively low WACC is primarily due to its conservative balance sheet. The company maintains zero long-term debt and current/long-term operating lease liabilities total only ~$90 million at FYE2025.
PAYC maintains a healthy positive spread between ROIC and WACC which confirms the company is generating ‘excess returns’. The company’s stock price is struggling, however, because investors are concerned that while the quality of returns is high, the growth rate of the capital being deployed is slowing (as seen in the ~6% – ~7% revenue guidance growth for FY2026).
In the absence of debt on PAYC’s Balance Sheet we are essentially looking at Net Operating Profit After Tax (NOPAT) divided by the equity used to fund the business (minus excess cash). We do not have to worry about the tax savings from interest payments or adjusting for different types of high-interest debt instruments.
Sometimes companies with no/little debt can accumulate massive amounts of cash on their balance sheet. If we include all the cash in ‘Invested Capital’, the ROIC looks artificially low because cash earns almost nothing. To overcome this, we must try to determine how much is cash is required to run the business versus ‘excess cash’. If we fail to subtract the excess cash, we are not measuring how well the company runs its business but rather how well the company manages its cash.
While PAYC has little to no debt, its cash and cash equivalents at FYE2025 was only $0.37B. Short-term liabilities (excluding deferred revenue) are ~$0.203B. The ~$0.167B variance is not sufficiently meaningful for me to consider it as ‘excess cash’.
Risk Assessment
At FYE2025, PAYC had ~$0.370B in cash and cash equivalents. Current liabilities before client funds obligation (excluding deferred revenue of ~$28.3 million) was ~$0.2031B thereby leaving cash and cash equivalents ~$0.1669B more than all current liabilities.
PAYC has no long-term debt other than operating leases.
This existing holding satisfies my risk-averse investor profile.
Dividends and Share Repurchases
Dividend and Dividend Yield
PAYC has a brief dividend history having distributed its first quarterly dividend on June 12, 2023.
On February 10, 2026, PAYC issued a press release regarding the declaration of a $0.375/share regular quarterly cash dividend that was paid on March 23, 2026 to stockholders of record as of the close of business on March 9, 2026. The next declaration is likely to be made in the first week of May. I anticipate no change in the quarterly dividend.
Share Repurchases
In Q4 2025, PAYC’s share repurchase activity was:
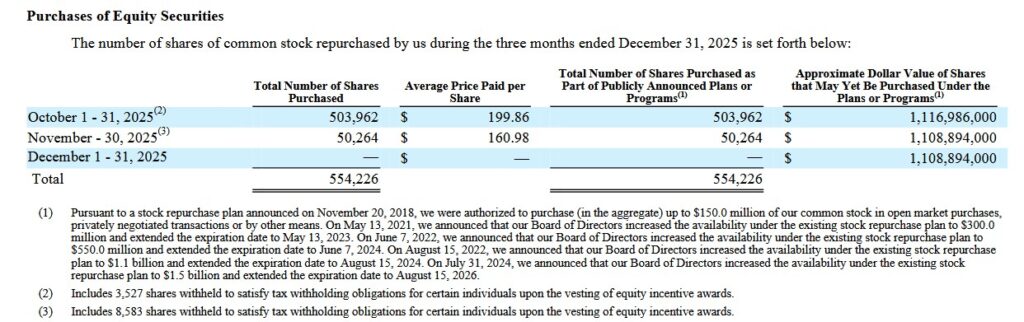
In FY2025, PAYC repurchased over 1.7 million shares, or ~3% of outstanding shares for a total of ~$0.37B. Since the beginning of 2023, PAYC has repurchased nearly 4.2 million shares, or ~7% of shares outstanding shares for ~$0.815B.
At FYE2025, PAYC had ~$1.1B remaining under its buyback authorization. On the Q4 earnings call, management states that it will continue to be an opportunistic buyer of PAYC shares.
As noted in my prior post, PAYC could enter into an accelerated share repurchase agreement (ASR) if the Board deems this to be an appropriate means by which to enhance shareholder value. The use of an ASR would allow it to efficiently repurchase shares, locking in cash deployment upfront while shifting market risk of share price fluctuations to the investment bank. They are often used when companies believe their stock is undervalued or want to consolidate ownership quickly. This strategy ultimately helps enhance shareholder value and supports strategic corporate actions.
Using an ASR, PAYC would quickly repurchase a large block of its outstanding shares through an investment bank. It would pay the bank upfront, and the bank would deliver most of the shares immediately by borrowing them, typically from institutional investors like mutual funds or pension funds. The bank would then gradually purchase shares from the open market to return the borrowed shares over an agreed period.
The purpose of an ASR is to reduce the number of shares outstanding faster than through traditional buybacks; this often boosts EPS and potentially strengthens a company’s share price.
This type of transaction is governed by a legally binding agreement between the company and the investment bank, outlining the repurchase amount, timeframe, price adjustment mechanisms based on volume-weighted average price (VWAP), and other terms.
Valuation
Using the current ~$117 share price and the current forward-adjusted diluted EPS broker estimates, the forward adjusted diluted PE levels are:
- FY2026 – 19 brokers – ~11.3 using the mean of $10.34 and low/high of $9.85 – $11.40.
- FY2027 – 18 brokers – ~10.2 using the mean of $11.44 and low/high of $10.65 – $12.59.
- FY2028 – 7 brokers – ~9.26 using the mean of $12.63 and low/high of $11.26 – $14.31.
In FY2024 and FY2025, diluted EPS was $8.91 and $8.08 while adjusted diluted EPS was $8.21 and $9.24 for a variance of $0.70 and $1.16. If PAYC generates $10.34 of adjusted diluted EPS in FY2026, diluted EPS is likely to be closer to $9.30. With the current share price being ~$117, the forward diluted PE is closer to ~12.6.
In FY2025, FCF was $7.275 and $5.159 (conventional and modified methods of calculation). PAYC’s FCF to net earnings conversion ratio is consistently below 100% and I anticipate no change in this regard in FY2027.
If PAYC’s FCF conversion ratio is ~90% in FY2027, PAYC’s FCF is likely to be ~$8.37 (90% of $9.30). With the current share price being ~$117, the forward diluted P/FCF is ~14.
If we use a ~65% modified FCF conversion ratio in FY2027, PAYC’s FCF is likely to be ~$6.05 (65% of $9.30). With the current share price being ~$117, the forward diluted P/FCF is ~19.3.
A fair price appears to be in the ~$130 – ~$140 range. Using the FY2026 $10.34 mean value in the adjusted diluted EPS broker estimates, a $135 share price gives us a forward adjusted diluted PE of ~13.
The forward P/FCF and a $135 share price gives us ~16.1 and ~22.3 (conventional and modified FY2027 FCF estimates).
Final Thoughts
PAYC’s market penetration remains below 5% of its total addressable market suggesting there are growth opportunities despite formidable competitors (ADP and PAYX) and current macroeconomic headwinds.
FY2023 – FY2025 annual revenue (in billions) was $1.6937, $1.8832, and $2.0517. Management’s FY2027 guidance is $2.175B – $2.195B representing growth of ~6.5% at the $2.185B mid-point. Despite a lower growth rate from a few years ago, I envision the company will grow its top line by at least 5% – 6% over the coming few years.
The company continues to shift from a high-growth ‘disruptor’ to a more mature, highly efficient AI-software provider. The efficiency metrics (margins and retention) are strong. The investment community, however, is skeptical of the single-digit revenue growth forecast for FY2026. This skepticism and the overall general market conditions have led to PAYC’s share price having fallen considerably over the past year.
When I completed my 2025 Year-End Investment Holdings Review, it was not a top 30 holding. I am not adding to my current exposure of 800 shares in a ‘Core’ account in the FFJ Portfolio.
Given PAYC’s attractive valuation I hope the company is opportunistically repurchasing shares.
I wish you much success on your journey to financial freedom!
Note: Please send any feedback, corrections, or questions to finfreejourney@gmail.com.
Disclosure: I am long PAYC, ADP, and PAYX.
Disclaimer: I do not know your circumstances and do not provide individualized advice or recommendations. I encourage you to make investment decisions by conducting your research and due diligence. Consult your financial advisor about your specific situation.
I wrote this article myself and it expresses my own opinions. I do not receive compensation for it and have no business relationship with any company mentioned in this article.