
I last reviewed Broadridge Financial Solutions (BR) in this August 9, 2023 post. At the time, BR had just released its Q4 and FY2023 results and FY2024 guidance. Now, we have BR’s FY2024 results and FY2025 guidance which were released on August 6.
Time to revisit this existing holding.
Business Overview
BR operates in two reportable segments, Investor Communication Solutions (ICS) and Global Technology and Operations (GTO), which are both highly competitive.
The majority of BR’s clients operate in the financial services industry. Its largest single client in FY2021, FY2022, FY2023, and FY2024 accounted for ~6%, ~7%, 7%, and 8% of consolidated revenues.
Part 1 Item 1 in the FY2024 Form 10-K is a good source of information to learn about the company.
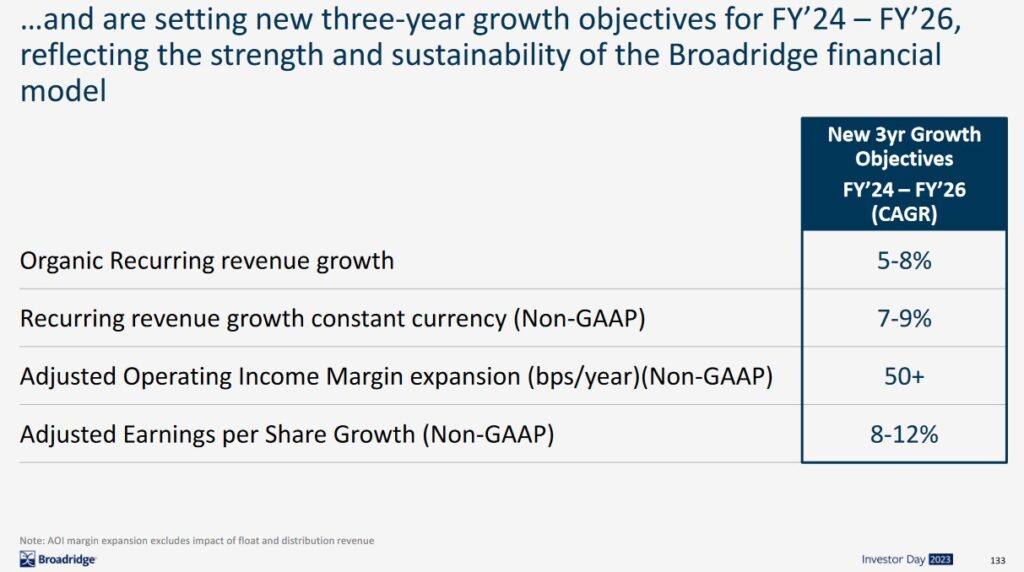
The December 7, 2023 Investor Day Presentation in which BR includes its new 3-year growth objectives for FY2024 – FY2026 is also an excellent source of information.
Acquisitions
BR has made several acquisitions over the years with FY2024 being no exception. These were the acquisitions during and following Q4 FY2024.
Kyndryl Securities Industry Services (Kyndryl): On May 13, 2024, BR announced this proposed acquisition to provide wealth management, capital markets, and information technology solutions to the Canadian financial services industry, thereby expanding BR’s product offerings in its GTO segment. The total purchase price is ~$0.2B with the acquisition being subject to closing conditions, including regulatory approvals. Upon closing, the Securities Industry Services (SIS) wealth and capital markets technology platform is expected to contribute $80 -$85 million in annual revenue. It is not expected to have a significant impact on BR’s margins and Adjusted EPS during the first year of ownership.
AdvisorTarget (AdvisorTarget): On May 30, 2024, BR announced the acquisition of this market leader in providing asset management and wealth management firms with data products to help power digital marketing, sales and engagement programs targeting financial advisors. The acquisition closed on June 1, 2024, for $35 million plus contingent consideration. AdvisorTarget is included in the BR’s ICS segment.
CompSci Resources (CompSc”): On July 1, 2024, BR announced the acquisition of this provider of cloud-based financial technology software for the preparation and processing of SEC filings for public companies and funds. The transaction is not expected to have a material impact on BR’s financial results. CompSci is included in BR’s ICS segment.
Financials
Q4 and FY2024 Results
Material related to BR’s Q4 and FY2024, including the FY2024 Form 10-K, is accessible here.
Operating Cash Flow (OCF), Free Cash Flow (FCF), and CAPEX
Annual CAPEX is computed by adding capital expenditures and software purchases and capitalized internal use software that is reflected on the Consolidated Statements of Cash Flows in the Form 10-K reports.
In FY2015 – FY2019, OCF, CAPEX, FCF, Non-GAAP Earnings, and FCF conversion were:
- OCF was (in B$) 0.617, 0.694, 0.516, 0.438, and 0.432.
- CAPEX was (in B$) 0.073, 0.098, 0.114, 0.076, and 0.066.
- FCF was (in B$) 0.544, 0.596, 0.402, 0.362, and 0.366.
- Adjusted Net earnings (Non-GAAP) (in B$): 0.307, 0.332, 0.378, 0.504, and 0.554.
- FCF conversion (%): 177, 180, 106, 72, and 66
The following reflects these metrics during FY2020 – FY2024.
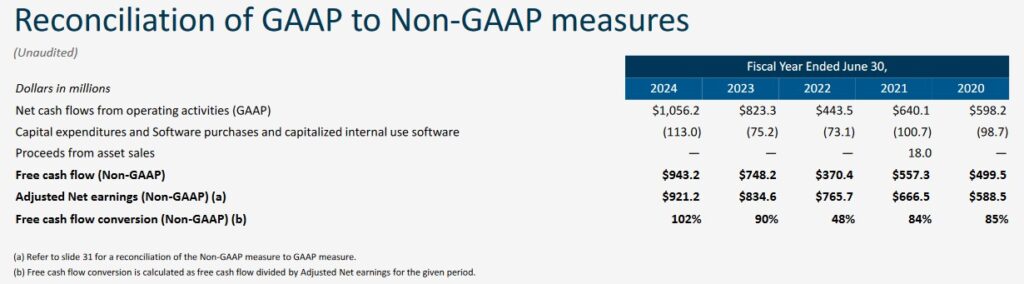
The FCF conversion level has returned to more historic levels after several years of higher investment.
Return On Invested Capital (ROIC)
High quality companies often generate a high ROIC. If a company generates a high ROIC, it needs to invest less to achieve a certain growth rate thus reducing the need for external capital.
When a company consistently generates a high ROIC over the long term and it is growing its revenue, it can reinvest a portion of its profits under favorable conditions thereby leading to a compounding effect. I would much rather invest in a growing company that can reinvest to create greater shareholder value than to invest in a company that has limited growth opportunities and thus chooses to distribute a growing dividend.
A company that generates $0.15/profit for every $1 invested, for example, achieves a ROIC of 15%. I consider a ~15%+ ROIC to be a reasonable minimum threshold because most of the time, a company’s cost of capital will be lower than this level. BR’s ROIC in recent years has not come remotely close to 15%!
When I initiated a position on February 11, 2009, my decision was partially based on historical double digit ROIC performance. In FY2014 – FY2023, BR’s ROIC (%) results were 19.64, 19.46, 17.03, 17.55, 21.50, 21.71, 15.70, 12.50, 10.13, and 12.43.
Capital Allocation
In my August 9, 2023 post I stated:
Given management’s expectation for a strong FY2024 that includes continued top and bottom line growth, record close sales, and higher free cash flow conversion, the plan is to return to a more balanced capital allocation. Management expects to make further progress in raising the firm’s Return on Invested Capital (ROIC) to the mid-to-high teens over the next three years which would be relatively similar to historical levels.
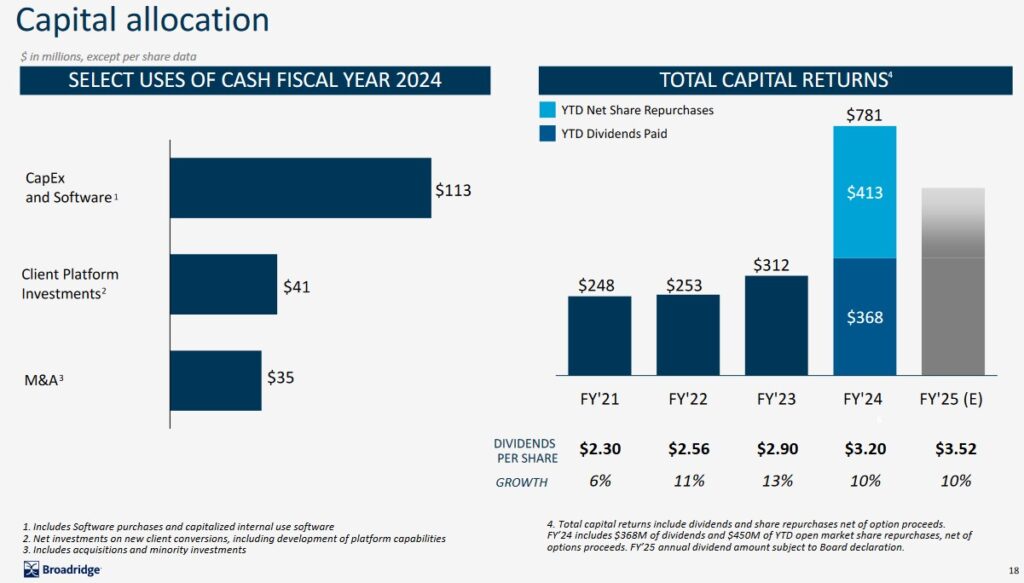
We see from BR’s capital allocation in FY2024 that the return of capital in the form of share repurchases and dividend distributions was more balanced than in prior years. In addition, this is the first year in the past several years that BR’s FCF conversion exceeds 100%.
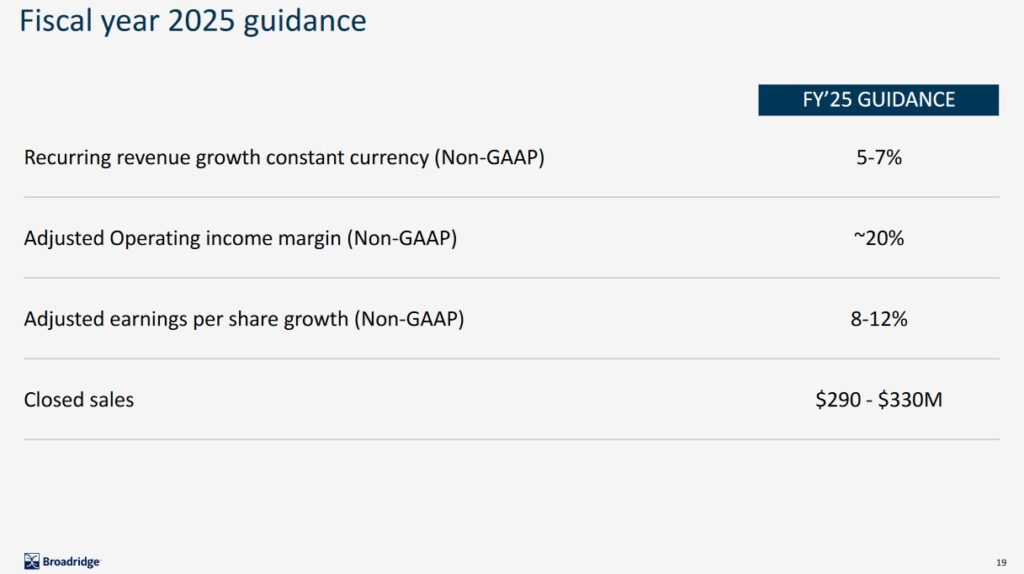
FY2025 Guidance
BR’s FY2025 recurring revenue growth constant currency of 5% – 7% will be almost all organic as it onboards its $0.450B revenue backlog.
ICS recurring revenue is expected to be at the higher end of this range and GTO at the lower end.
Expectations are for event-driven revenue to be at the high end of BR’s historic range driven by a proxy campaign at a major mutual fund firm in BR’s Q2 2025.
Distribution revenue is forecast to grow at low double-digit rate powered by higher postage rates and stronger Broadridge Communication Cloud print volumes. These low- to no-margin revenues will have a dilutive impact on reported margins.
The adjusted operating income margin guidance of ~20% anticipates the combination of higher operating leverage and disciplined expense management. BR expects to deliver over 50 bps of underlying core margin expansion, in line with its 3-year financial objectives. Partially offsetting this increase will be the impact of higher distribution revenues and lower float income.
Closed sales guidance of ~$0.29B – ~$0.33B excludes sales of tailored shareholder report solutions and does not include any impact from the impending SIS acquisition.
BR’s results are typically weak in the first half of its fiscal year.
BR’s Q1 2025 earnings will account for ~10% – ~11% of FY2025 adjusted EPS guidance driven in part by lower event-driven revenue versus Q1 2024 and the impact of the de-conversion of E-Trade; Morgan Stanley acquired e-Trade in 2020 and will be assuming the custody and clearing services provided by E*TRADE Securities.
BR expects FCF conversion of ~95% – ~105% in FY2025.
Risk Assessment
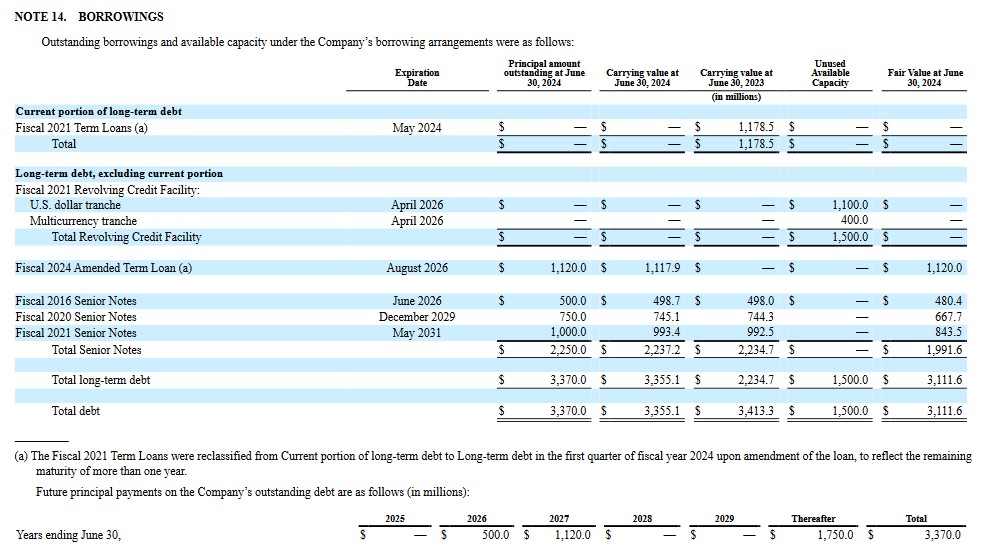
Note 14 within the FY2024 Form 10-K starting on page 80 of 305 has details of BR’s credit facilities.
In Q4, BR repaid $60 million of debt, ending the year with a 2.2x leverage ratio which is below the long-term target of 2.5x.
On August 21, 2023, the Fiscal 2021 Term Loan with a March 2024 expiration date was amended and now matures in August 2026; BR can voluntarily prepay the Fiscal 2024 Amended Term Loan in whole or in part and without premium or penalty.
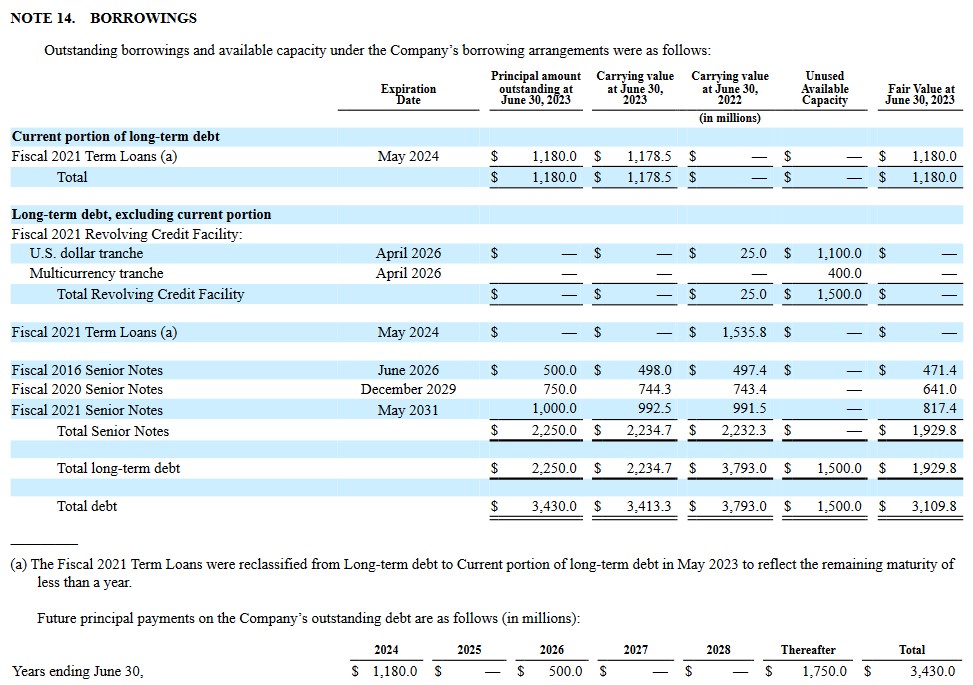
Details of BR’s credit facilities found in Note 14 within the FY2023 Form 10-K (page 77 of 406) are provided for comparison.
All BR’s domestic senior unsecured debt ratings are at the top tier of the lower-medium grade investment-grade category. There is no change from the time of my last review.
- Moody’s: Baa2 with a stable outlook. This rating was downgraded from Baa1 on May 15, 2023;
- S&P Global: BBB with a stable outlook. This rating was downgraded from BBB+ on June 13, 2023;
- Fitch: BBB+ and a stable outlook and affirmed on June 21, 2024. This rating is unchanged from the time of my prior reviews.
These ratings define BR as having an ADEQUATE capacity to meet its financial commitments. Adverse economic conditions or changing circumstances, however, are more likely to lead to a weakened capacity of the obligor to meet its financial commitments.
Despite the rating downgrades, BR’s credit risk remains acceptable for my purposes.
Dividends and Share Repurchases
Dividend and Dividend Yield
On August 5, 2024, BR’s Board declared a quarterly dividend of $0.88/share payable on October 3, 2024 to stockholders of record on September 12, 2024. This declaration reflects the Board’s approval of a 10% increase in the annual dividend from $3.20 to $3.52/share.
BR’s dividend history does not currently reflect this increase.
This increase marks the 12th double-digit increase in the past 13 years. In addition, BR’s annual dividend has increased every year since becoming a public company in 2007.
Using the August 6 $218.55 closing share price, the next 4 quarterly dividends yield ~1.6%.
Share Repurchases
The weighted average shares outstanding in FY2012 – FY2024 (in millions rounded) are 128, 125, 124, 124, 122, 121, 120, 119, 117, 118, 119, 119, and 119.
BR repurchased 2.3 million shares for ~$485.4 million in FY2024 under its share repurchase program; it repurchased no shares in FY2023 under its share repurchase program.
During Q4, BR repurchased 1,503,778 shares at an average price of $199.52.
At June 30, 2024, it had 7,251,347 shares available for repurchase under its share repurchase program.
Valuation
BR’s diluted PE in FY2012 – FY2023 is 21.58, 20.69, 22.86, 22.96, 26.21, 31.89, 25.46, 31.68, 38.01, 39.2, 30.48, and 36.55.
In FY2023, BR reported $5.30 and $7.01 in diluted EPS and adjusted diluted EPS. Management’s FY2024 guidance called for adjusted diluted EPS growth guidance of 8% – 12% giving us a range of ~$7.57 – ~$7.85. With shares trading at ~$176.86, the forward adjusted diluted PE range was ~22.5 – ~23.4.
BR’s valuation using broker estimates was:
- FY2024 – 8 brokers – mean of $7.57 and low/high of $7.36 – $7.80. Using the mean, the forward adjusted diluted PE is ~23.4.
- FY2025 – 7 brokers – mean of $8.38 and low/high of $8.02 – $8.68. Using the mean, the forward adjusted diluted PE was ~21.
- FY2026 – 2 brokers – mean of $9.27 and low/high of $9.05 – $9.49. Using the mean, the forward adjusted diluted PE was ~19.1.
The Condensed Consolidated Statements of Cash Flows for FY2020, FY2021, FY2022 and FY2023 reflect:
- Depreciation and amortization;
- Amortization of acquired intangibles and purchased intellectual property; and
- Amortization of other assets
totalling ~$0.300B, ~$0.335B, ~$0.464B and ~$0.425B. These significant non-cash items reduce EPS but have no impact on cash flow. I, therefore, look at BR’s valuation using FCF. BR’s Price/FCF per share was:
($748.2 million of FY2023 FCF/119 million diluted share O/S in FY2023) = $6.29 FCF/share
~$176.86 share price/$6.29 = ~28.1 P/FCF
BR’s valuation using P/FCF is higher than on an adjusted diluted PE basis.
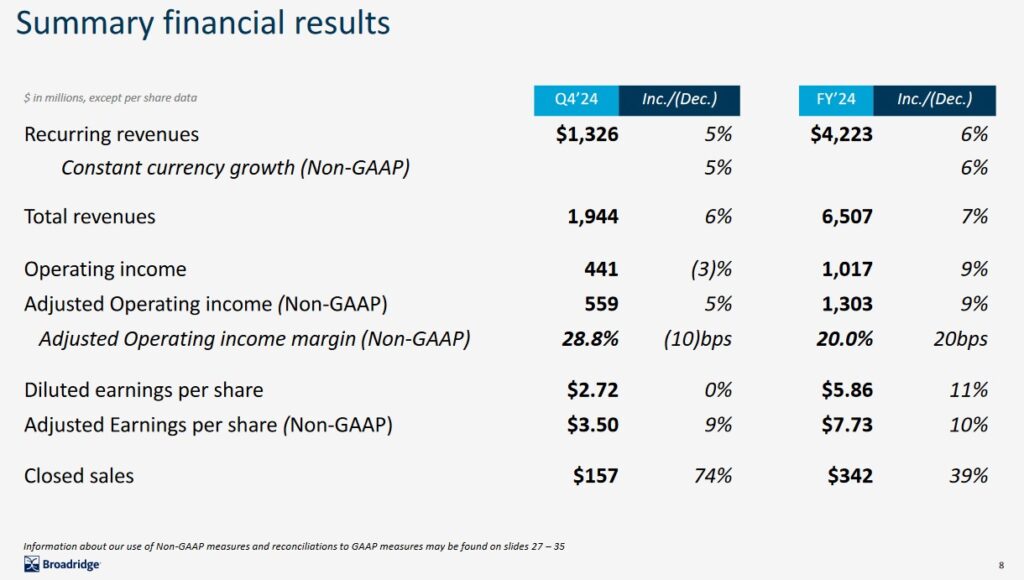
In FY2024, BR generated $5.86 and $7.73 of GAAP EPS and non-GAAP EPS. Using the August 6 $218.55 closing share price, the diluted PE and adjusted diluted PE are ~37.3 and ~28.3.
The FY2025 outlook calls for 8% – 12% growth in non-GAAP EPS or ~$8.35 – ~$8.66. Using the current ~$218.55 share price, the forward adjusted diluted PE is ~25.2 – ~26.2.
BR’s valuation using the current broker guidance is:
- FY2025 – 6 brokers – mean of $8.44 and low/high of $8.35 – $8.56. Using the mean, the forward adjusted diluted PE is ~25.9.
- FY2026 – 6 brokers – mean of $9.27 and low/high of $9.16 – $9.42. Using the mean, the forward adjusted diluted PE was ~23.6.
- FY2027 – 1 brokers – mean of $10.10 and low/high of $10.10 – $10.10. Using the mean, the forward adjusted diluted PE was ~21.6.
BR is focusing on higher free cash flow conversion with the FY2025 target being ~95% – ~105%.
If the FCF conversion is 95% of the non-GAAP EPS FY2025 outlook of ~$8.35 – ~$8.66, the FY2025 FCF range is ~$7.93 – ~$8.23. With shares currently trading at ~$218.55, the forward P/FCF range is ~26.6 – ~27.6.
If the FCF conversion is 105% of the non-GAAP EPS FY2025 outlook of ~$8.35 – ~$8.66, the FY2025 FCF range is ~$8.77 – ~$9.09. With shares currently trading at ~$218.55, the forward P/FCF range is ~24 – ~25.
Final Thoughts
My current exposure consists of 286 shares in a ‘Core’ account in the FFJ Portfolio and shares in a retirement account for which I do not disclose details.
BR was my 9th largest holding when I completed my 2023 Year End FFJ Portfolio Review It was not a top 30 holding, however, when I completed my 2024 Mid Year FFJ Portfolio Review. This is because I sold 549 shares @ ~$199 on June 5, 2024 for tax planning purposes (see June 11, 2024 post).
When I completed the 2023 YE and 2024 Mid Year reviews, BR’s share price was ~$200 and ~$200, respectively.
BR’s beta of 1.05 indicates its share price is just slightly more volatile than the broad market. The share price surge following the August 6 earnings release appears overdone – a pullback is a distinct possibility.
If I use a 102% FCF conversion of the non-GAAP EPS FY2025 outlook of ~$8.35 – ~$8.66, the FY2025 FCF range is ~$8.52 – ~$8.83. Should the share price retrace to ~$200, roughly the price at which I sold shares in June, the forward P/FCF range becomes ~22.7 – ~23.5. I would add to my exposure at ~$200 or less.
I wish you much success on your journey to financial freedom!
Note: Please send any feedback, corrections, or questions to finfreejourney@gmail.com.
Disclosure: I am long BR.
Disclaimer: I do not know your circumstances and do not provide individualized advice or recommendations. I encourage you to make investment decisions by conducting your research and due diligence. Consult your financial advisor about your specific situation.
I wrote this article myself and it expresses my own opinions. I do not receive compensation for it and have no business relationship with any company mentioned in this article.