The Canadian federal government’s proposed increase to the capital gains inclusion rate led us to revisit our estate plans. Based on guidance from our tax accountants, we liquidated all holdings within a specific investment account; I disclosed this in my June 11, 2024 FFJ Portfolio Adjustments Before Capital Gains Tax Changes Arrive post.
CME Group (CME is one of the companies in which I sold shares. I sold 340 CME shares held within a ‘Side’ account in the FFJ Portfolio @ ~$201.65 on June 5. On June 10, however, I repurchased 400 CME shares through a ‘Side’ account @ ~$198/share.
I last reviewed CME in my April 26, 2024 post at which time I indicated the nature of its business allows it to benefit from volatility; CME’s products help investors increase or lower their risk.
Now that we have Q2 and YTD2024 results, I revisit this existing holding.
Business Overview
CME is where market participants turn to manage that risk across the most diverse set of benchmark products. It operates a derivatives marketplace which offers a range of futures and options products for risk management. Given the nature of its product offering, CME benefits from a volatile environment as investors increase their risk mitigation efforts in a higher risk environment.
In prior posts I touched upon CME’s ongoing Google Cloud transformation project; CME announced this transformation project in November 2021. Part of this transformation project included Google making a $1B equity investment in a new series of non-voting convertible preferred stock of CME Group.
Near the end of the quarter, CME announced a significant step forward in its partnership with Google Cloud. The plan is to build a new private Google Cloud region and a colocation facility in Aurora, Illinois, designed to support global trading of CME’s futures and options markets in the cloud with next-generation cloud technology, ultra-low latency networking and high-performance computing. This next-generation platform will offer a broader range of connectivity options and faster product development.
In addition to this new state-of-the-art trading infrastructure, CME’s clients will also be able to utilize Google’s artificial intelligence and data capabilities to help develop, test and implement trading strategies to manage their risk more efficiently.
I encourage you to review the company’s website and Part 1 of the FY2023 Form 10-K.
Financials
Q2 and YTD2024 Results
CME’s strong Q2 results reinforced how the need for risk management continues to grow. It delivered record quarterly revenue, driven by YoY growth in both average daily volume, and open interest across every single asset class. This is the first quarter with this broad-based growth since 2010.
In addition to its impressive quarterly volume results, CME continues to provide capital efficiencies for its customers. Within interest rates alone, these efficiencies resulted in margin savings of nearly $20B/day for CME’s clients through the unique combination of offsets with CME’s rates futures and options franchise.
In Q2, CME delivered the strongest earnings in its history. It reported the highest ever quarterly revenue at over $1.5B, up 13% from Q2 2023.
The adjusted operating margin was 69.1%, up from 66.8% in Q2 2023.
Driven by the robust demand for its risk management products, CME delivered the highest quarterly adjusted net income and EPS in its history at $0.932B and $2.56/share, both up 11% from the Q2 2023. This represents an adjusted net income margin for the quarter of 61%.
CAPEX in Q2 was ~$17 million.
Cash and cash equivalents at the end of Q2 was ~$1.9B.
A consistent higher level of demand for CME’s products continued in Q2 as evidenced by 52% of the trading days being above 25 million contracts in the first half of FY2024 compared to 34% in the first half of FY2023.
In addition, 4 of the first 6 months this year set all-time volume records, including all 3 months in Q2.
As noted in prior posts, ‘Performance bonds and guaranty fund contributions’ reflected under current assets and current liabilities offset each other. CME holds and owes these funds for/to clearing firms. The funds are in the form of cash, securities or other non-cash deposits. I exclude these values in assessing the CME because they merely flow through CME.
A component of CME’s ~$3.65B in ‘Other assets’ consists of investments in DME Holdings Limited, OSTTRA, and S&P Dow Jones Indices LLC. Information regarding these investment is found on page 66 of 106 in CME’s FY2023 Form 10-K which is accessible through the SEC Filings section of the company’s website.
Intangible Assets and Goodwill comprise ~$30.7 of CME’s ~$34.6B (excludes ‘Performance bonds and guaranty fund contributions’) in Total Assets on the Q2 2024 Balance Sheet. You may, therefore, be interested in knowing more about these assets. Note 6 in CME’s FY2024 Form 10-K that starts on page 65 of 106 provides information on these Balance Sheet line items.
Operating Cash Flow (OCF), CAPEX, and Free Cash Flow (FCF)
In the FY2014 – FY2023 time frame, CME’s:
- OCF was (in B$) 1.29, 1.52, 1.72, 1.84, 2.44, 2.67, 2.72, 2.40, 3.06, and 3.45.
- CAPEX was (in B$) 0.14, 0.11, 0.09, 0.08, 0.12, 0.25, 0.20, 0.13, 0.09, and 0.08.
- FCF was (in B$) 1.35, 1.56, 1.63, 1.78, 2.27, 2.46, 2.46, 2.44, 3.06, and 3.47.
The Q2 2024 Form 10-Q is currently unavailable but at the end of Q1 2024, the Consolidated Statement of Cash Flows reflected ~$0.893B of OCF, ~$20B of CAPEX thus giving us ~$0.873B of FCF.
Return On Invested Capital (ROIC)
LMT’s ROIC (%) in FY2014 – FY2023 is 5.20, 5.77, 7.13, 17.51, 7.47, 7.57, 7.49, 8.96, 9.10, and 10.95.
High quality companies often generate a high ROIC. If a company generates a high ROIC, it needs to invest less to achieve a certain growth rate thus reducing the need for external capital.
A company that generates $0.15/profit for every $1 invested, for example, achieves a ROIC of 15%. I consider a ~15%+ ROIC to be a reasonable minimum threshold because most of the time, a company’s cost of capital will be lower than this level.
When a company consistently generates a high ROIC over the long term and it is growing its revenue, it can reinvest a portion of its profits under favorable conditions thereby leading to a compounding effect. I would much rather invest in a growing company that can reinvest to create greater shareholder value than to invest in a company that has limited growth opportunities and thus chooses to distribute a growing dividend.
Despite CME’s low ROIC, it is an acceptable investment given my objectives, goals, and risk tolerance.
FY2024 Guidance
CME does not issue any guidance.
Credit Ratings
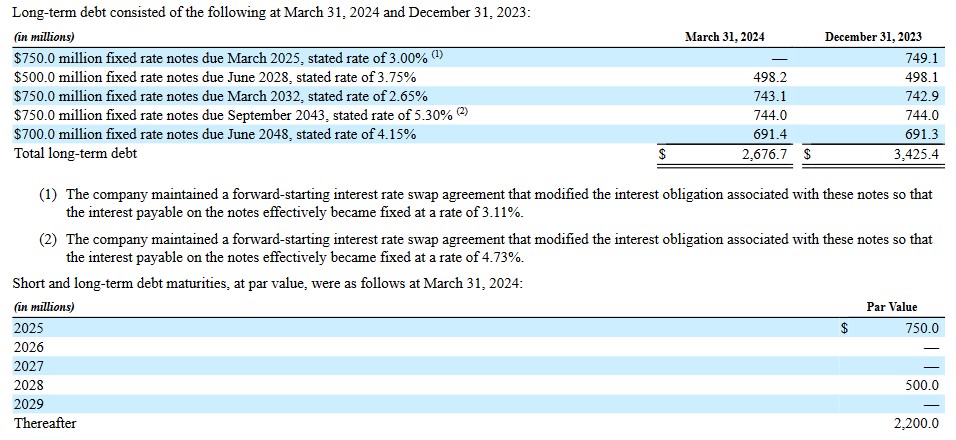
The Q2 2024 Form 10-Q is unavailable as I compose this post on July 29. The schedule of long-term debt in the Q1 Form 10-Q, however, provides an overview of CME’s current portion of long-term debt and long-term debt. There is no change at the end of Q2.
CME’s senior unsecured long-term debt ratings are the lowest tier of the high-grade category and are investment grade. These ratings define CME as having a VERY STRONG capacity to meet its financial commitments. It differs from the highest-rated obligors only to a small degree.
- Moody’s: Aa3 with a stable outlook (affirmed November 13, 2023)
- S&P Global: AA- with a stable outlook (affirmed January 22, 2024)
- Fitch: AA- with a stable outlook (affirmed February 13, 2024)
These ratings are acceptable for my risk tolerance and I foresee no difficulty in CME being able to repay its obligations on a timely basis.
Dividend and Dividend Yield
CME’s dividend history is accessible here.
CME has a somewhat unique dividend policy in that it distributes a variable dividend every mid-January. The amount distributed is dependent on the prior year’s results and capital allocation priorities.
The variable annual ‘special dividend’ is often comparable to the sum of the regular quarterly dividend payments in a given fiscal year. Since the value of the ‘special dividend’ is dependent on company performance and is not declared until early December, it is very difficult to calculate a forward dividend yield.
CME distributed ~$0.419B in dividends in Q2. Since implementing a variable dividend policy in 2012, CME has returned over $25B to shareholders in the form of dividends.
There is a $0.75B fixed rate note with a March 2025 maturity. It is, therefore, possible the ‘special dividend’ in January 2025 may be lower than the $5.25 distributed in January 2024.
No long-term debt is scheduled for repayment in 2026 and 2027 and only $0.5B needs to be repaid in 2028. After this, no debt is scheduled to be repaid until 2032. This could lead to a sizable ‘special dividend’ in the years with no scheduled debt repayments.
In FY2014 – FY2023, the weighted average outstanding diluted dividends (in millions of shares rounded) was 336, 338, 339, 340, 344, 358, 359, 359, 359, and 360. In Q2 2024, it was still ~360.
Share repurchases are not a capital allocation priority.
Valuation
CME’s diluted PE in FY2011 – FY2023 is 12.92, 18.77, 27.53, 29.45, 24.22, 26.89, 33.12, 14.20, 35.28, 30.34, 33.70, 22.94, and 25.13.
When I wrote my October 30, 2023 post, CME’s forward adjusted diluted PE ratios (using the ~$209 share price) were:
- FY2023 – 16 brokers – mean of $9.15 and low/high of $8.97 – $9.33. Using the mean estimate, the forward adjusted diluted PE is ~22.8.
- FY2024 – 16 brokers – mean of $9.39 and low/high of $8.84 – $10.48. Using the mean estimate, the forward adjusted diluted PE is ~22.2.
- FY2025 – 13 brokers – mean of $9.72 and low/high of $8.97 – $10.53. Using the mean estimate, the forward adjusted diluted PE is ~21.5.
CME’s valuation at the time of my December 10, 2023 post, using a $211.62 share price and the current broker earnings estimates, were:
- FY2023 – 16 brokers – mean of $9.17 and low/high of $8.98 – $9.33. Using the mean estimate, the forward adjusted diluted PE is ~23.1.
- FY2024 – 16 brokers – mean of $9.40 and low/high of $8.84 – $10.48. Using the mean estimate, the forward adjusted diluted PE is ~22.5.
- FY2025 – 14 brokers – mean of $9.67 and low/high of $8.97 – $10.44. Using the mean estimate, the forward adjusted diluted PE is ~21.9.
Its valuation at the time of my April 26, 2024 post using a ~$212.50 share price and the current adjusted diluted broker estimates were:
- FY2024 – 16 brokers – mean of $9.74 and low/high of $9.30 – $10.29. Using the mean estimate, the forward adjusted diluted PE is ~22.
- FY2025 – 16 brokers – mean of $9.97 and low/high of $9.31 – $10.92. Using the mean estimate, the forward adjusted diluted PE is ~21.3.
- FY2026 – 9 brokers – mean of $10.60 and low/high of $9.86 – $11.64. Using the mean estimate, the forward adjusted diluted PE is ~20.
Now, CME’s current valuation using the ~$200.50 July 29 pre-market share price and the current adjusted diluted broker estimates are:
- FY2024 – 15 brokers – mean of $9.85 and low/high of $9.65 – $10.08. Using the mean estimate, the forward adjusted diluted PE is ~20.4.
- FY2025 – 15 brokers – mean of $10.05 and low/high of $9.54 – $10.60. Using the mean estimate, the forward adjusted diluted PE is ~20.
- FY2026 – 10 brokers – mean of $10.51 and low/high of $9.65 – $11.31. Using the mean estimate, the forward adjusted diluted PE is ~19.1.
CME has performed well in the first half of the year and exceeding ~$3.5B of FCF in FY2024 is quite possible. To gauge its valuation on a FCF basis, however, I use ~$3.5B in my calculations.
Using ~$360 million as a weighted average diluted shares outstanding in FY2024, I estimate CME will generate ~$9.72 of FCF/share. With a ~$200.50 share price, the forward diluted P/FCF is ~20.6.
I consider CME to currently be undervalued.
Final Thoughts
There are no changes to the final thoughts reflected in my prior posts.
I currently hold 461 shares in a ‘Core’ account and 400 shares in a ‘Side’ account within the FFJ Portfolio.
CME was my 14th largest holding when I completed my 2024 Mid Year FFJ Portfolio Review and my 18th largest holding when I completed my 2023 Year End FFJ Portfolio Review.
Despite shares being undervalued, I am not increasing my exposure right now because I recently acquired shares. My exposure, however, will continue to increase through the automatic reinvestment of dividend income.
I wish you much success on your journey to financial freedom!
Note: Thanks for reading this article. Please send any feedback, corrections, or questions to finfreejourney@gmail.com.
Disclosure: I am long CME.
Disclaimer: I do not know your circumstances and am not providing individualized advice or recommendations. I encourage you not to make any investment decisions without conducting your research and due diligence. You should also consult your financial advisor about your specific situation.
I wrote this article myself and it expresses my own opinions. I am not receiving compensation for it and have no business relationship with any company whose stock is mentioned in this article.