
I last reviewed West Pharmaceutical (WST) in this July 27, 2024 post in which my Final Thoughts included:
I am looking to increase my exposure in great companies that appear to have fallen out of favor. WST certainly falls in this group!
WST’s business remains fundamentally sound and it is still the industry leader. Despite my very recent purchases (300 Visa (V) on July 24 and 300 Mastercard (MA) on July 25), I will dip into my liquidity to add to my WST exposure within the next few days.
WST’s share price started to experience weakness in early February 2024. Based on my assessment, I acquired an additional 100 WST shares @ $285.475 on July 29, 2024 bringing my exposure to 500 shares.
Around the second week in February 2025, WST’s share price ‘fell off the map’. When the broad market imploded in early April 2025, WST’s share price fell to ~$187.50 at which time I should have increased my exposure. I, however, deployed some of my liquidity toward the purchase of shares in other companies.
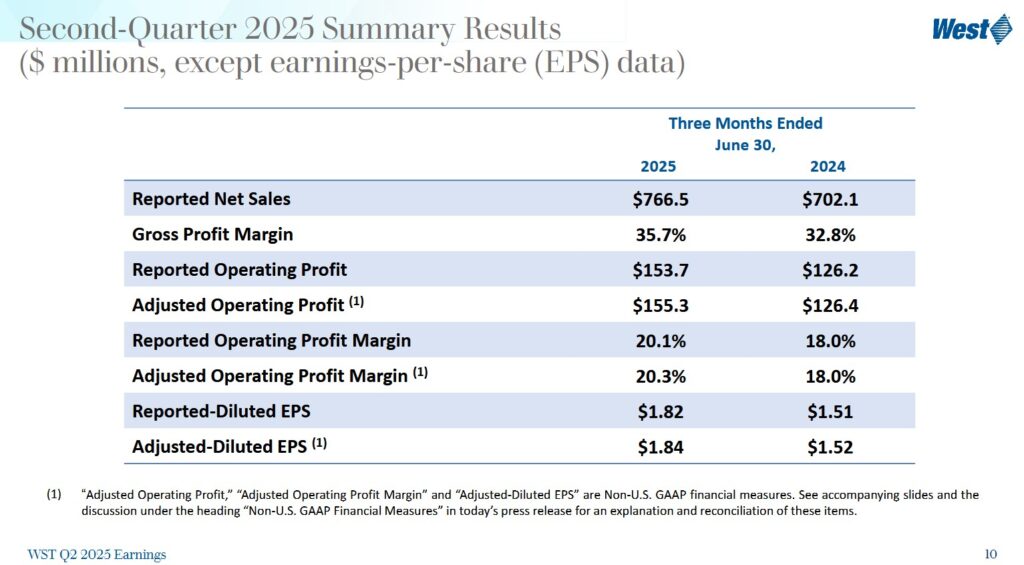
Following the release of WST’s Q2 2025 results on July 24, WST’s share price surged ~22.78% to close at ~$279.
I now take this opportunity to revisit WST’s valuation.
Business Overview
Refer to the company’s website and the FY2024 Form 10-K and Q2 2025 Form 10-Q.
Financials
Q2 and YTD2025 Results
The Q2 2025 Earnings Presentation and the Form 8-K and Form 10-Q are accessible at SEC Filings section of WST’s website.
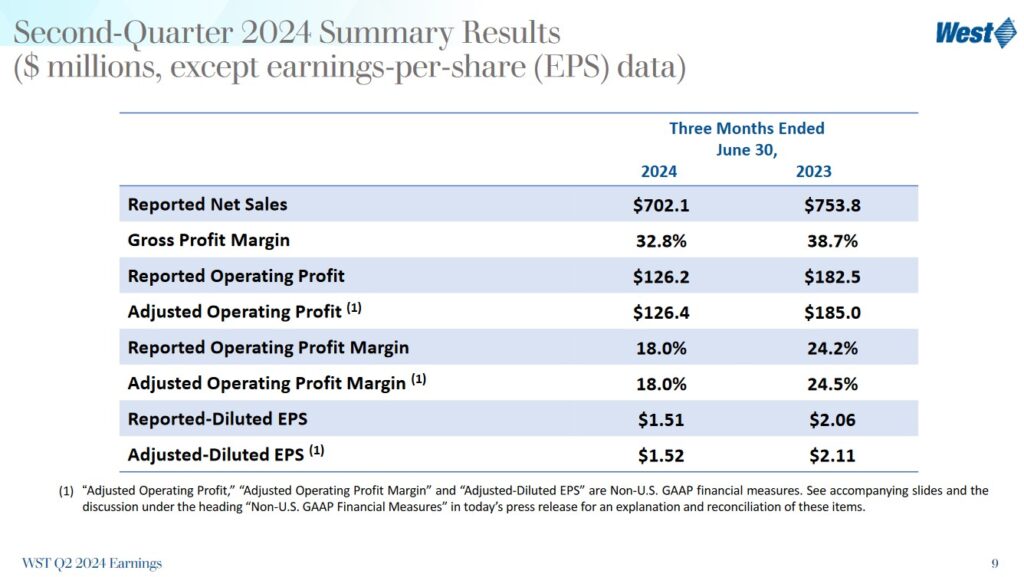
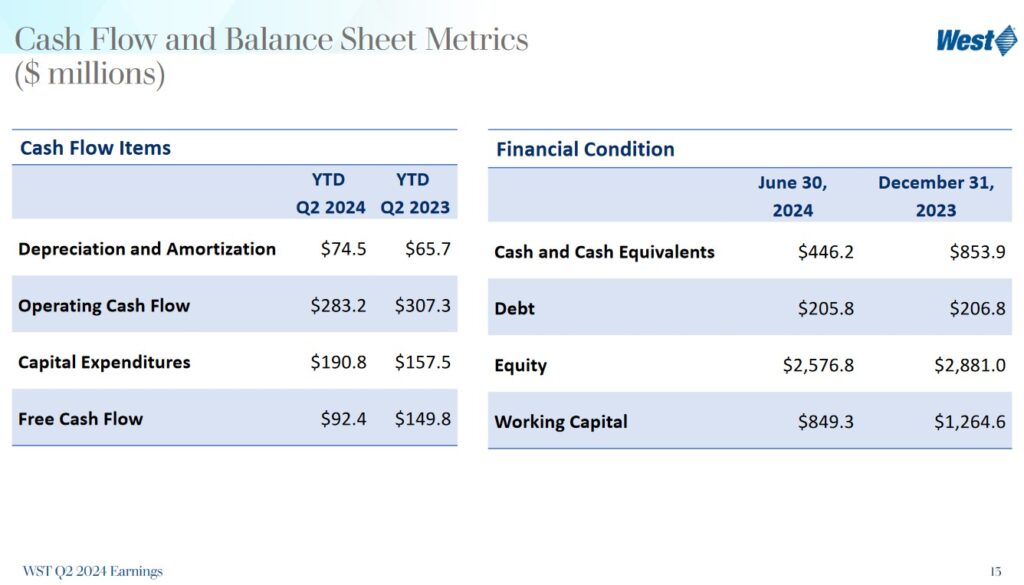
I provide the Q2 2024 and 2025 summary results and cash flow and balance sheet metrics to show the extent to which WST has turned around its performance from an abysmal 2024.
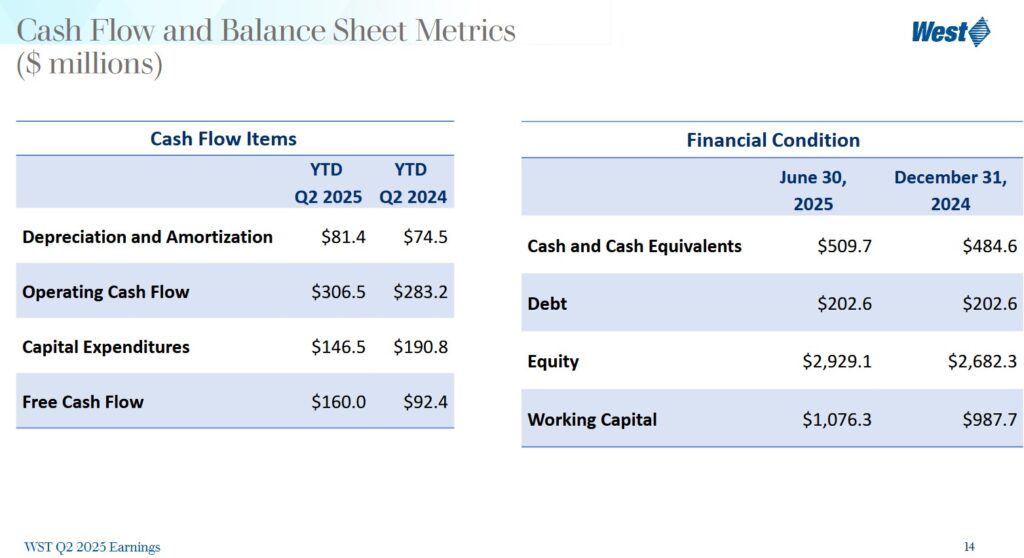
As noted in my July 27, 2024 post, annual CAPEX should return to pre-COVID levels within a couple of years. Management is targeting CAPEX of 6%- 8% of revenues upon the completion of the facilities that are to become operational in FY2025. In comparison, WST’s CAPEX was ~9%, ~10%, and ~12.3% of annual revenue in FY2021 – FY2023.
Conventional And Modified Free Cash Flow (FCF) Calculations (FY2019 – FY2024 and YTD2025)
FCF is a non-GAAP measure, and therefore, the manner in which it is calculated is inconsistent. Many investors deduct CAPEX from OCF to arrive at FCF. In my How Stock Based Compensation Distorts Free Cash Flow post, I explain why I now also deduct stock based compensation (SBC) that is found in the Consolidated Statements of Cash Flows to determine FCF.
The following table reflects WST’s FCF without/with the deduction of SBC.
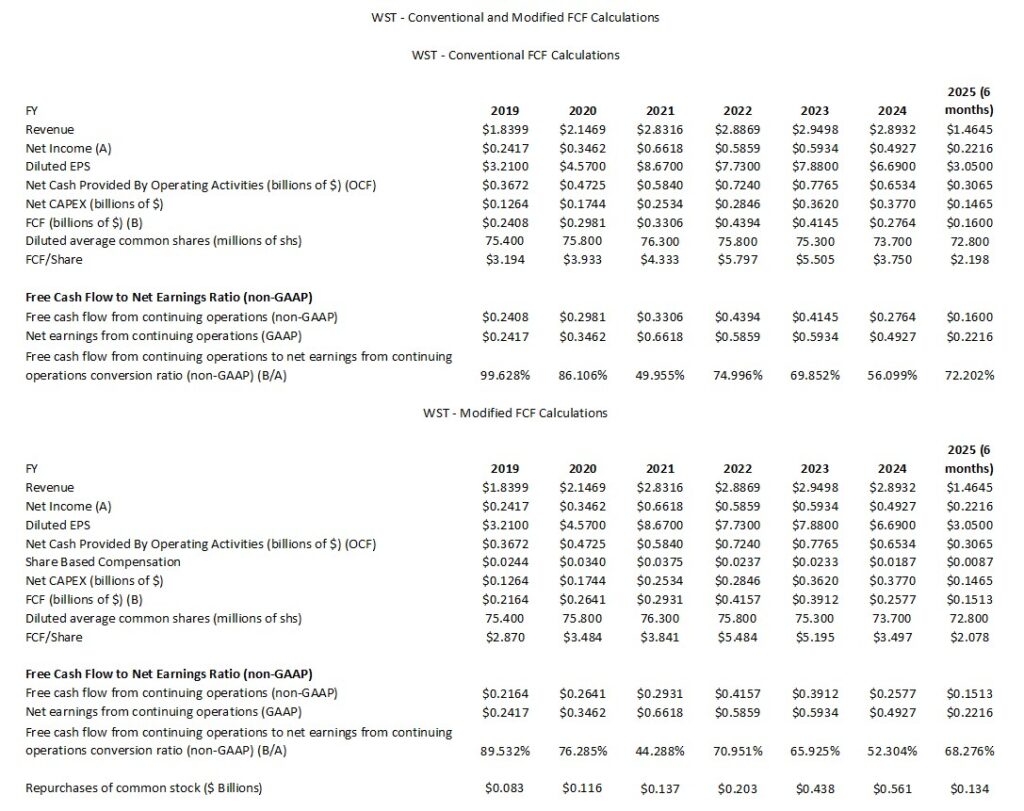
In recent years, WST has invested heavily in expanding manufacturing facilities and upgrading equipment to meet rising global demand for proprietary, high-margin drug containment and delivery components. The expansion particularly supports the fast-growing biologics and GLP-1 (glucagon-like peptide-1) markets, which require advanced, high-quality packaging solutions. Examples of these expansion initiatives include the buildout of new manufacturing plants and the addition of state-of-the-art production lines in the U.S. and Europe.
As a result, WST’s FCF conversion ratio is well below the FY2019 and FY2020 levels.
FY2025 Guidance
WST’s FY2025 guidance when it released its FY2024 results in February 2025 was:
- Consolidated Net Sales: $2.875B – $2.905B
- Adjusted diluted EPS: $6.00 – $6.20
The following reflects WST’s prior and current FY2025 guidance.
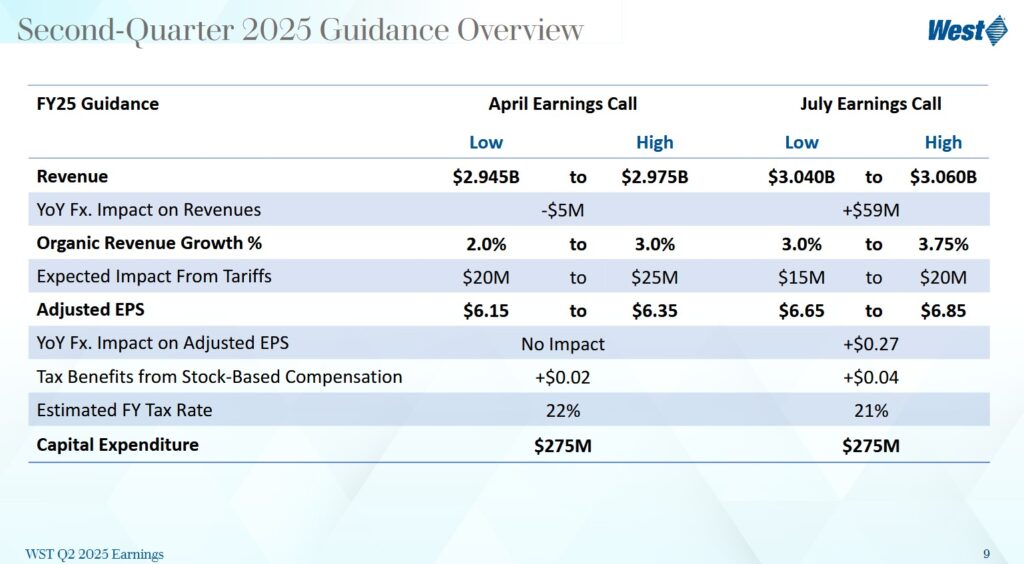
WST’s FY2025 adjusted diluted EPS guidance assumes a $0.27 tailwind based on current foreign exchange rates, compared to prior guidance of no foreign currency impact. The updated guidance also includes EPS of $0.04 associated with first half 2025 tax benefits from stock-based compensation. The current guidance excludes future tax benefits from stock-based compensation.
Management believes the impact of tariffs will be $15 – $20 million for FY2025 compared to the prior $20 – $25 million estimate.
Q3 2025 guidance anticipates $0.785B – $0.795B of revenue. This translates to ~2.5% – 3.5% Q3 organic sales growth.
Adjusted diluted EPS in Q3 is expected to be $1.65 – $1.70. The Q3 2024 results included a ~$19 million customer incentive payment in WST’s drug delivery device business. This does not recur in Q3 2025. Excluding the impact of this incentive, Q3 organic growth is ~ 5% – ~6%.
The FY2025 CAPEX guidance of $0.275B is unchanged from prior guidance.
Risk Assessment
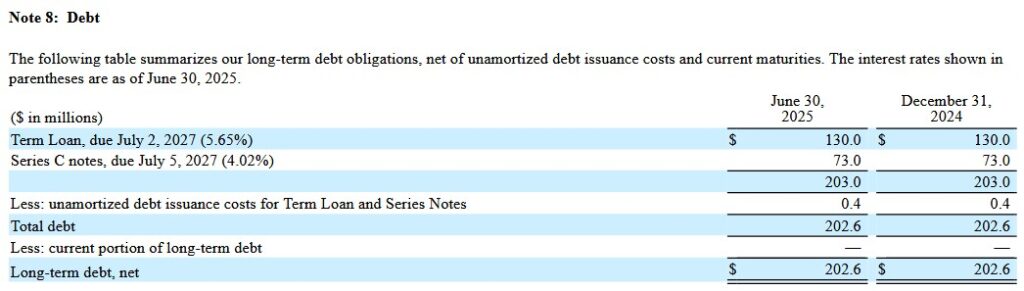
No rating agency rates WST’s debt. WST’s cash flow and balance sheet metrics, however, reflect a prudent use of debt.
The following reflects WST’s debt at the end of Q2 2025 and FYE2024.
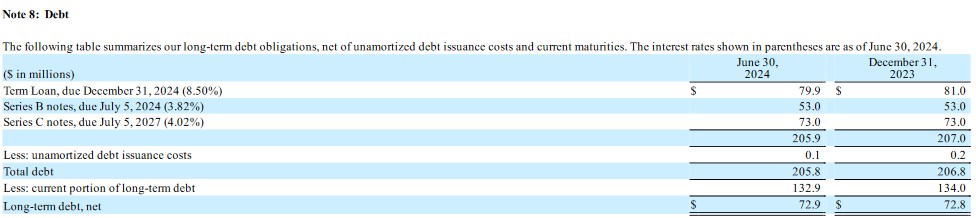
For comparison, I provide WST’s debt at the end of Q2 2024 and FYE2023.
Various financial covenants in WST’s debt agreements include the need to maintain established interest coverage ratios and to not exceed established leverage ratios. The agreements also contain other customary covenants, none of which are restrictive to WST’s operations. At the end of Q2 2025, WST complied with all debt covenants.
Dividends, Share Repurchases, and Stock Splits
Dividend and Dividend Yield
WST does have a dividend history. A WST investment, however, is typically not made for dividend income. This is a low dividend yielding company and the bulk of WST’s total long-term investment return is likely to continue to be derived from capital appreciation. Dividend metrics, however, should be of little importance when making investment decisions.
Share Repurchases
WST’s weighted average shares outstanding in FY2013 and Q2 2025 was (in millions of shares) 71.4 and 72.5.
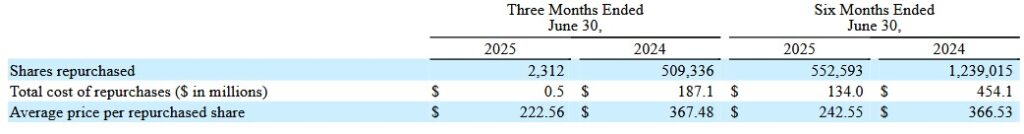
In FY2022 – FY2024, WST repurchased $202.8, $438.3, and $560.9 million of its outstanding shares. In the first half of FY2025, it repurchased $134 million.
During the quarter ending June 30, 2025 and 2024, there were 0.4 million and 0.3 million shares, respectively, from stock-based compensation plans not included in the computation of diluted net income per share because their impact was anti-dilutive. There were 0.4 million and 0.3 million anti-dilutive shares outstanding during the six months ended June 30, 2025 and 2024, respectively.
In February 2023, WST’s Board approved a share repurchase program under which WST was able repurchase up to $1.0B in shares. Completion of this program was during January 2025.
In December 2024, the Board approved a share repurchase program under which WST was able to repurchase up to 550,000 shares of common stock on the open market or in privately-negotiated transactions. Completion of this program was during April 2025.
This table summarizes the details of WST’s repurchases of common stock under these programs.
I anticipate that WST’s Board will approve another share repurchase program prior to FYE2025.
Stock Splits
WST initiated a 2-for-1 stock split in September 2013.
Valuation
In the first half of FY2025, WST generated $3.05 and $3.29 of diluted EPS and adjusted diluted EPS. Management has revised its FY2025 adjusted EPS outlook to $6.65 – $6.85 from $6.15 – $6.35 ($6.25 mi-point).
Using the current ~$279 closing share price on July 24, I estimate an adjusted diluted PE of ~41.3 ($279/$6.75).
Using the currently available broker estimates, WST’s forward-adjusted diluted PE levels are:
- FY2025 – 14 brokers – a forward-adjusted diluted PE of ~43.5 using a mean of $6.41 and low/high of $6.24 – $6.81.
- FY2026 – 13 brokers – a forward-adjusted diluted PE of ~38.5 using a mean of $7.25 and low/high of $6.75 – $7.67.
- FY2027 – 7 brokers – a forward-adjusted diluted PE of ~33.3 using a mean of $8.39 and low/high of $7.41 – $9.36.
I envision adjustments to these estimates over the coming days.
Management does not provide FCF guidance. We can, however, estimate FY2025 FCF. In the first half of FY2025, WST generated $0.16B and $0.1513B of FCF calculated using the conventional and modified calculation methods.
If it generates ~$0.62B of OCF for the year ($0.3065B in the first half) and we deduct FY2025 CAPEX guidance of ~$0.275B, we get ~$0.345B of FCF (conventional calculation method).
In the first half of the year, SBC was $8.7 million. Erring on the side of caution, we can estimate SBC of ~$18 million for FY2025. Deduct this and we get ~$0.327B of FCF (modified calculation method).
If the diluted weighted average shares outstanding for the year are 72.8 million, we get FCF/share values of ~$4.74 and ~$4.50. Divide the current ~$279 share price by these values and the P/FCF is ~59 and ~62. These are well in excess of the FY2025 forward-adjusted diluted PE estimate (~41.3 and ~43.5). This is not surprising given that WST’s FCF conversion ratio has been considerably under 100% the last few years.
Final Thoughts
When I completed my 2024 Mid Year Portfolio Review, WST was my 20th largest holding. It was my 18th largest holding when I completed my 2024 Year End Portfolio Review and had fallen to my 30th largest holding when I recently completed my 2025 Mid-Year Portfolio Review. Following the recent share price surge, it is perhaps my 25th largest holding; I currently hold 500 shares in a ‘Core’ account within the FFJ Portfolio.
The time to invest in great companies is when they have fallen out of favor. Unfortunately, WST’s very recent share price behavior suggests investors are warming up to it (a ~22.78% surge in the company’s share price on July 24!).
Based on my assessment of the currently available information, WST is fairly valued at the ~$280 level. I, therefore, have no immediate intention of adding to my exposure.
I wish you much success on your journey to financial freedom!
Note: Please send any feedback, corrections, or questions to finfreejourney@gmail.com.
Disclosure: I am long WST.
Disclaimer: I do not know your circumstances and do not provide individualized advice or recommendations. I encourage you to make investment decisions by conducting your research and due diligence. Consult your financial advisor about your specific situation.
I wrote this article myself and it expresses my own opinions. I do not receive compensation for it and have no business relationship with any company mentioned in this article.