In my November 3, 2024 Thermo Fisher Scientific (TMO) post, I stated ‘I think there will be an opportunity to acquire shares at a more favorable valuation within the next 12 months’. TMO shares were trading @ ~$558.
Within days of that post, TMO’s share price plunged thus contributing to an improvement in its valuation. I, therefore, acquired 100 TMO shares @ ~$507 on November 18 thus bringing my TMO exposure in the FFJ Portfolio to 277 shares. I disclose this purchase in my November 23 post.
The business environment as we know, however, it is far different from a few months ago. Uncertainty and volatility are now the norm. This increases the degree of difficulty in managing a business – even great businesses are not immune from short-term challenges. They, however, are generally resilient and can adapt.
How long the difficult business conditions will last is an unknown. This is why it is critical that we invest in great businesses that have wide moats, exemplary capital allocation, and solid and ethical management. If we do this, headwinds should present a buying opportunity. Heeding my suggestion to invest in great businesses facing short-term headwinds, I took the opportunity in early April while the markets were imploding to increase my exposure in:
- Blackstone (BX)
- Brookfield Corporation (BN.to)
- HEICO Corporation (HEI-a)
- Intuitive Surgical (ISRG)
- Mastercard (MA)
- S&P Global (SPGI); and
- Thermo Fisher (TMO)
The automatic reinvestment of dividend income has also contributed to small increases in other holdings.
On April 17, I added a few TMO shares @ ~$431.03/share in a ‘Core’ account in the FFJ Portfolio.
With the April 23 release of TMO’s Q1 2025 results and amended FY2025 outlook, I now revisit this existing holding and disclose the purchase of another 100 shares @ $421.37 in a ‘Side’ account in the FFJ Portfolio.
Business Overview
TMO has multiple brands (eg. Thermo Scientific, PPD, Patheon, Applied Biosystems, etc). I encourage you to access the websites of these brands to see the magnitude of TMO’s product offering. I also recommend reviewing the company’s website and Part 1, Item 1 in the FY2024 Form 10-K to gain a good understanding of the business.
TMO is arguably the premier life science supplier. Its portfolio of products, resources, and manufacturing capabilities is unmatched. This has allowed it to increase its ‘share of wallet’ across all channels.
A large portion of TMO’s business mix is consumables and services (~82% of sales) much of which is recurring business.
TMO’s annual revenue has grown from ~$17B in FY2015 to ~$43B in FY2024. Organic growth and several acquisitions have fueled this impressive growth. The company’s more notable acquisitions in recent years are accessible here.
Acquisition of Solventum’s Purification and Filtration Business
On February 25, 2025, TMO announced that it had entered into a definitive agreement with Solventum (SOLV) to acquire Solventum’s Purification & Filtration business for ~$4.1B in cash.
SOLV was spun off from 3M (MMM) on April 1, 2024.
The transaction is expected to be completed by the end of 2025 and is subject to customary closing conditions and regulatory approvals. Once the transaction closes, SOLV’s Purification & Filtration business will become part of TMO’s Life Sciences Solutions segment.
Financials
Q1 2025 Results
The Q1 2025 Earnings Materials are accessible here. In addition, I recommend reviewing the Q1 2025 GAAP/Non-GAAP Reconciliation & Financial Information.
Operating Cash Flow (OCF), CAPEX, and Free Cash Flow (FCF)
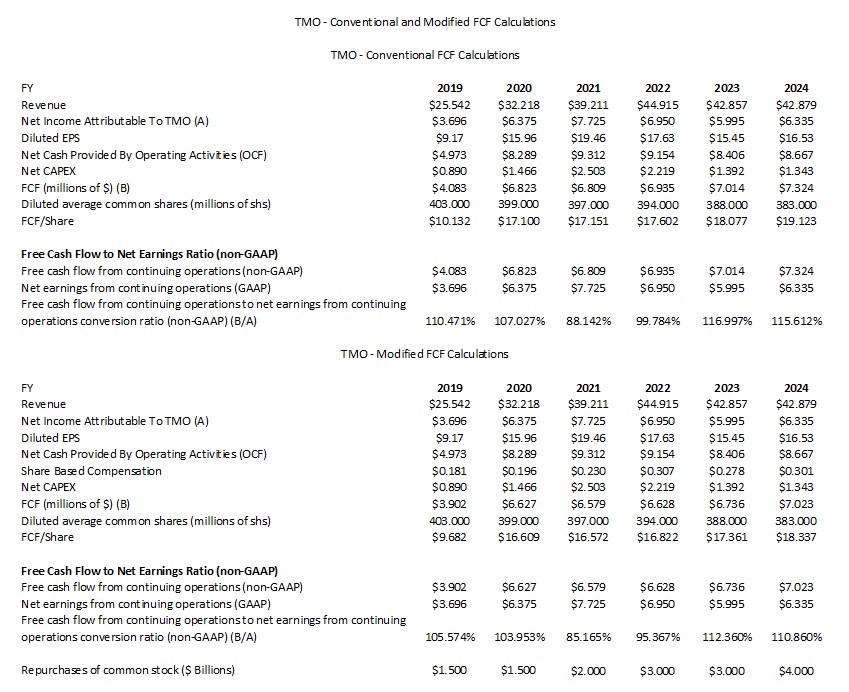
FCF is a non-GAAP measure, and therefore, the manner in which it is calculated is inconsistent. Many investors deduct CAPEX from OCF to arrive at FCF. In my How Stock Based Compensation Distorts Free Cash Flow post, I explain why I now also deduct stock based compensation (SBC) that is found in the Consolidated Statements of Cash Flows to determine FCF.
The following table reflects TMO’s FCF without/with the deduction of SBC.
NOTE: The annual Net CAPEX figures I use in my calculations deduct any ‘proceeds from sale of property, plant and equipment’ from ‘purchases of property, plant and equipment’.
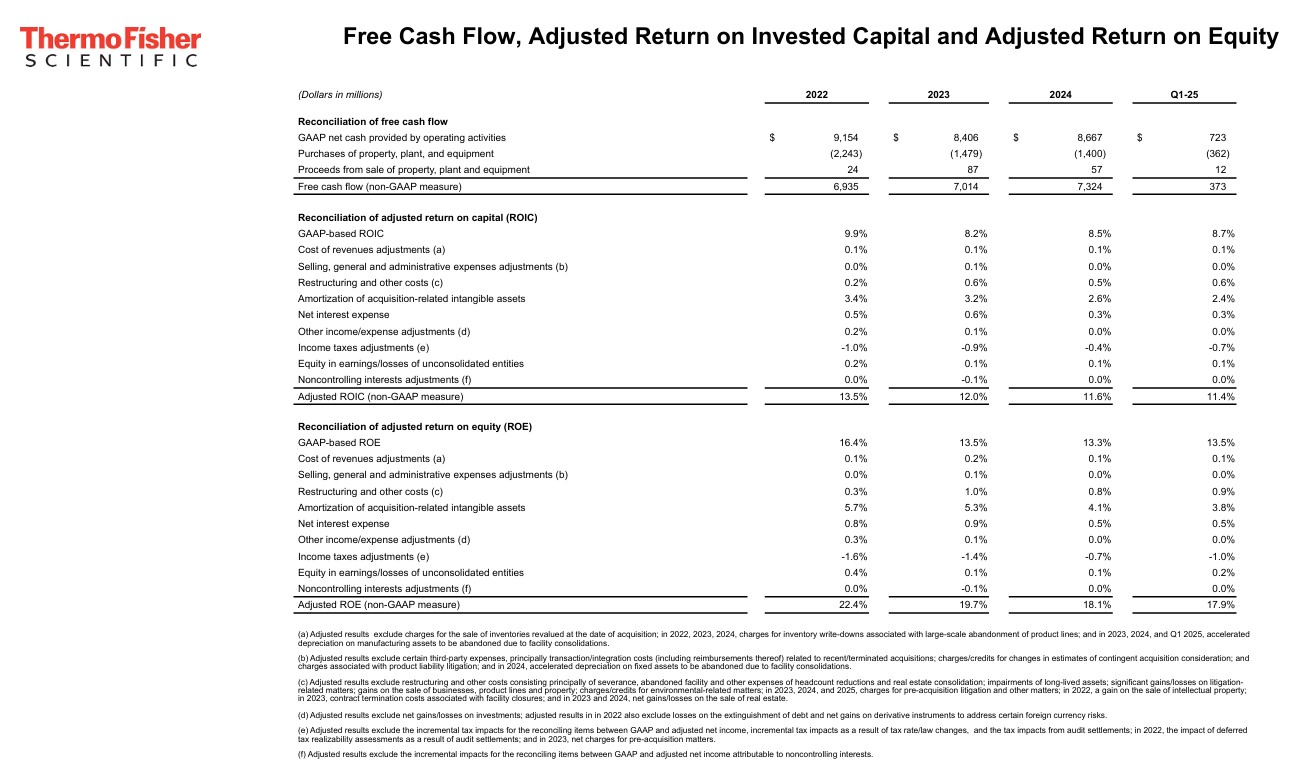
Return On Invested Capital (ROIC)
High quality companies often generate a high ROIC. If a company generates a high ROIC, it needs to invest less to achieve a certain growth rate thus reducing the need for external capital.
A company that generates $0.15/profit for every $1 invested, for example, achieves a ROIC of 15%. I consider a ~15%+ ROIC to be a reasonable minimum threshold because most of the time, a company’s cost of capital will be lower than this level. TMO’s ROIC falls short of this level but, for the most part, the adjusted ROIC has been in the low double digits over the past decade.
When a company consistently generates a high ROIC over the long term and it is growing its revenue, it can reinvest a portion of its profits under favorable conditions thereby leading to a compounding effect. I would much rather invest in a growing company that can reinvest to create greater shareholder value than to invest in a company that has limited growth opportunities and thus chooses to distribute a growing dividend.
TMO makes various adjustments (see schedule below) to arrive at its adjusted ROIC (%).
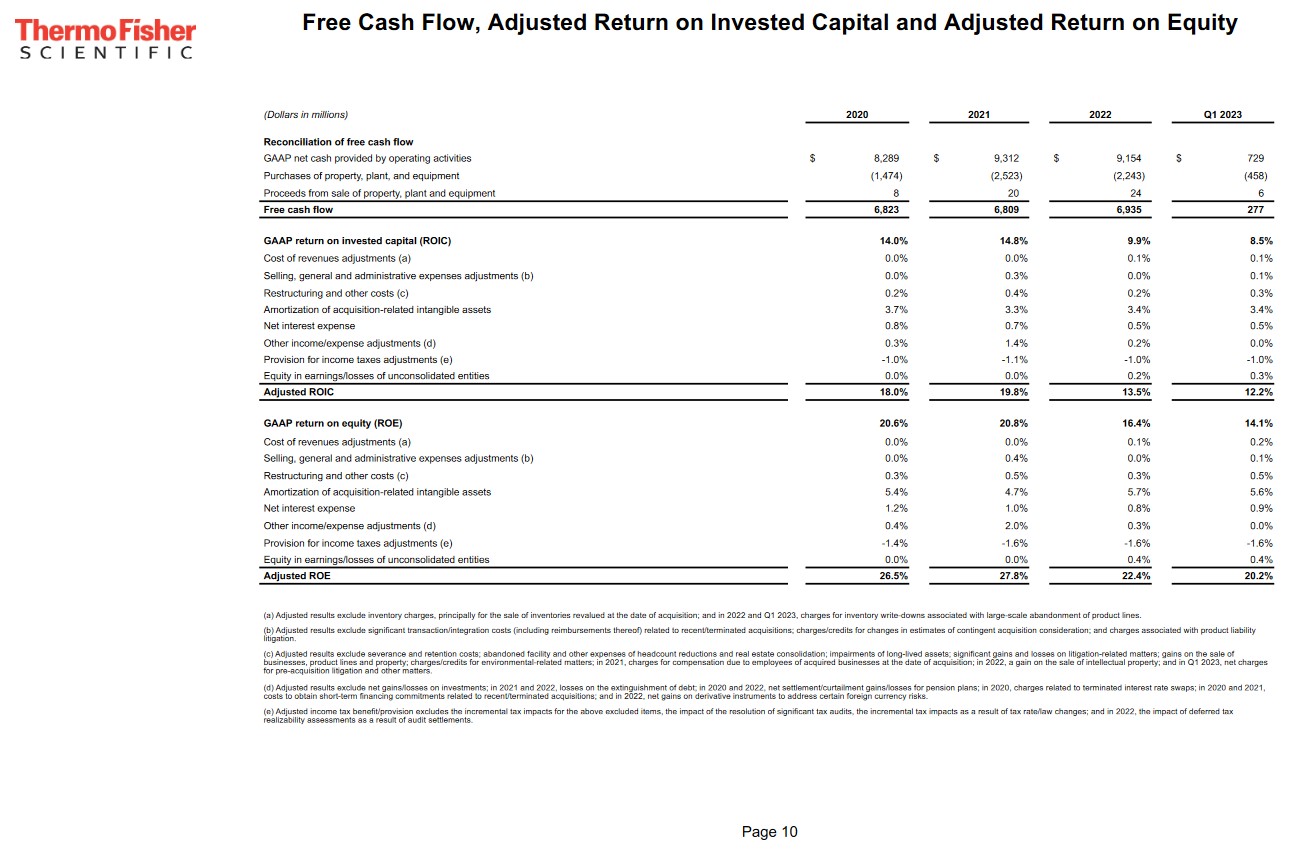
I provide the following so we also have FY2020 and FY2021 results for comparison.
FY2025 Guidance
When TMO released its Q4 and FY2024 results earlier this year, management’s revenue guidance was $43.5B – $44B representing ~3% – ~4% organic growth. Its full-year adjusted EPS guidance was $23.10 – $23.50 representing ~6% – 8% growth.
The strong start to FY2025 and the expected impact of recent changes in the macroeconomic environment has now led TMO to amend its revenue guidance to ~$43.3B – ~$44.2B and its full-year adjusted EPS guidance to $21.76 – $22.84. The lower adjusted EPS guidance is driven by the tariffs between U.S. and China. Management expects the tariffs impact will reduce very rapidly over the next several months when the full benefits of the company’s mitigation actions are realized.
The current China tariff rates here are so substantial that management expects a significant impact to its product sales in China for products produced in US facilities. Given this, TMO’s guidance assumes a ~$0.4B revenue headwind for 2025. These tariffs are also expected to increase the cost of China sourced parts and subassemblies. The lower volumes and higher costs, net of the TMO’s aggressive mitigation actions is assumed to be a ~$0.375B adjusted operating income in 2025. Since the mitigation actions take time to complete, TMO does not expect to realize all their benefits in 2025. Once they are completed, however, TMO expects to fully mitigate the impact of higher tariffs.
TMO expects ~$0.33B of net interest expense in 2025.
The adjusted tax rate assumption for the year is 10.5% versus prior guidance of 11.5%.
TMO continues to expect ~$1.4B – ~$1.7B of CAPEX and FCF of ~$7B – $7.4B.
On the capital deployment front, TMO’s assumption is for $2B of share buybacks which it completed in January 2025.
The full year average diluted share count remains at 378 – 379 million shares.
Management’s expectation is the return of ~$0.6B of capital to shareholders through dividends.
NOTE: Guidance does not include any future acquisitions or divestitures, and therefore, does not include any impact from the pending acquisition of Solventum Purification and Filtration business.
Credit Ratings
There are no changes to TMO’s domestic unsecured long-term debt ratings from the time of my prior review.
- Moody’s continues to assign an A3 rating with a stable outlook. Last reviewed June 18, 2024.
- S&P Global continues to assign an A- rating with a stable outlook. Last reviewed June 13, 2024.
- Fitch continues to assign an A- rating with a stable outlook. Last reviewed August 22, 2024.
All three ratings are the bottom tier of the upper medium grade investment grade category. They define TMO as having a strong capacity to meet its financial commitments. TMO, however, is somewhat more susceptible to the adverse effects of changes in circumstances and economic conditions than obligors in higher-rated categories.
The following schedule reflects TMO’s net debt/adjusted trailing 12 month EBITDA ratio for FY2022 – FY2024 and Q1 2025.
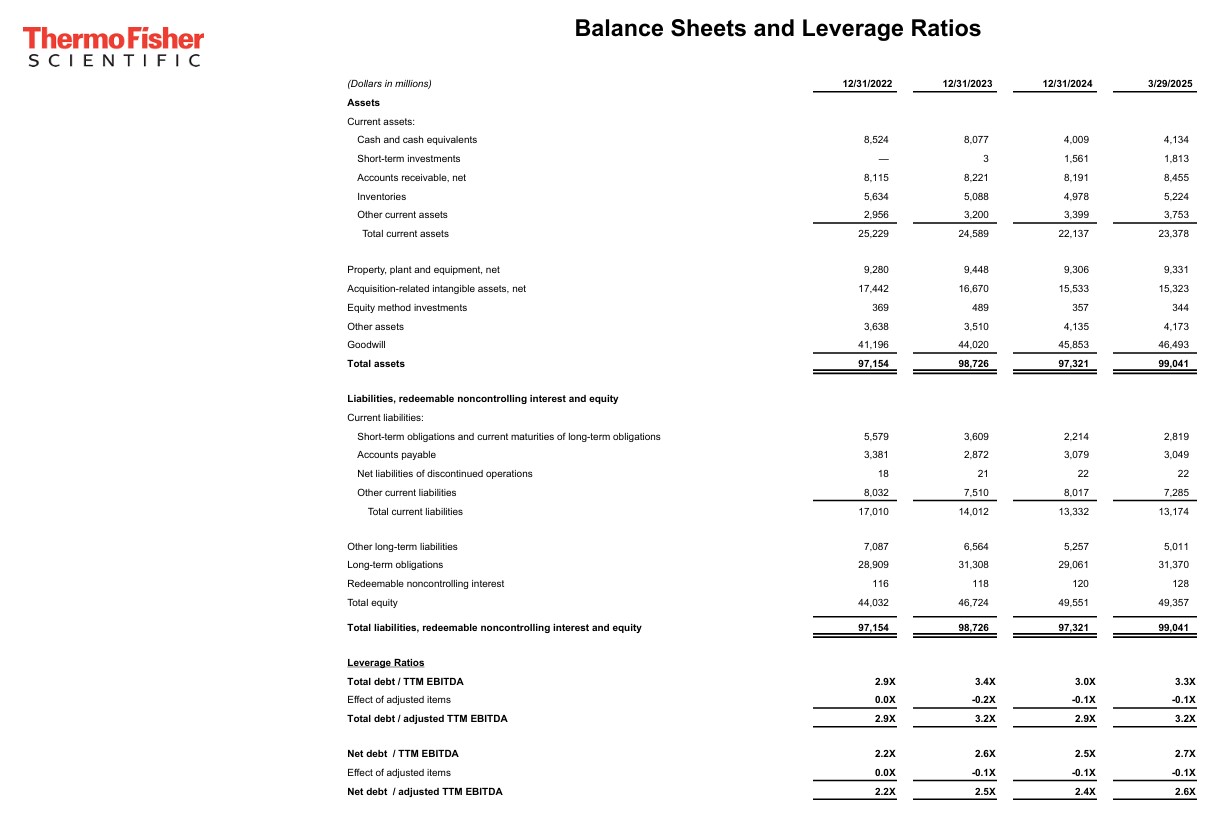
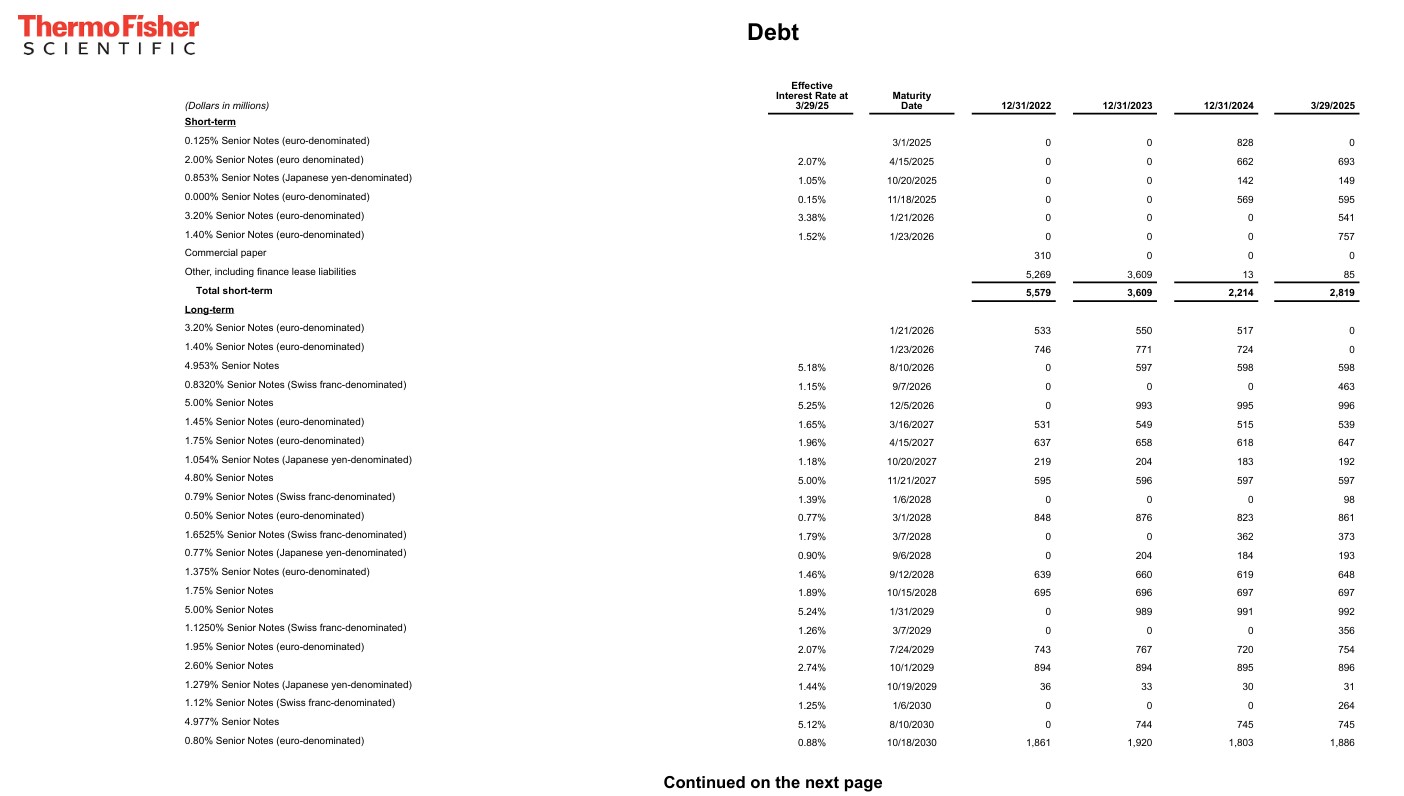
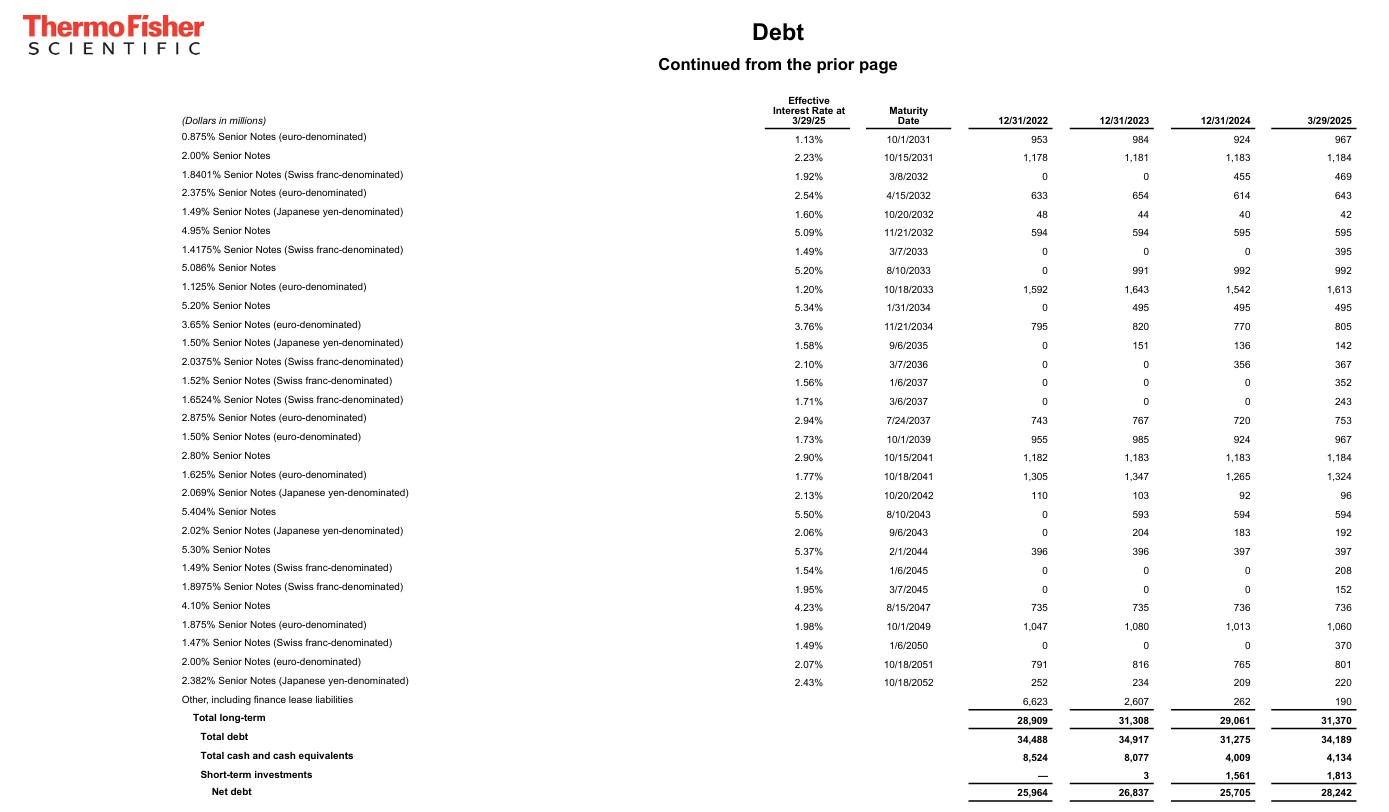
TMO’s debt maturity schedule reflects ~$2.819B of short-term debt. I do not foresee a problem in the repayment of these obligations.
Dividend and Dividend Yield
TMO’s dividend history is accessible here.
I know past performance is not necessarily indicative of future performance. However, dividends are low on TMO’s list of capital allocation priorities. This is unlikely to change in the foreseeable future.
When considering TMO as a potential investment, disregard the dividend metrics as they are irrelevant (unless you have a sizable number of shares).
On November 15, 2024, TMO announced that its Board authorized the repurchase of $4B of common shares in the open market or in negotiated transactions. The authorization has no expiration date and replaced the company’s existing repurchase authorization, of which $1B was remaining.
The following table reflects TMO’s share buybacks in FY2022 – FY2024 and Q1 2025. Unfortunately, TMO’s average prices paid per share in FY2022 – FY2024 and Q1 2025 were much higher than the current ~$426.66 share price. Despite the depressed share price, management has given no indication that it intends to acquire an additional significant number of shares through the remainder of FY2025.

The weighted average diluted shares outstanding in FY2013 (in millions) was 366. TMO issued equity to assist in the funding of some of its acquisitions which explains why 379 million shares were outstanding in Q1 2025 despite a considerable level of share repurchases in recent years.
Stock Splits
TMO had three 3 for 2 stock splits in the 1990s (1993, 1995, and 1996).
Valuation
At the time of my November 3, 2024 post, TMO’s share price was ~$558 and management’s adjusted diluted EPS guidance for FY2024 was $21.35 – $22.07. The forward adjusted diluted PE was, therefore, ~25.3 – ~26.1.
Using the currently available broker estimates, TMO’s forward-adjusted diluted PE levels were:
- FY2024 – 27 brokers – a forward-adjusted diluted PE of ~25.7 using a mean of $21.74 and low/high of $21.34 – $21.88.
- FY2025 – 27 brokers – a forward-adjusted diluted PE of ~23.3 using a mean of $23.96 and low/high of $22.33 – $24.40.
- FY2026 – 21 brokers – a forward-adjusted diluted PE of ~20.8 using a mean of $26.85 and low/high of $25.03 – $27.22.
I also determined its valuation based on FCF and stated:
I now exclude SBC in calculating a company’s FCF. TMO’s SBC for FY2024 is likely to be ~$0.3B. Rather than use management $6.5B – $7B of FY2024 FCF guidance, I will err on the side of caution and will use $6.5B to determine P/FCF.
Using management’s outlook of ~383 million shares for the full year average diluted share count, the FY2024 FCF/share should be ~$17. Divide the current ~$558 share price by ~$17 and we get a P/FCF of ~32.8.
I ended up acquiring additional shares at ~$507 on November 18 so on a forward-adjusted diluted PE basis the valuation was ~23.3 ($507/$21.74). On a P/FCF basis it was ~30 ($507/$17). It turns out that TMO generated ~$18.34 of FCF calculated on a modified basis so the valuation was closer to ~27.64.
In Q1 2025, TMO generated $3.98 and $5.15 of diluted EPS and adjusted diluted EPS. Broker estimates are likely to be revised over the next several days but at the moment, TMO’s valuation based on broker adjusted diluted EPS estimates and the current ~$426.66 share price is:
- FY2025 – 30 brokers – a forward-adjusted diluted PE of ~18.8 using a mean of $22.60 and low/high of $22 – $24.58.
- FY2026 – 30 brokers – a forward-adjusted diluted PE of ~17 using a mean of $24.95 and low/high of $23.94 – $27.18.
- FY2027 – 22 brokers – a forward-adjusted diluted PE of ~15.4 using a mean of $27.54 and low/high of $22.05 – $29.76.
Given the current business environment, I would not rely on any earnings estimates beyond FY2025.
I anticipate that TMO’s FY2025 FCF/share will slightly exceed diluted EPS but may be very slightly lower than adjusted diluted EPS. If this occurs, TMO’s P/FCF calculated on a modified basis should slightly exceed the brokers’ FY2025 forward-adjusted diluted PE of ~18.8.
Final Thoughts
The Trump administration’s decision to slash funding for universities and research bodies coupled with layoffs at federal health agencies will negatively impact TMO. It, however, plans to mitigate the hit through a ~$2B increase in U.S. manufacturing investments, supply chain changes, and pricing actions.
Market conditions are likely to remain volatile for the foreseeable future. A compelling case can be made that TMO’s share price could very well experience further weakness. If this materializes, I will seriously consider increasing my TMO exposure.
When I completed my 2024 FFJ Portfolio year end review, I held 277 TMO shares and it was my 22nd largest holding. I now hold 383 shares but the share price is ~$426 versus ~$518 at the end of 2024. I know TMO is still a top 30 holding. Unless I perform another portfolio review, however, I do not know its ranking.
If TMO’s share price increases to ~$520 – still well below ~$550 which I consider to be a fair value – from my recent $421.37 purchase price, this would be a ~23.4% price appreciation. I am prepared to withstand TMO’s short-term headwinds for this potential return.
As noted in my November 3, 2024 post, TMO’s share price experiences considerable volatility within a year; the current 52 Week Range is $409.85 – $627.88. If you do intend to invest in TMO, a good time to acquire shares is when the company appears to have fallen out of favor with most investors. Now appears to be such a time.
I wish you much success on your journey to financial freedom!
Note: Please send any feedback, corrections, or questions to finfreejourney@gmail.com.
Disclosure: I am long TMO.
Disclaimer: I do not know your circumstances and do not provide individualized advice or recommendations. I encourage you to make investment decisions by conducting your research and due diligence. Consult your financial advisor about your specific situation.
I wrote this article myself and it expresses my own opinions. I do not receive compensation for it and have no business relationship with any company mentioned in this article.