Thermo Fisher’s (TMO) share price surge is disappointing for investors wishing to acquire grossly undervalued shares in this high quality company.
In recent TMO posts with the most recent being that on July 7, 2025, I suggest that negative investor sentiment presents an investment opportunity. Following the July 23, 2025 Q2 and YTD2025 earnings release, however, we note a surge in the company’s share price (~$475 at the July 24 market close).
When I published my April 25, 2025 Thermo Fisher (TMO) – Headwinds Present A Buying Opportunity post, it had just released its Q1 2025 results and FY2025 guidance. In that post, I disclosed the purchase of:
- a few TMO shares @ ~$431.03/share in a ‘Core’ account in the FFJ Portfolio on April 17, 2025; and
- 100 shares @ $421.37 in a ‘Side’ account in the FFJ Portfolio on April 24, 2025.
Following these purchases, I held 383 shares and it was my 21st largest holding when I completed my 2025 Mid-Year Portfolio Review. TMO’s share price at the time of this review was ~$428.65.
In comparison, I held 277 shares and it was my 22nd largest holding when I completed my 2024 FFJ Portfolio Year-End Review. TMO’s share price at the time was ~$520.23.
In my July 7, 2025 post, I disclosed the purchase of an additional 75 shares @ $421.9667 share in a ‘Core’ account in the FFJ Portfolio. My TMO exposure is now 458 shares (358 in ‘Core’ accounts and 100 in a ‘Side’ account).
Business Overview
TMO has multiple brands (eg. Thermo Scientific, PPD, Patheon, Applied Biosystems, etc). I encourage you to access the websites of these brands to see the magnitude of TMO’s product offering. I also recommend reviewing the company’s website and Part 1, Item 1 in the FY2024 Form 10-K.
It is arguably the premier life science supplier. Its portfolio of products, resources, and manufacturing capabilities is unmatched. This has allowed it to increase its ‘share of wallet’ across all channels.
A large portion of TMO’s business mix is consumables and services (~82% of sales) much of which is recurring business.
TMO’s annual revenue has grown from ~$17B in FY2015 to ~$43B in FY2024 and ~$21.219B in the first half of FY2025. Organic growth and several acquisitions have fueled this impressive growth. The company’s more notable acquisitions in recent years are accessible here.
Acquisition of Solventum’s Purification and Filtration Business
On February 25, 2025, TMO announced that it had entered into a definitive agreement with Solventum (SOLV) to acquire Solventum’s Purification & Filtration business for ~$4.1B in cash; SOLV was spun off from 3M (MMM) on April 1, 2024.
When the acquisition was announced, the transaction was expected to be completed by the end of 2025.
In June 2025, TMO disclosed that it is no longer including Solventum’s drinking water filtration business in its plan to acquire the medical-device company’s filtration and purification segment. This revision reduces the cash consideration to $4B. Under the terms of the acquisition agreement, TMO will be entitled to receive up to $75 million from Solventum upon a sale of the water business or after an agreed-upon three-year period. According to Solventum, removing the water filtration business makes the deal less complicated and speeds up the timeline for closing the transaction, which was previously scheduled to happen by the end of 2025. This is disclosed in Solventum’s June 25, 2025 Form 8-K.
Once the transaction closes, SOLV’s Purification & Filtration business will become part of TMO’s Life Sciences Solutions segment.
Financials
Q2 and YTD2025 Results
The Q2 and YTD2025 Earnings Materials are accessible here. In addition, I recommend reviewing the Q2 2025 GAAP/Non-GAAP Reconciliation & Financial Information.
Conventional And Modified Free Cash Flow (FCF) Calculations (FY2019 – FY2024 and YTD2025)
FCF is a non-GAAP measure, and therefore, the manner in which it is calculated is inconsistent. Many investors deduct CAPEX from OCF to arrive at FCF. In my How Stock Based Compensation Distorts Free Cash Flow post, I explain why I now also deduct stock based compensation (SBC) that is found in the Consolidated Statements of Cash Flows to determine FCF.
The following table reflects TMO’s FCF without/with the deduction of SBC.
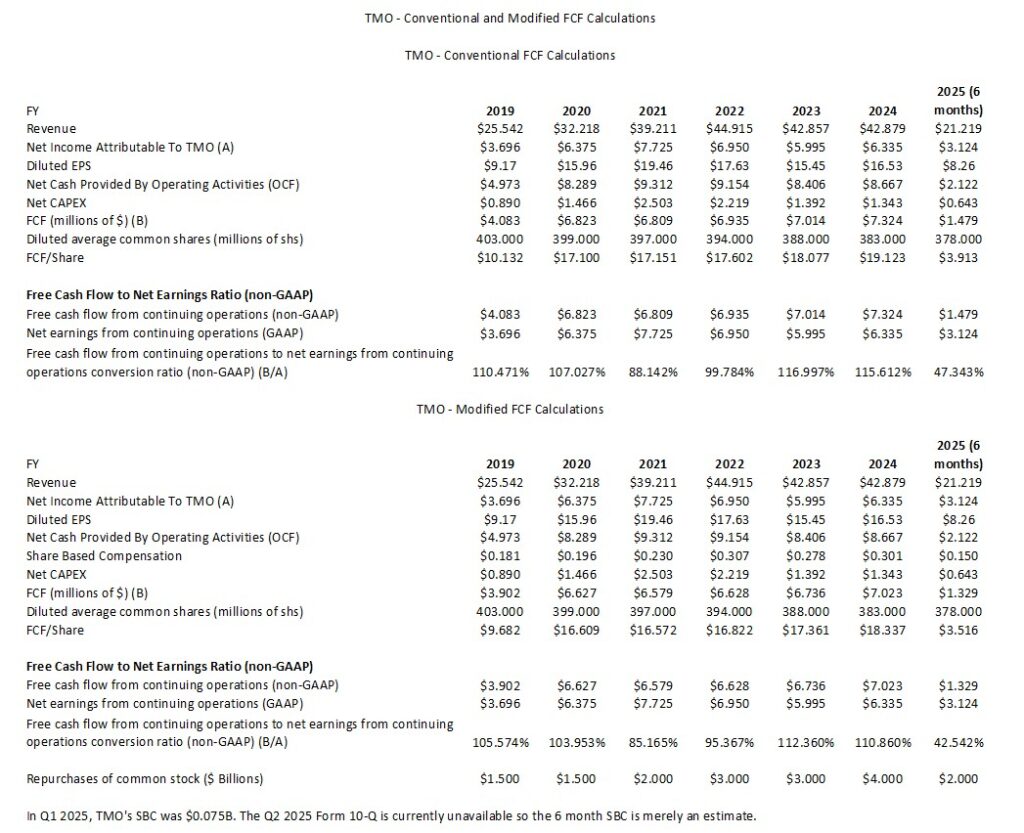
NOTE: The annual Net CAPEX figures deducts any ‘proceeds from sale of property, plant and equipment’ from ‘purchases of property, plant and equipment’.
The YTD2025 results are distorted because we only have Revenue, Diluted EPS, OCF, CAPEX, SBC, and FCF for half the year.
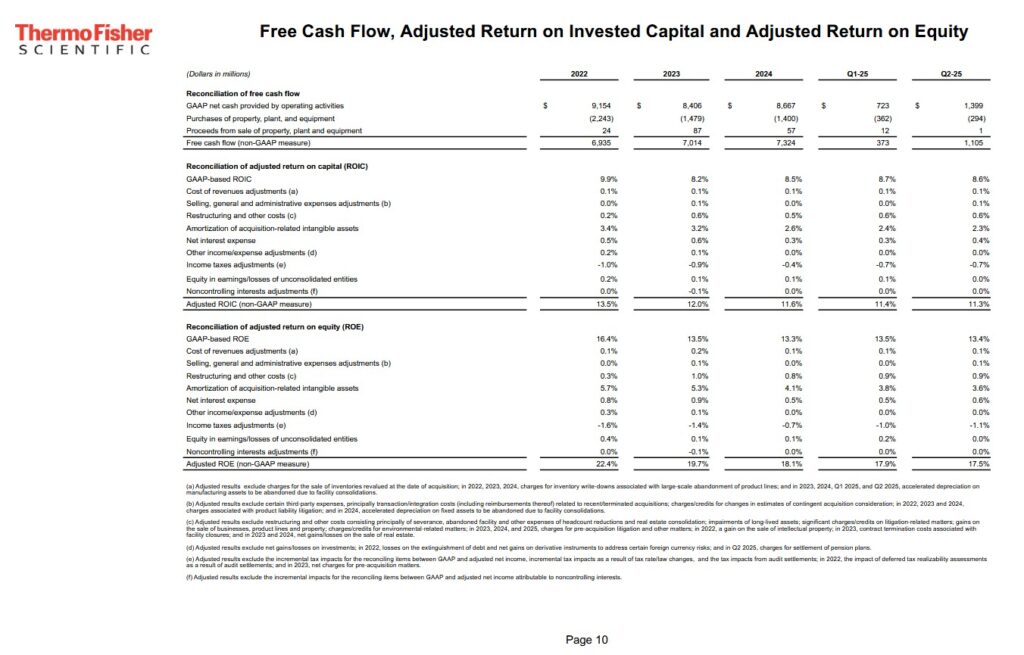
Return On Invested Capital (ROIC)
High quality companies often generate a high ROIC. If a company generates a high ROIC, it needs to invest less to achieve a certain growth rate thus reducing the need for external capital.
A company that generates $0.15/profit for every $1 invested, for example, achieves a ROIC of 15%. I consider a ~15%+ ROIC to be a reasonable minimum threshold because most of the time, a company’s cost of capital will be lower than this level. TMO’s ROIC falls short of this level but, for the most part, the adjusted ROIC has been in the low double digits over the past decade.
When a company consistently generates a high ROIC over the long term and it is growing its revenue, it can reinvest a portion of its profits under favorable conditions thereby leading to a compounding effect. I would much rather invest in a growing company that can reinvest to create greater shareholder value than to invest in a company that has limited growth opportunities and thus chooses to distribute a growing dividend.
TMO makes various adjustments (see schedule below) to arrive at its adjusted ROIC (%).
FY2025 Guidance
Following a strong first half of FY2025, TMO’s revenue guidance is ~$43.6B – ~$44.2B. Its full-year adjusted EPS guidance is $22.22 – $22.84.
Organic revenue growth is still expected to be 1% – 3%. The outlook for adjusted operating margin is 22.5% – 22.7%.
The increase at the midpoint of the guidance range reflects $120 million higher revenue than the prior guide, 30 bps of improved adjusted operating margin and $0.23 of higher adjusted EPS. This incorporates the Q2 beat as well as an additional $0.10 of adjusted EPS in the second half of the year to reflect additional cost actions TMO is taking to continue to actively manage its cost base.
The organic outlook for the second half of the year remains on track to prior guidance.
On the Q2 2025 earnings call, management states:
FX rates continue to fluctuate in the quarter driven by changes in tariffs and trade policy. In Q2, the year-over-year FX impact on revenue improved $60 million versus our prior guide, but the adjusted EPS impact worsened by $0.08, largely due to onetime transactional FX caused by intra-quarter volatility in rates, which, if FX rates stay as they are today, will not reoccur in 2026.
So for the full year, we now expect FX to be a year-over-year tailwind to revenue of $10 million and a headwind to adjusted operating income and adjusted EPS of $80 million and $0.27, respectively.
Below the line, we now expect net interest expense to be between $0.360B – $0.370B in 2025, and we continue to expect an adjusted tax rate of 10.5% for the full year.
We continue to expect between $1.4B – $1.7B of net capital expenditures in 2025, and free cash flow of $7B – $7.4B.
In terms of capital deployment, we’re assuming $2B of share buybacks, which were already completed in January.
We continue to estimate the full year average diluted share count will be 378 million – 379 million shares and we will ~$0.6B of capital to shareholders this year through dividends.
Our guidance does not include any future acquisitions or divestitures.
So it does not include any impact from the pending acquisitions of Solventum’s Purification and Filtration business and the sterile fill-finish site from Sanofi.
In terms of phasing for Q3, we expect organic growth in Q3 to be about 1 point higher than Q2 and adjusted EPS to be ~$0.10 – ~$0.15 higher than Q2.
We’re managing the company under the assumption that we will deliver 3% – 6% organic revenue growth in that period. That includes a continuation of the strong share gains that we’ve been delivering.
In that top line environment using the proven levers of the PPI Business System, we expect to generate ~50 – ~70 bps points of adjusted operating margin expansion and mid- to high single-digit adjusted operating income growth.
Credit Ratings
There are no changes to TMO’s domestic unsecured long-term debt ratings from the time of my prior review.
- Moody’s continues to assign an A3 rating with a stable outlook. Last reviewed June 18, 2024.
- S&P Global continues to assign an A- rating with a stable outlook. Last reviewed June 24, 2025.
- Fitch continues to assign an A- rating with a stable outlook. Last reviewed May 28, 2025.
All three ratings are the bottom tier of the upper medium grade investment grade category. They define TMO as having a strong capacity to meet its financial commitments. TMO, however, is somewhat more susceptible to the adverse effects of changes in circumstances and economic conditions than obligors in higher-rated categories.
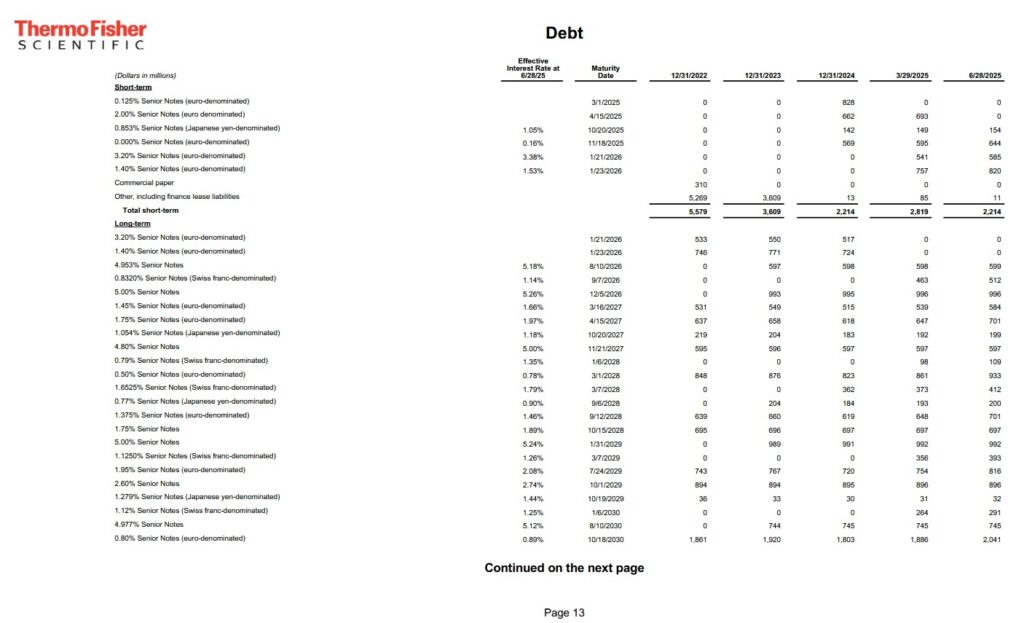
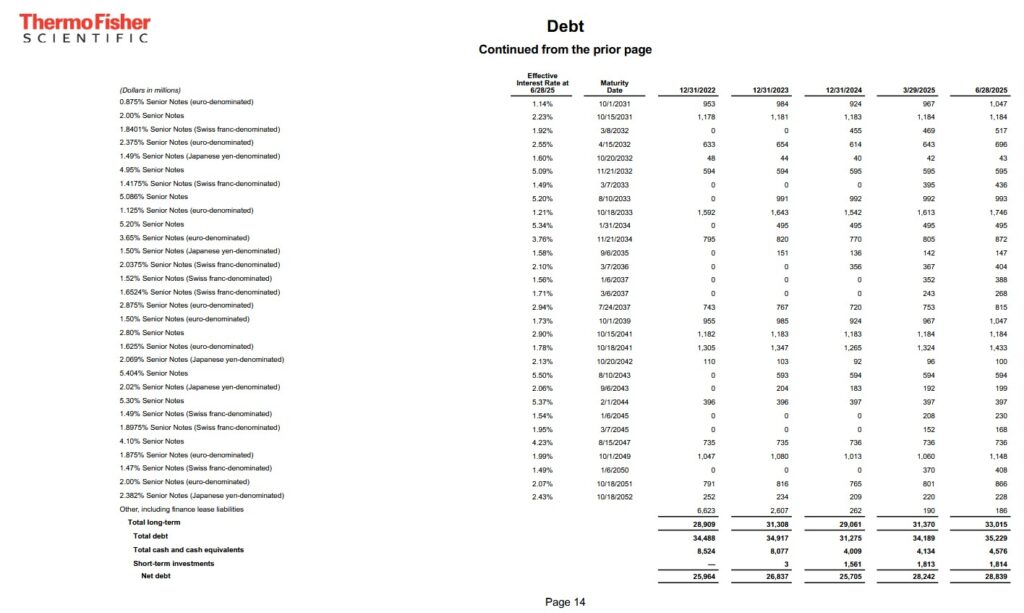
The following schedule reflects TMO’s net debt/adjusted trailing 12 month EBITDA ratio for FY2022 – FY2024 and Q1 and Q2 2025.
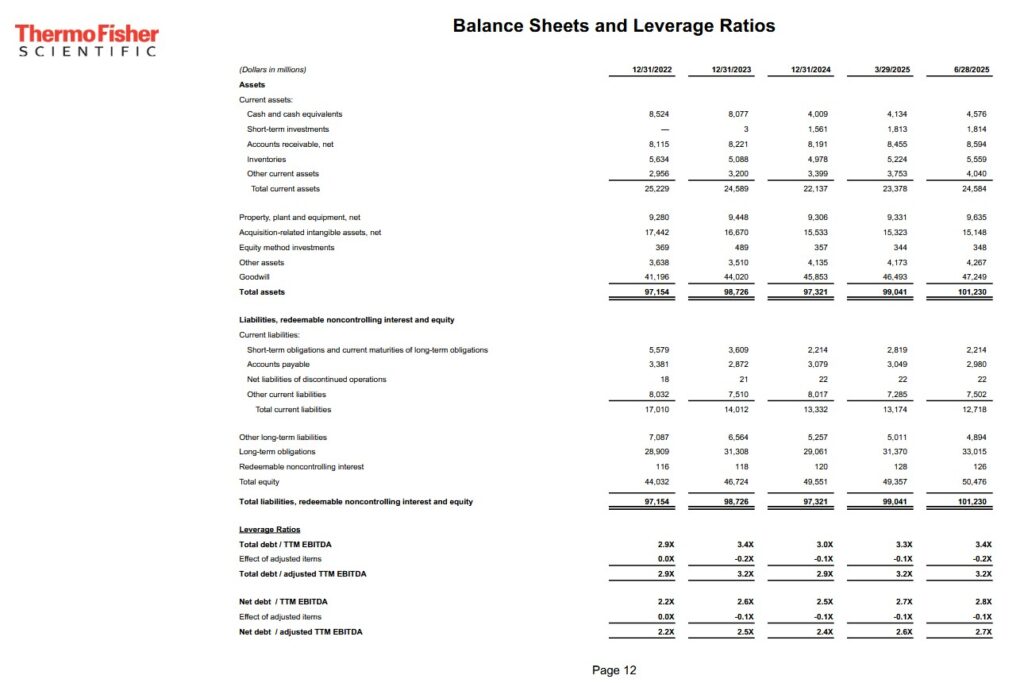
TMO’s debt maturity schedule reflects ~$2.214B of short-term debt. I do not foresee a problem in the repayment of these obligations.
Dividend and Dividend Yield
TMO’s dividend history is accessible here.
I know past performance is not necessarily indicative of future performance. However, dividends are low on TMO’s list of capital allocation priorities. This is unlikely to change in the foreseeable future.
When considering TMO as a potential investment, disregard the dividend metrics as they are irrelevant.
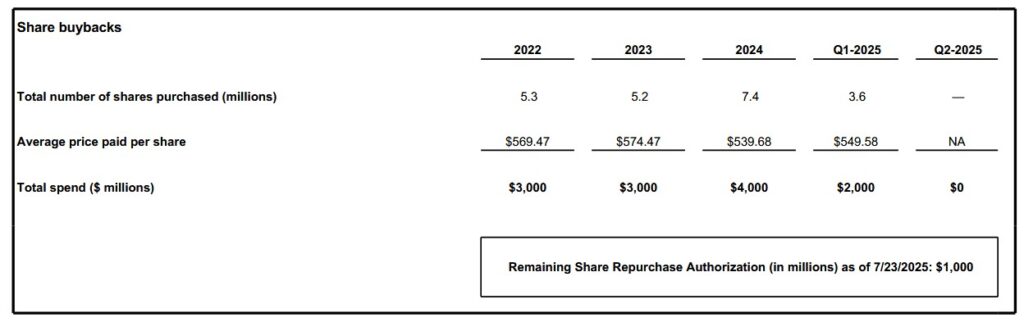
On November 15, 2024, TMO announced that its Board authorized the repurchase of $4B of common shares in the open market or in negotiated transactions. The authorization has no expiration date and replaced the company’s existing repurchase authorization, of which $1B was remaining.
The following table reflects TMO’s share buybacks in FY2022 – FY2024 and Q1 and Q2 2025. Unfortunately, TMO’s average prices paid per share in FY2022 – FY2024 and Q1 2025 were much higher than the current share price. The second quarter of FY2025 would have been an ideal time to repurchase shares. Unfortunately, NO shares were repurchased given the uncertain macro environment.
Despite the depressed share price, management has given no indication that it intends to acquire an additional significant number of shares through the remainder of FY2025.
The weighted average diluted shares outstanding in FY2013 (in millions) was 366. TMO issued equity to assist in the funding of some of its acquisitions which explains why 378 million shares were outstanding in the first half of FY2025 despite a considerable level of share repurchases in recent years.
Stock Splits
TMO had three 3 for 2 stock splits in the 1990s (1993, 1995, and 1996).
Valuation
We have had the good fortune of TMO having fallen out of favor for the past few months thus providing us with an opportunity to acquire undervalued shares. Unfortunately, this appears to have recently come to an end.
With the July 23, 2025 release of YTD2025 results and revised FY2026 outlook, let’s revisit TMO’s valuation.
As noted in prior posts, we can not rely entirely on PE and adjusted PE ratios to gauge a company’s valuation. These metrics should merely form part of our assessment.
Let’s start by looking at TMO’s valuation using projected earnings.
In the first half of FY2025, TMO generated $8.26 and $10.51 of diluted EPS and adjusted diluted EPS. Management has revised its FY2025 adjusted EPS to $22.22 – $22.84, a $0.23 increase at the midpoint; the new midpoint is $22.53 meaning expectations are for TMO to generate ~$12.02 adjusted diluted EPS in the second half.
Management provides no GAAP guidance, and therefore, I am conservatively estimating that FY2025 diluted EPS will be ~$17. This is slightly above double the first half’s diluted EPS. My estimate assumes TMO will repurchase no shares in the second half thus leading to a marginal increase in diluted shares outstanding because of shares issued as part of the company’s SBC programs.
Using the current ~$475 share price, I estimate a diluted PE of ~28 ($475/$17). On an adjusted basis we get ~20.8 – ~21.4 when using management’s revised adjusted EPS guidance.
Using the currently available broker estimates, TMO’s forward-adjusted diluted PE levels are:
- FY2025 – 28 brokers – a forward-adjusted diluted PE of ~21.1 using a mean of $22.46 and low/high of $21.99 – $22.70.
- FY2026 – 29 brokers – a forward-adjusted diluted PE of ~19.4 using a mean of $24.44 and low/high of $23.50 – $25.87.
- FY2027 – 21 brokers – a forward-adjusted diluted PE of ~17.6 using a mean of $27.05 and low/high of $25.68 – $28.42.
- FY2028 – 7 brokers – a forward-adjusted diluted PE of ~15.8 using a mean of $30.15 and low/high of $29.22 – $31.78.
I envision adjustments to these estimates over the coming days.
As noted earlier, management’s FY2025 FCF outlook is $7B – $7.4B. I assume SBC will be ~$0.3B since management provides no outlook on this line item. Deduct ~$0.3B from ~$7.2B (the midpoint of management’s guidance) and TMO’s FY2025 FCF should be ~$6.9B calculated using the modified method where we deduct SBC to determine FCF.
Divide ~$7.2B by ~379 million of diluted shares outstanding and we get ~$19 of FCF using the conventional calculation method.
Divide ~$6.9B by ~379 million of diluted shares outstanding and we get ~$18.2 of FCF using the modified calculation method.
With shares trading at ~$475, TMO’s P/FCF is ~25 and ~26.1 calculated using the conventional and modified calculation methods.
Final Thoughts
I am a strong proponent of investing in great companies when they experience short-term challenges that cause them to fall out of favor.
On July 7, I acquired additional TMO shares at $421.9667. With shares trading at ~$475 as I compose this post, one would think that a miracle would have had to happen for TMO’s valuation to be comparable to that at the time of my July 7 purchase.
TMO’s price surge is disappointing if your intention is to acquire shares, however, I think shares are still undervalued. Based on my assessment, $575 appears to be a fair value (a ~21% increase from ~$475).
I wish you much success on your journey to financial freedom!
Note: Please send any feedback, corrections, or questions to finfreejourney@gmail.com.
Disclosure: I am long TMO.
Disclaimer: I do not know your circumstances and do not provide individualized advice or recommendations. I encourage you to make investment decisions by conducting your research and due diligence. Consult your financial advisor about your specific situation.
I wrote this article myself and it expresses my own opinions. I do not receive compensation for it and have no business relationship with any company mentioned in this article.