
I last reviewed Thermo Fisher (TMO) in this February 2, 2024 post. In that post, I concluded that short term demand softness would likely pressure Thermo Fisher’s valuation.
With the recent release of Q2 and YTD2024 results and minor revisions to the FY2024 outlook, I revisit TMO.
Business Overview
I reviewed material presented at TMO’s 2023 Investor Day in my May 24, 2023 post. I, however, recommend reviewing the company’s website and Part 1, Item 1 in the FY2022 Annual Report and Form 10-K to gain a good understanding of the business.
Olink Holding AB Acquisition
In my prior post I noted that on October 17, TMO announced it had entered into a definitive agreement to acquire Olink Holding AB, a leading provider of next-generation proteomics solutions. The transaction valued Olink at ~$3.1B.
TMO deployed $3.1B after the end of Q2 2024 to close the acquisition. Olink is now part of TMO’s Life Sciences Solutions segment.
Financials
Q2 and YTD2024 Results
The Q2 2024 Form 10-Q should be released shortly and will be accessible through the SEC Filings section of the company’s website. Until such time as this is available, please refer to the Form 8-K which contains the Q2 2024 earnings release and the Q2 GAAP/Non-GAAP Reconciliation & Financial Information.
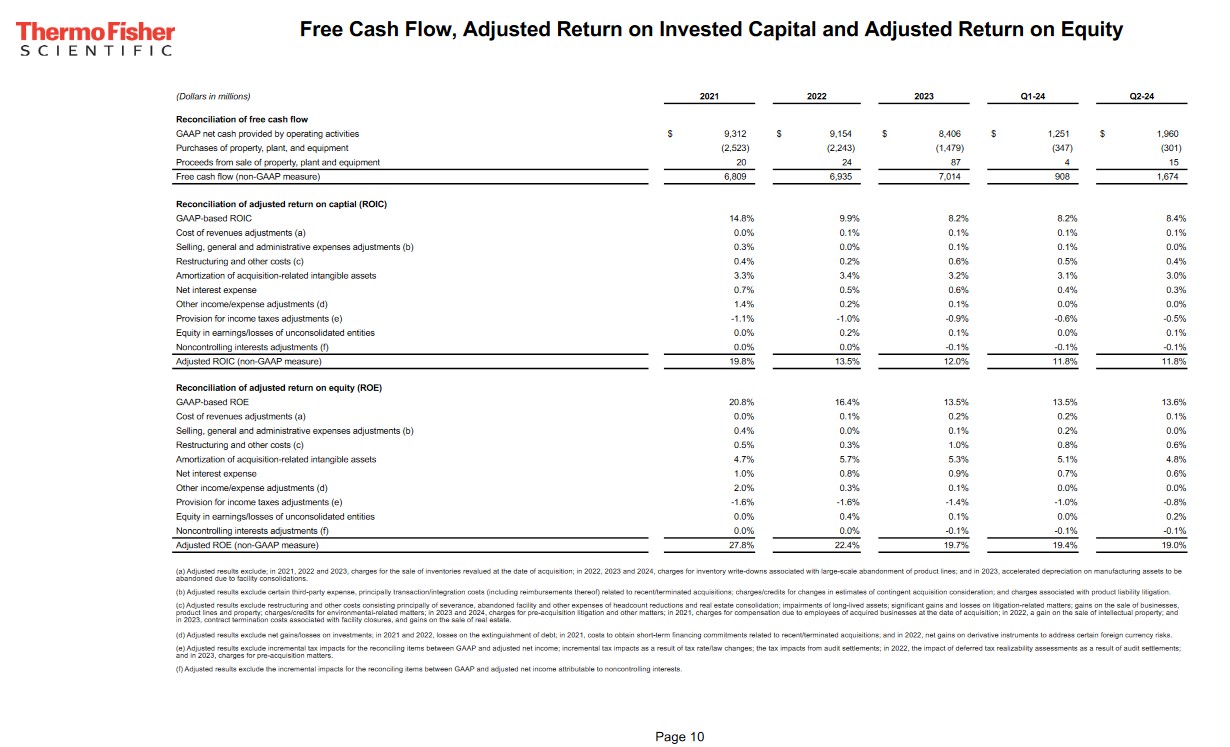
Operating Cash Flow (OCF), CAPEX, and Free Cash Flow (FCF)
In the FY2014 – FY2023 time frame, TMO’s:
- OCF was (in B$) 2.62, 2.82, 3.16, 4.01, 4.54, 4.97, 8.29, 9.31, 9.15, and 8.41.
- CAPEX was (in B$) 0.43, 0.42, 0.44, 0.51, 0.76, 0.93, 1.47, 2.52, 2.24, and 1.48.
- FCF was (in B$) 1.98, 2.80, 2.90, 2.80, 4.26, 4.66, 7.11, 8.30, 7.92, and 7.42.
YTD2024 cash from operations is ~$3.2B, YTD FCF is ~$2.6B, and YTD CAPEX is ~$0.63B.
Return On Invested Capital (ROIC)
High quality companies often generate a high ROIC. If a company generates a high ROIC, it needs to invest less to achieve a certain growth rate thus reducing the need for external capital.
TMO makes various adjustments (see schedule below) to arrive at its adjusted ROIC (%). In FY2013 – FY2023 its adjusted ROIC was 10.1, 9.5, 9.5,9.9, 10, 10.9, 11.8, 17.9, 19.8, 13.5, and 12.0. In Q1 and Q2 2024 it was 11.8.
A company that generates $0.15/profit for every $1 invested, for example, achieves a ROIC of 15%. I consider a ~15%+ ROIC to be a reasonable minimum threshold because most of the time, a company’s cost of capital will be lower than this level. TMO’s ROIC falls short of this level but, for the most part, the adjusted ROIC has been in the low double digits over the past decade.
When a company consistently generates a high ROIC over the long term and it is growing its revenue, it can reinvest a portion of its profits under favorable conditions thereby leading to a compounding effect. I would much rather invest in a growing company that can reinvest to create greater shareholder value than to invest in a company that has limited growth opportunities and thus chooses to distribute a growing dividend.
FY2024 Guidance
TMO is raising its full-year revenue guidance to $42.4B – $43.3B from the previous guidance of $42.3B – $43.3B. Its adjusted EPS guidance is also revised to $21.29 – $22.07 versus its previous guidance of $21.14 – $22.02.
The updated guidance assumes an adjusted operating income margin of 22.5% – 22.8% which is slightly higher than the prior guidance.
The net interest cost assumption is ~$0.38B – ~$0.4B for FY2024.
Management continues to expect a ~10.5% adjusted income tax rate will for the year.
The CAPEX guidance is $1.3B – $1.5B and the assumption is for $6.5B – $7B of FCF.
Guidance assumes $3B of share buybacks; this was completed in January.
The estimate is for the full year average diluted share count to be ~383 million shares.
The current assumption is that ~$0.6B of dividends will be distributed in FY2024.
Credit Ratings
There are no changes to TMO’s domestic unsecured long-term debt ratings from the time of my prior review.
- Moody’s continues to assign an A3 rating with a stable outlook; this rating was upgraded from Baa1 on January 25, 2022.
- S&P Global continues to assign an A- rating with a stable outlook; this rating was upgraded from BBB+ on June 14, 2022.
- Fitch continues to assign an A- rating with a stable outlook; this rating was upgraded from BBB+ on September 1, 2023.
All three ratings are the bottom tier of the upper medium grade investment grade category. They define TMO as having a strong capacity to meet its financial commitments. TMO, however, is somewhat more susceptible to the adverse effects of changes in circumstances and economic conditions than obligors in higher-rated categories.
The following schedule reflects a relatively consistent net debt/adjusted trailing 12 month EBITDA ratio.
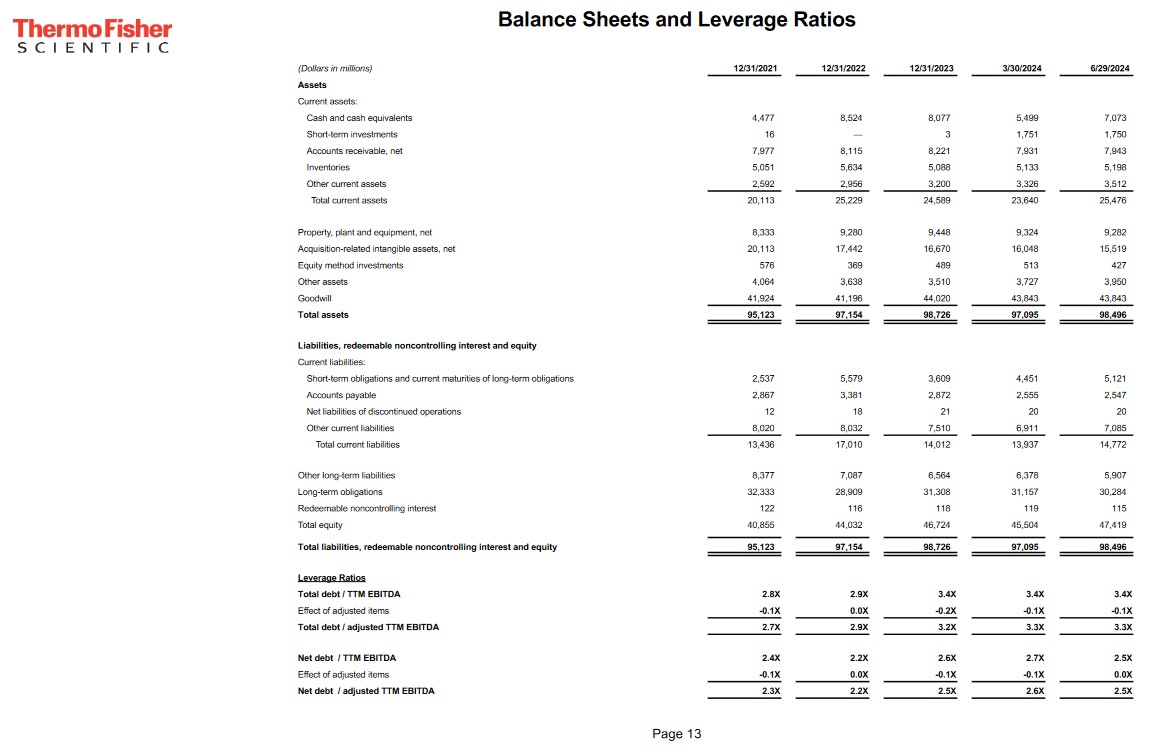
TMO ended Q2 with $8.8B in cash and short-term investments and ~$35.4B of short-term obligations and current maturities of long-term obligations and long-term obligations.
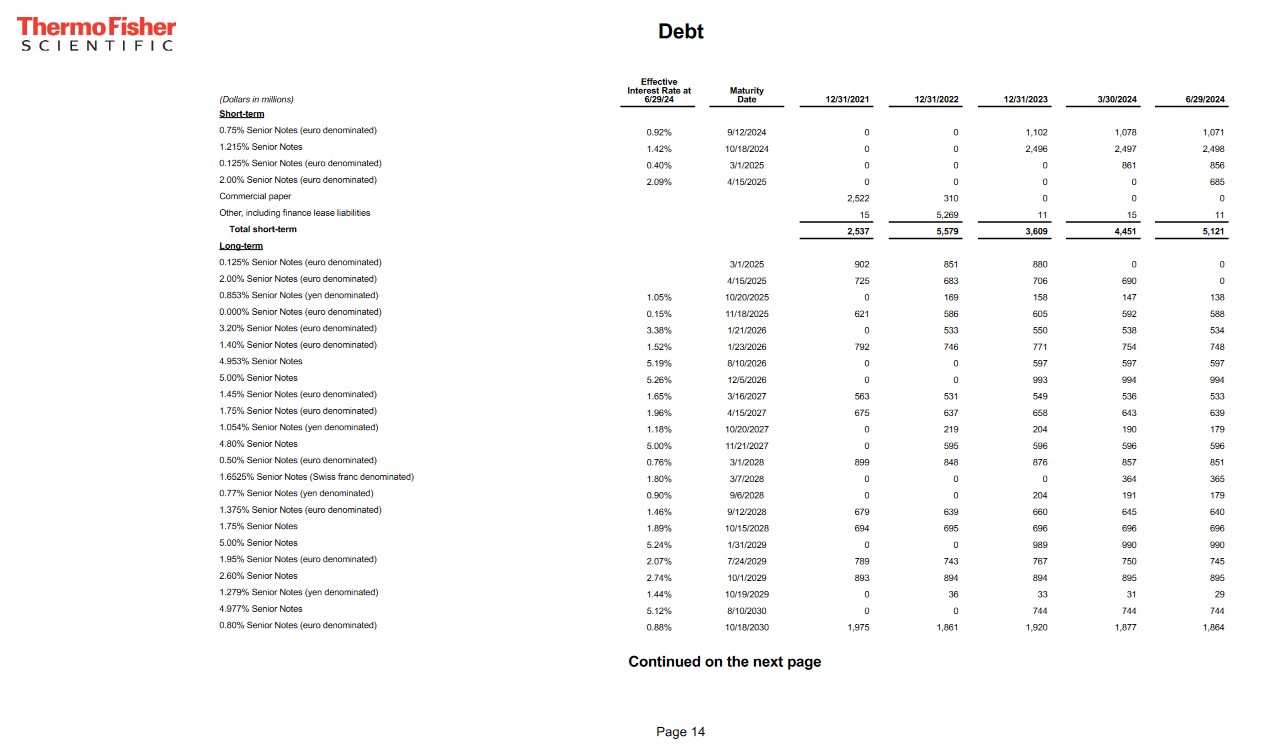
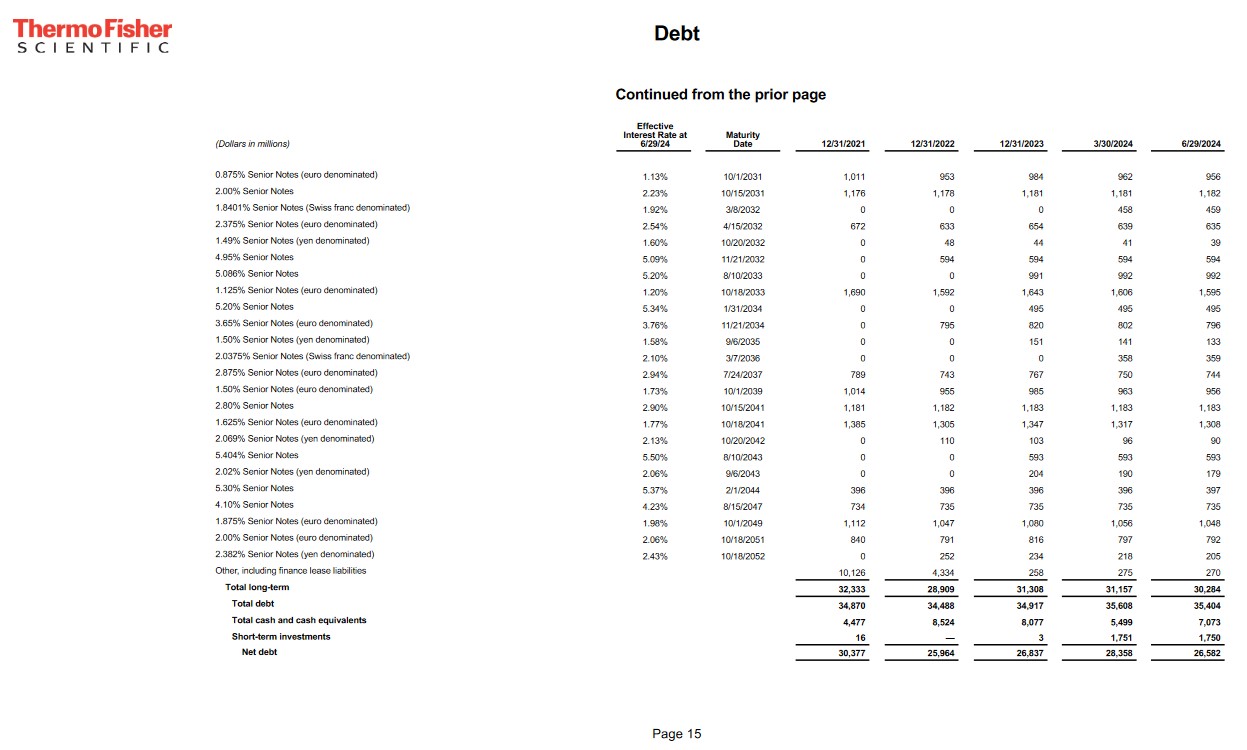
TMO’s debt maturity schedule reflects ~$5.121B of short-term debt. I do not foresee a problem with TMO being able to retire these credit facilities.
Dividend and Dividend Yield
TMO’s dividend history is accessible here.
I know past performance is not necessarily indicative of future performance. However, dividends are low on TMO’s list of capital allocation priorities and this is unlikely to change in the foreseeable future.
Looking at TMO’s performance over a 10 year span (see below), we see the TOTAL dividend distribution amounts to $8.84. TMO’s share price on the other hand has appreciated by more than $450!
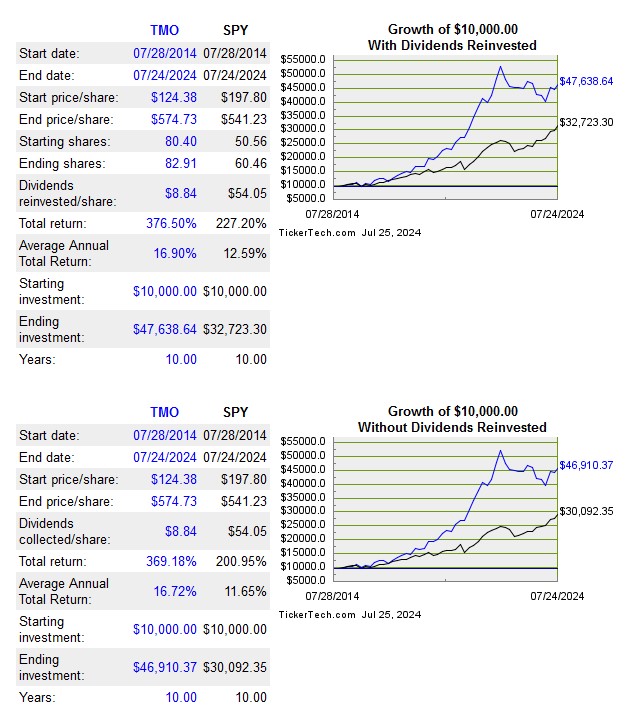
When considering TMO as a potential investment, disregard the dividend metrics as they are irrelevant.
The following table reflects TMO’s share buybacks in FY20210 – FY2023 and Q1 and Q2 2024.
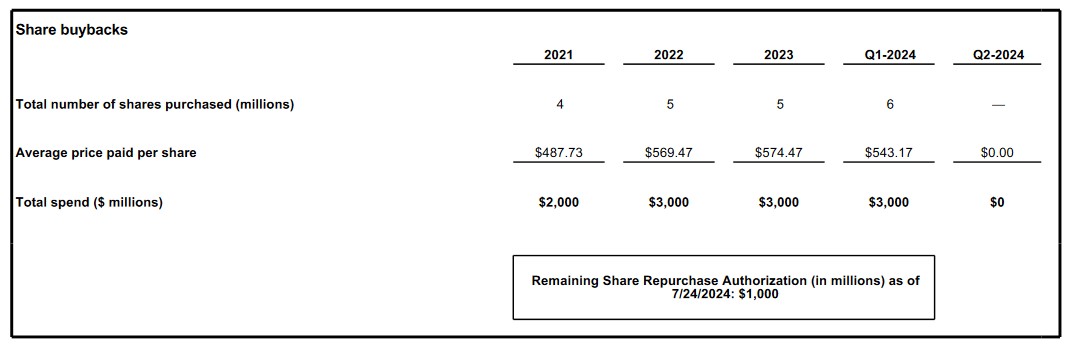
The weighted average diluted shares outstanding in FY2013 – FY2023 (in millions) were 366, 402, 402, 397, 398, 406, 403, 399, 397, 394, and 388. At the end of Q2, this had been reduced to 383.
Stock Splits
TMO had three 3 for 2 stock splits in the 1990s (1993, 1995, and 1996).
Valuation
On November 13, I acquired 25 additional shares at ~$445. Using the currently available forward-adjusted diluted broker estimates, I arrived at the following forward-adjusted diluted PE levels:
- FY2023 – 26 brokers – a forward-adjusted diluted PE of ~20.6 using a mean of $21.56 and low/high of $21.47 – $22.10.
- FY2024 – 25 brokers – a forward-adjusted diluted PE of ~20.2 using a mean of $22.04 and low/high of $21.70 – $25.71.
- FY2025 – 19 brokers – a forward-adjusted diluted PE of ~18 using a mean of $24.73 and low/high of $23.24 – $28.09.
When I wrote my December 8 guest post at Dividend Power, TMO’s share price had rebounded from a ~$415 low at the end of October to ~$492. Using the forward-adjusted diluted broker estimates, TMO’s forward-adjusted diluted PE levels were:
- FY2023 – 26 brokers – a forward-adjusted diluted PE of ~22.8 using a mean of $21.56 and low/high of $21.47 – $22.10.
- FY2024 – 25 brokers – a forward-adjusted diluted PE of ~22.3 using a mean of $22.04 and low/high of $21.70 – $25.71.
- FY2025 – 19 brokers – a forward-adjusted diluted PE of ~20 using a mean of $24.73 and low/high of $23.24 – $28.09.
Based on forward earnings estimates, I concluded TMO to be fairly valued at ~$535 – ~$540.
In FY2023, TMO generated $15.45 of diluted EPS and $21.55 of adjusted diluted EPS. With shares trading at ~$545.50, the diluted PE and adjusted diluted PE were ~35 and ~25.
It generated $6.927B of FCF in FY2023 and the diluted weighted average shares outstanding was 388 million thus resulting in ~$17.85 of FCF/share and a P/FCF of ~31.
The company’s FY2024 adjusted EPS guidance was $20.95 – $22. On this basis, the forward adjusted diluted PE range was ~25 – ~26.
I expected the current forward-adjusted diluted broker estimates to be adjusted over the coming days. Based on the currently available estimates, however, TMO’s forward-adjusted diluted PE levels were:
- FY2024 – 26 brokers – a forward-adjusted diluted PE of ~25 using a mean of $21.90 and low/high of $21.31 – $25.71.
- FY2025 – 24 brokers – a forward-adjusted diluted PE of ~22 using a mean of $24.49 and low/high of $23.38 – $28.09.
- FY2026 – 13 brokers – a forward-adjusted diluted PE of ~20 using a mean of $27.38 and low/high of $26.25 – $30.53.
Using the $6.75B mid-point of TMO’s FY2024 FCF guidance and guidance for the full year average diluted share count of ~383 million shares, I arrived at ~$17.62 FCF/share and P/FCF of ~31.
TMO’s valuation was slightly less attractive than when I wrote my November 14 and December 8 posts. I noted, however, that TMO’s share price, however, can be volatile. If the share price were to retrace to at least ~$520 I would look to increase my exposure. At ~$520 and using management’s FY2024 adjusted diluted EPS guidance, the forward adjusted diluted PE would be ~23.6 – ~24.8. From a P/FCF perspective, I arrived at ~29.5 (~$520/~$17.62).
TMO has now revised its adjusted EPS guidance to $21.29 – $22.07. Using the current ~$608 share price as I finalize this post shortly before the July 26 market close, the forward adjusted diluted PE is ~27.5 – ~28.6.
Downward revisions have been made to the forward-adjusted diluted broker estimates following the earnings release and more are likely over the coming days. Using the currently available estimates, however, TMO’s forward-adjusted diluted PE levels are:
- FY2024 – 26 brokers – a forward-adjusted diluted PE of ~28 using a mean of $21.74 and low/high of $21.54 – $21.95.
- FY2025 – 27 brokers – a forward-adjusted diluted PE of ~25.4 using a mean of $23.96 and low/high of $21.55 – $25.37.
- FY2026 – 21 brokers – a forward-adjusted diluted PE of ~22.6 using a mean of $26.85 and low/high of $22.61 – $28.80.
TMO’s FY2024 FCF and weighted average diluted shares outstanding outlook assumptions are for $6.5B – $7B of FCF and ~383 million shares. Divide the FCF assumption by ~383 million shares and we get a FCF/share range of ~$17 – ~$18.3. Using the current ~$608 share price, the forward P/FCF is ~33.2 – ~35.8. I just can’t bring myself to acquire shares at this valuation.
Final Thoughts
Warren Buffett has often quoted his mentor, Ben Graham, as saying:
In the short run, the market is a voting machine – reflecting a voter-registration test that requires only money, not intelligence or emotional stability – but in the long run, the market is a weighing machine.
TMO’s share price behavior over the past few years is a perfect example of this.
In my prior post, I noted that management’s FY2024 outlook was for demand softness and I expected this to pressure TMO’s valuation. I concluded that TMO’s share price can be volatile and a share price decline to at least ~$520 was not out of the realm of possibility.
Just within the past year, TMO’s share price range is ~$416 – ~$608! In reviewing TMO’s performance, there is nothing suggesting this share price behavior is justified.
I hold 177 shares (52 shares and 125 shares in two different ‘Core’ accounts) in the FFJ Portfolio. When I completed my 2024 Mid Year FFJ Portfolio Review, TMO was my 28th largest holding; it was my 30th largest holding when I completed my 2023 Year End FFJ Portfolio Review.
As noted earlier, the dividend component of TMO’s total long term investment return is likely to continue to be negligible. It is, therefore, imperative we acquire shares at an attractive valuation.
While TMO’s share price has fluctuated in the ~$528 – ~$600 range following that February 2, 2024 post, I failed to add to my exposure close to $528. Now I have to hope that we get a broad market pullback and that TMO’s share price gets caught in any downdraft. If the share price reaches ~$530 (or lower), I intend to add to my exposure.
I wish you much success on your journey to financial freedom!
Note: Please send any feedback, corrections, or questions to finfreejourney@gmail.com.
Disclosure: I am long TMO.
Disclaimer: I do not know your circumstances and do not provide individualized advice or recommendations. I encourage you to make investment decisions by conducting your research and due diligence. Consult your financial advisor about your specific situation.
I wrote this article myself and it expresses my own opinions. I do not receive compensation for it and have no business relationship with any company mentioned in this article.