I would have preferred to wait for the release of Stryker’s (SYK) FY2022 Form 10-K. However, I have sufficient information in its January 31, 2023 Q4 2022 Form 8-K and the Form 10-Ks from prior years by which to make an investment decision.
In this post, I point out several observations that convinced me SYK no longer fits my risk profile. I have, therefore, exited my position on February 8.
Financials
Q4 and FY2022 Results
In addition to SYK’s Q4 2022 Form 8-K, I have used SYK’s Form 10-K from prior years as part of this analysis. These are accessible here.
FY2023 Guidance
FY2023 guidance assumes CAPEX guidance of ~$0.6B and a gradual improvement of the global operating environment, including a progressive easing of supply chain disruptions throughout the year. However, given the current macroeconomic volatility caused by supply chain disruptions, inflationary risks and currency fluctuations, expectations are for 7% – 8% organic net sales growth and adjusted net EPS of $9.85 – $10.15.
If foreign exchange rates hold near current levels, sales and EPS are anticipated to be modestly unfavourably impacted for the full year, being more negative in the first half of the year.
Furthermore, Q1 2023 adjusted diluted EPS is not expected to be much better than Q1 2022 because, in Q1 2022, SYK did not experience the inflationary pressures it is currently experiencing.
Questionnable Acquisitions
In November 2019, I initiated a position following the announcement of SYK’s intent to acquire Wright Medical for an aggregate purchase price of $4.1B ($5.6B including convertible notes); the acquisition was completed on November 11, 2020.
I considered this to be a very expensive acquisition considering Wright had reported a net loss and negative free cash flow for several consecutive years. On the bright side, Wright had grown its annual revenue from ~$0.298B in FY2014 to ~$0.921B in FY2019.
This acquisition made strategic sense to me in that Wright was a global medical device company focused on surgical solutions for the upper extremities (shoulder, elbow, wrist and hand), lower extremities (foot and ankle) and biologics markets, three of the fastest growing segments in orthopaedics. By combining the two companies, I was cautiously optimistic SYK would become a stronger company. Furthermore, SYK stated that a priority was to repay the debt incurred to acquire Wright.
While SYK made some subsequent tuck-in acquisitions, what threw me for a loop was its January 2022 announcement to acquire Vocera Communications for a total equity value of ~$2.97B and a total enterprise value of ~$3.09B (including convertible notes). Looking at Vocera’s product offering, it is apparent that SYK is venturing into a space that is entirely different from its core business. Furthermore, Vocera was an unprofitable company that generated FY2011 – FY2021 annual sales of (in millions) $79.5, $101.0, $102.5, $95.4, $104.1, $127.7, $166.0, $179.6, $180.5, $198.4, and $234.2.
In my opinion, SYK grossly overpaid for BOTH companies. In addition, I expected SYK to focus on debt reduction as opposed to making a second richly priced acquisition.
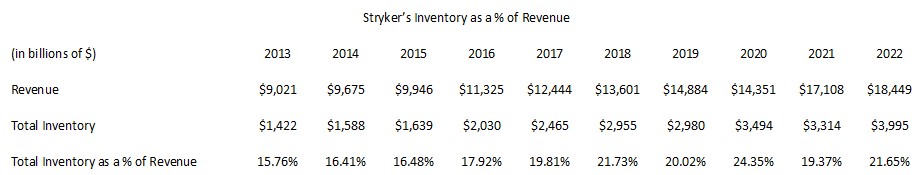
Bloated Inventory
Total inventory as a percentage of revenue has increased significantly within the past decade. We can partially attribute the FY2020 percentage to a deterioration in business conditions due to COVID. However, FY2021 and FY2022 levels reflect no improvement from FY2018 and FY2019 levels.
Inventory Accounting Revisions
Interestingly, SYK has changed how it reports its inventory.
On page 24 in the FY2017 Form 10-K and 2018 Form 10-K, SYK states:
Inventories: Inventories are stated at the lower of cost or market, with cost generally determined using the first-in, first-out (FIFO) cost method. For excess and obsolete inventory resulting from the potential inability to sell specific products at prices in excess of current carrying costs, reserves are maintained to reduce current carrying cost to market prices.
On page 24 in the FY2019 Form 10-K, SYK states:
Inventories: Inventories are stated at the lower of cost or net realizable value, with cost generally determined using the first-in, first-out (FIFO) cost method. For excess and obsolete inventory resulting from the potential inability to sell specific products at prices in excess of current carrying costs, reserves are maintained to reduce current carrying cost to market prices.
On pages 27 and 28 in the FY2020 Form 10-K and on page 28 in the FY2021 Form 10-K, SYK states:
Inventories: Inventories are stated at the lower of cost or net realizable value, with cost generally determined using the first-in, first-out (FIFO) cost method. For excess and obsolete inventory resulting from the potential inability to sell specific products at prices in excess of current carrying costs, reserves are maintained to reduce current carrying cost to net realizable value.
Goodwill and Other Intangibles
At FYE2016, SYK’s Goodwill and Other Intangibles were ~$6.4B and ~$3.5B for a total of ~$9.9B. This represented ~48.5% of SYK’s ~$20.4B in Total Assets.
Fast forward to FYE2022 and SYK’s Goodwill and Other Intangibles amounted to ~$19.8B. This represented ~53.7% of SYK’s $36.9B in Total Assets.
Free Cash Flow (FCF)
Free Cash Flow is a useful metric in assessing a company’s cash flows to service debt, pay dividends and fund acquisitions and share repurchases. Essentially, it represents the cash available after funding operations and investments. It is calculated as net income, plus non-cash expenses, less any increases in net working capital, capital expenditures, and other investments. It is the cash that is freely available to all equity and debt investors in a company.
However, FCF is a non-GAAP measure and how it is calculated is not consistent. For example, some may determine SYK’s annual FCF for the FY2013 – FY2022 timeframe to be (in millions of $) $1.691, $1.549, $0.711, $1.425, $0.961, $2.038, $1.542, $2.790, $2.738, and $2.036. These figures are calculated by deducting CAPEX from Cash Provided by Operating Activities.
SYK, however, calculates FCF somewhat differently. In addition to deducting the amount spent in the purchase of property, plant and equipment, it also adds back proceeds from long-lived asset disposals and the impact of certain legal settlements and recall payments. It excludes such items because it considers these to affect the comparability of operating results and the earnings to measure earnings performance on a consistent and comparable basis. As a result, the figures reflected above differ somewhat from those calculated by SYK.
This is why FCF should merely be one metric to analyze. Secondly, investors should determine if the exclusions are ‘one off’ or whether they tend to be recurring.


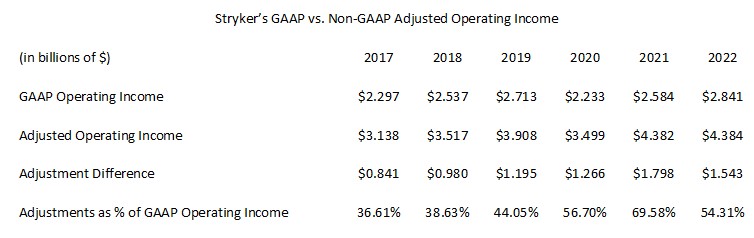
Stryker’s GAAP vs. Non-GAAP Adjusted Operating Income
Over the past 6 fiscal years, SYK has reported a significant difference in its GAAP versus non-GAAP Adjusted Operating Income.
In FY2022, SYK reported $6.17 in diluted EPS and adjusted diluted EPS of $9.34 for a variance of $3.17. We also see a significant variance in prior years.
- FY2015: $3.78 diluted EPS versus $5.12 adjusted diluted EPS, a variance of $1.34.
- FY2016: $4.35 diluted EPS versus $5.80 adjusted diluted EPS, a variance of $1.45.
- FY2017: $2.68 diluted EPS versus $6.49 adjusted diluted EPS, a variance of $3.81.
- FY2018: $9.34 diluted EPS versus $7.31 adjusted diluted EPS, a variance of ($2.03).
- FY2019: $5.48 diluted EPS versus $8.26 adjusted diluted EPS, a variance of $2.78.
- FY2020: $4.20 diluted EPS versus $7.43 adjusted diluted EPS, a variance of $3.23.
- FY2021: $5.21 diluted EPS versus $9.09 adjusted diluted EPS, a variance of $3.88.
The reason GAAP EPS exceeds non-GAAP EPS in 2018 is that it reported NEGATIVE income taxes of ($1.197B). Details regarding SYK’s income taxes are found in Note 11 in the FY2018 Form 10-K (page 34). In this note we see:
‘Our effective tax rate was (50.8%), 50.6%, and 14.3% for 2018, 2017 and 2016. The effective income tax rate for 2018 reflects the tax effect related to the transfer of intellectual properties between tax jurisdictions, the continuing impact of complying with the Tax Cuts and Jobs Act of 2017 (the Tax Act), and continued lower effective income tax rates as a result of our European operations.’
Were it not for this one-time change, SYK’s diluted EPS would have been less than its adjusted diluted EPS as in the other years.
Change in Depreciation
In the FY2019 and prior Form 10-Ks, SYK computed depreciation by the straight-line method over the estimated useful lives of 3 to 30 years for buildings and improvements and 3 to 10 years for machinery and equipment. Commencing in FY2020, this was changed to 3 to 30 years for buildings and improvements and 3 to 15 years for machinery and equipment.
By increasing the high end of the useful life assumption from 10 to 15 years, it had the effect of lowering depreciation expense and increasing EPS.
Debt
At FYE2016, SYK had Total Liabilities and Shareholders’ Equity of ~$20.44B of which Total Liabilities amounted to ~$10.9B (~53.3%); ~$6.7B was long-term debt and ~$0.2B was the current portion of long-term debt.
At FYE2022, SYK had Total Liabilities and Shareholders’ Equity of ~$36.9B of which Total Liabilities amounted to ~$20.3B (~55%); ~$11.9B was long-term debt and ~$1.1B was the current portion of long-term debt.
Please refer to the Credit Ratings section below for a further discussion about SYK’s debt.
Credit Ratings
Immediately following the January 6, 2022 announcement of the proposed Vocera Communication acquisition, S&P Global placed SYK’s domestic senior unsecured long-term debt ratings under review with negative implications. On February 25, 2002, S&P downgraded SYK’s domestic long-term debt rating from A- to BBB+ thereby bringing the rating in line with that assigned by Moody’s; Moody’s downgraded SYK’s domestic long-term issuer rating to Baa1 from A3 in February 2016.
Both ratings are at the top of the lower-medium grade category and define SYK as having an ADEQUATE capacity to meet its financial commitments. However, adverse economic conditions or changing circumstances are more likely to lead to a weakened capacity of the obligor to meet its financial commitments.
The ratings are investment grade and meet my risk profile. However, when I consider the rating downgrade by S&P Global together with the other factors I have identified, I am not prepared to retain my SYK exposure.
Dividends and Share Repurchases
Dividend and Dividend Yield
SYK has a track record of increasing dividends. Debt reduction and tuck-in acquisitions rank in priority from a capital allocation perspective.
SYK’s current quarterly dividend is $0.75. Using my $271.52 exit price, the dividend yield is ~1.1%. In comparison, the dividend yield when I wrote my November 22, 2021 post and my January 29, 2022 post was ~1% and ~1.15%, respectively.
Share Repurchases
The weighted-average diluted shares outstanding (in millions) in FY2011 – FY2021 are 390, 383, 382, 383, 381, 379, 380, 380, 380, 380, 382, and 382.
SYK discontinued the repurchase of outstanding shares in 2019 when it announced its intent to acquire Wright Medical. No shares were repurchased in FY2021 and FY2022 and none are expected to be repurchased in FY2023; management states the focus is on debt reduction.
Valuation
In FY2022, SYK reported $6.17 in diluted EPS. Using my $271.52 exit price, the diluted PE is ~44. In contrast, SYK reported FY2022 adjusted diluted EPS of $9.34. Using my exit price, we get an adjusted PE of ~29.1.
When I wrote my November 22 post, the projected adjusted diluted PE levels based on current FY2021 – FY2023 broker guidance were:
- FY2021 – 25 brokers – mean of $9.12 and low/high of $9.08 – $9.20. Using the mean, the forward adjusted diluted PE was ~29.
- FY2022 – 25 brokers – mean of $10.21 and low/high of $9.75 – $10.95. Using the mean, the forward adjusted diluted PE was ~26.
- FY2023 – 20 brokers – mean of $11.32 and low/high of $10.93 – $12.26. Using the mean, the forward adjusted diluted PE was ~23.3.
At the time of my January 29, 2022 post, management’s FY2022 adjusted diluted EPS guidance was $9.60 – $10.00 for a current forward adjusted PE range of ~24 – ~25 based on a ~$241 share price. The projected adjusted diluted PE levels based on current guidance and this share price were:
- FY2022 – 28 brokers – mean of $10.15 and low/high of $9.75 – $10.95. Using the mean, the forward adjusted diluted PE is ~23.7.
- FY2023 – 23 brokers – mean of $11.22 and low/high of $10.67 – $12.26. Using the mean, the forward adjusted diluted PE is ~21.5.
- FY2024 – 7 brokers – mean of $12.22 and low/high of $11.91 – $12.47. Using the mean, the forward adjusted diluted PE is ~20.
Using my $271.52 exit price and management’s FY2023 adjusted diluted EPS guidance of $9.85 – $10, the forward adjusted diluted PE range is ~27.15 – ~27.57.
The projected adjusted diluted PE levels based on current broker guidance and my exit price are:
- FY2023 – 25 brokers – mean of $10.02 and low/high of $9.86 – $10.17. Using the mean, the forward adjusted diluted PE is ~27.1.
- FY2024 – 24 brokers – mean of $11.12 and low/high of $10.89 – $11.57. Using the mean, the forward adjusted diluted PE is ~24.4.
- FY2025 – 13 brokers – mean of $12.20 and low/high of $11.83 – $12.65. Using the mean, the forward adjusted diluted PE is ~22.3.
Final Thoughts
I generally do not like to exit positions but after delving into SYK’s financials and FY2023 guidance, I find that SYK no longer fits my risk profile. I have, therefore, sold all my SYK shares at $271.52/share for a ~$74/share gain.
Not only do I not like the direction in which SYK is headed, but it also has never been close to a top-30 holding. I do not follow it closely as borne out by my January 29, 2022 post being the last time I reviewed this holding.
SYK could prove me wrong. However, given that I expect a broad market pullback in 2023, I have opted to take my profits. The sale proceeds shall remain in cash until I can increase my exposure to one or more of my top 30 holdings at a reasonable valuation.
I wish you much success on your journey to financial freedom!
Note: Please send any feedback, corrections, or questions to finfreejourney@gmail.com.
Disclosure: I do not have exposure to SYK and have no intention of acquiring shares in the foreseeable future.
Disclaimer: I do not know your circumstances and do not provide individualized advice or recommendations. I encourage you to make investment decisions by conducting your research and due diligence. Consult your financial advisor about your specific situation.
I wrote this article myself and it expresses my own opinions. I do not receive compensation for it and have no business relationship with any company mentioned in this article.