
When I completed my 2023 year end portfolio review, S&P Global Inc. (SPGI) was my 8th largest holding. In early 2024, however, the Canadian Federal government introduced changes to the level of taxation on capital gains. This resulted in many Canadians having to seek professional tax advice.
Following extensive discussions with our tax accountants, we sold shares in a particular account prior to June 25, 2024; SPGI shares were included in the list the shares we were advised to sell.
In my June 11, 2024 post, I touch upon the changes to our holdings.
In my 2024 year-end portfolio review, I disclose that SPGI had fallen to our 17th largest holding.
Subsequent to the share sales on June 5, 2024, I repurchased an equal or greater number of shares of at a lower price than at the time of disposition in the following:
- Mastercard (MA)
- Visa (V)
- CME Group (CME)
- Brookfield Asset Management (BAM.to).
In hindsight, I should have immediately repurchased 200 SPGI shares.
Fast forward to March 3, 2025 and I have acquired 100 SPGI shares @ ~$518.76 in a ‘Side’ account within the FFJ Portfolio.
Business Overview
Learn about SPGI’s business and risk factors by reading Part 1 in the FY2024 10-K and the company’s website.
The following, extracted from the 2024 edition of SPGI’s Investor Factbook, provides a good overview of SPGI’s medium-term financial targets.
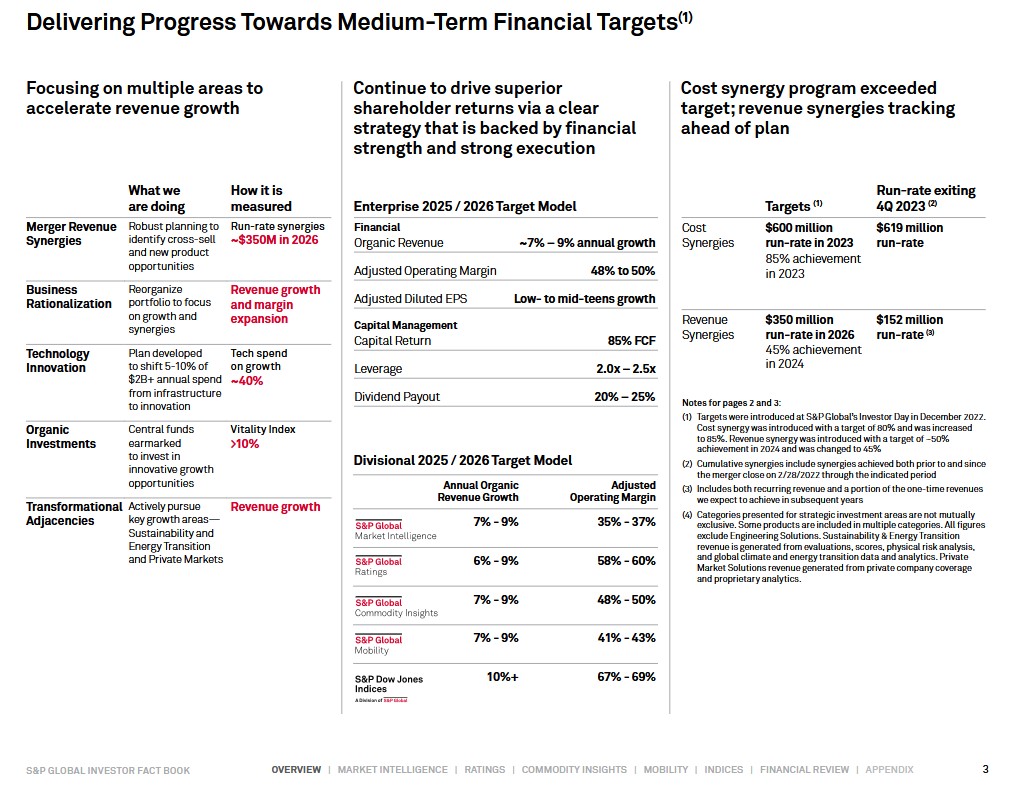
SPGI has established a wide moat from its data-driven benchmarks. These benchmarks are embedded in the financial system thus resulting in the company having a strong competitive position and strong operating margins.
NOTE: There are various global rating agencies with SPGI, Moody’s, Fitch, Morningstar (DBRS), and A.M. Best being the most recognizable.
In February 2022, SPGI S&P completed its $44B acquisition of IHS Markit. As noted in my prior SPGI post, IHS Markit’s recurring revenue model diversifies SPGI’s revenue, thus limiting upside and downside scenarios.
Financial Results
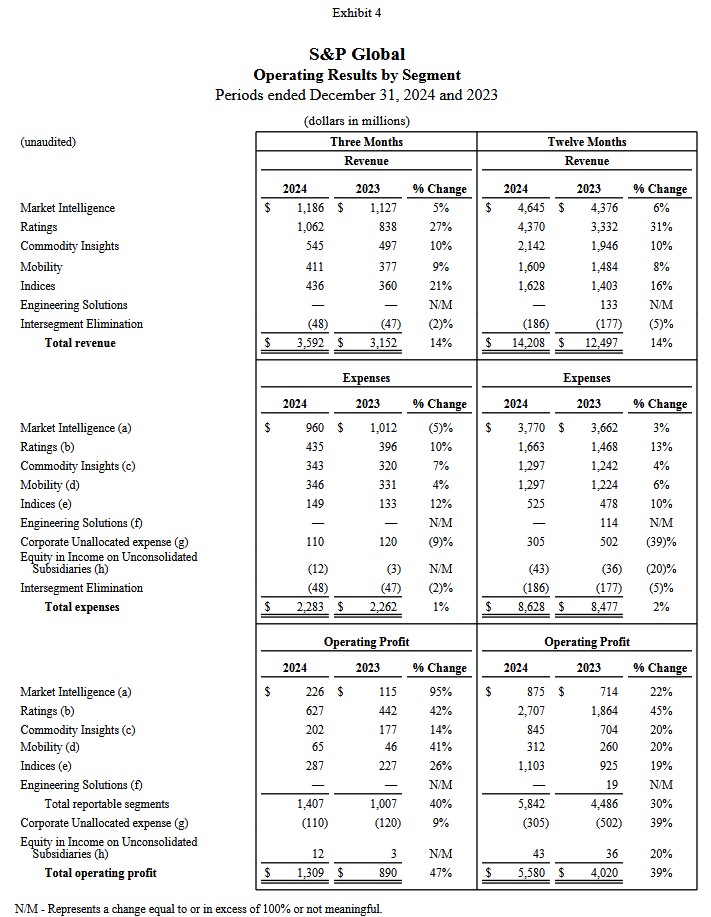
Q4 and FY2024 Results
Material related to the Q4 and FY2024 earnings is accessible here.
Excluding Engineering Solutions, which was divested in 2023, revenue increased ~15%.
Revenue from SPGI’s subscription products increased ~7%.
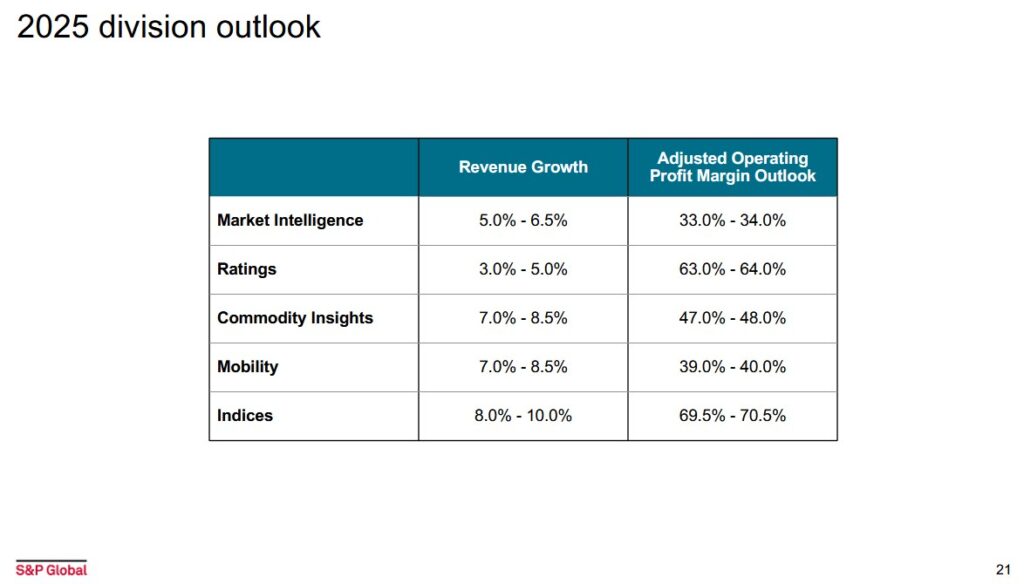
SPGI benefited from strong market trends, including record debt issuance for its Ratings business and strong equity valuations for its index business.
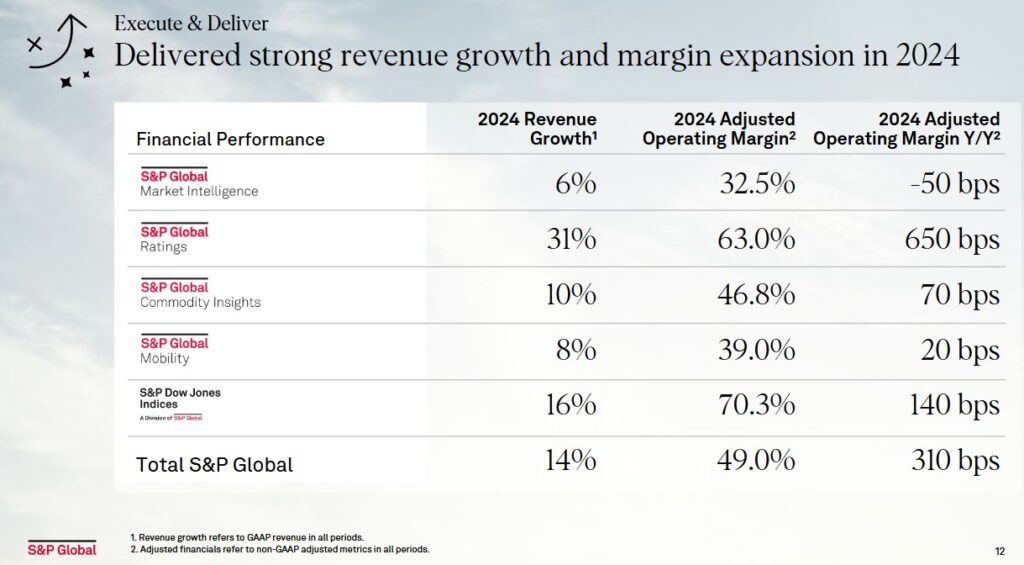
Despite some market headwinds in its market intelligence and mobility business segments, SPGI still reported revenue growth and an +30% adjusted operating margin in both segments.
A balanced approach to profitability and investment enabled SPGI to make important investments in technology, AI and products while still expanding margins by 310 bps.
Adjusted diluted EPS grew ~25% and exceeded the midpoint of SPGI’s initial guidance range by more than 13%.
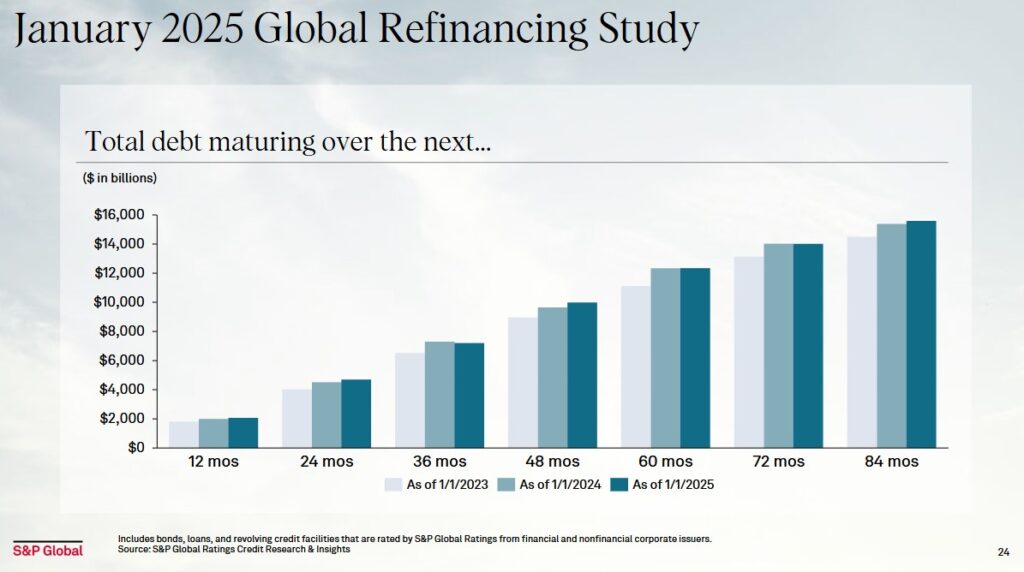
The Ratings segment of SPGI’s business generates a considerable portion of SPGI’s Operating Profit.
I am, therefore, keenly interested in knowing the maturing debt outlook over the next few years as this gives an indication of the Ratings segment’s revenue generating potential.
Operating Cash Flow (OCF), Free Cash Flow (FCF), and CAPEX
SPGI deducts CAPEX from OCF to calculate its FCF. In recent posts, however, I explain my rationale for also deducting share-based compensation (SBC) from a company’s OCF.
The following reflects SPGI’s FCF using the conventional and modified methods.
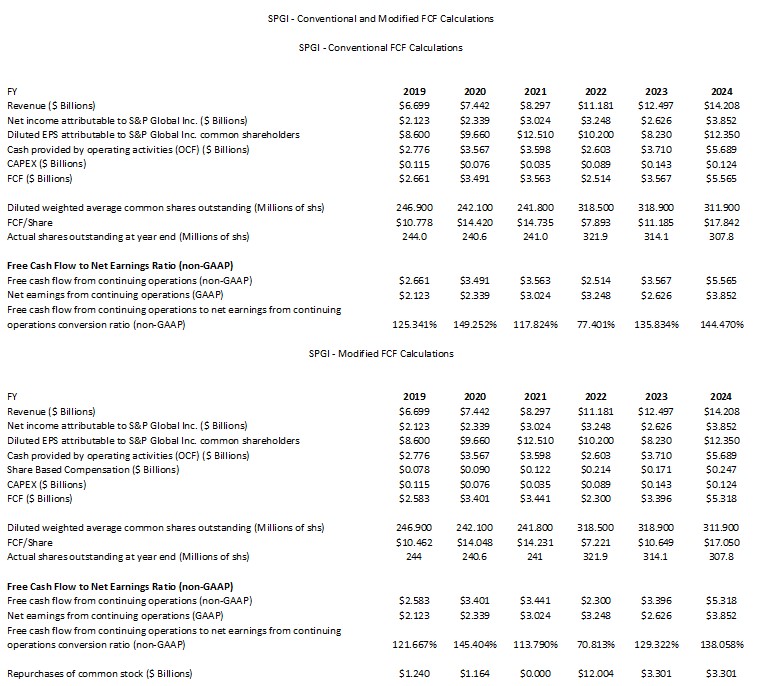
Deducting SBC to arrive at SPGI’s annual FCF results in a relatively modest lower FCF level than what SPGI communicates in its earnings presentations.
Other than FY2022 which is the year in which SPGI completed the IHS Markit acquisition, it typically generates more FCF than EPS.
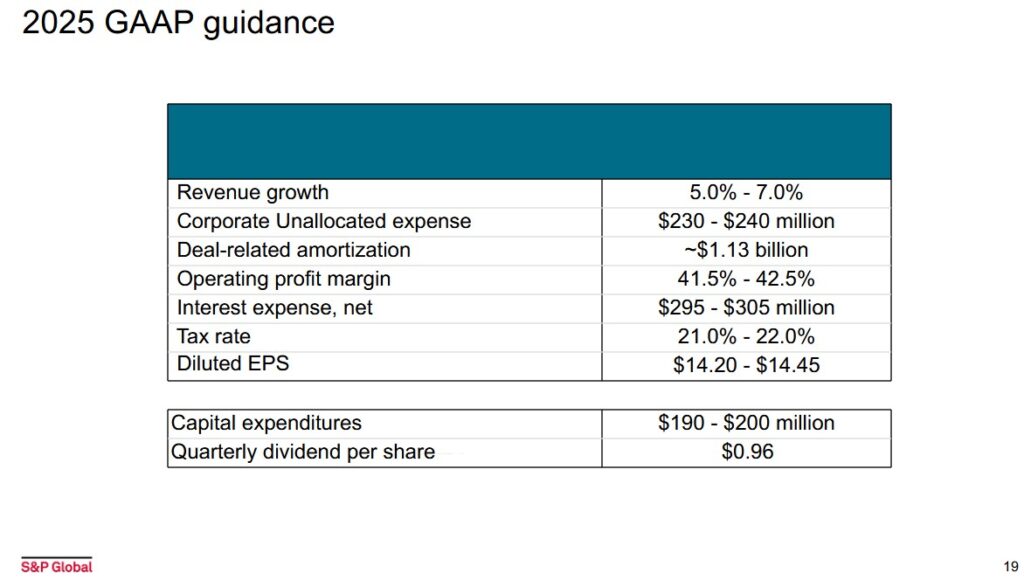
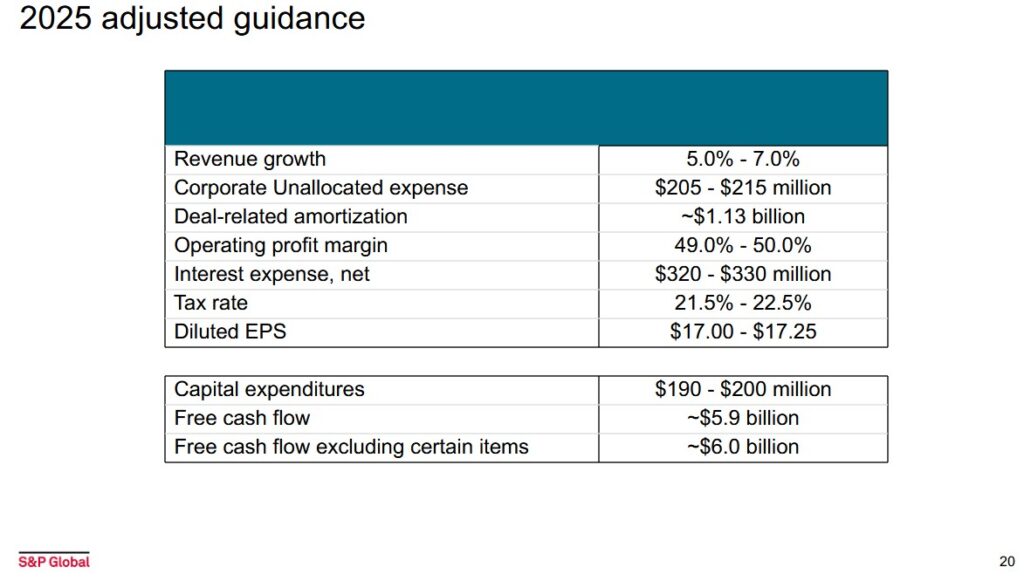
FY2025 Guidance
SPGI’s FY2025 outlook, extracted from its 4Q and FY2024 Earnings Supplemental Disclosure, is as follows:
Risk Assessment
The fact S&P Global Rating is one of four reportable segments of SPGI’s operations gives me some comfort the company will do what it takes to have and maintain an investment credit rating. If SPGI were to be non-investment grade, I think many questions would arise as to why a company in the business of rating other entities can not even maintain an investment-grade rating.
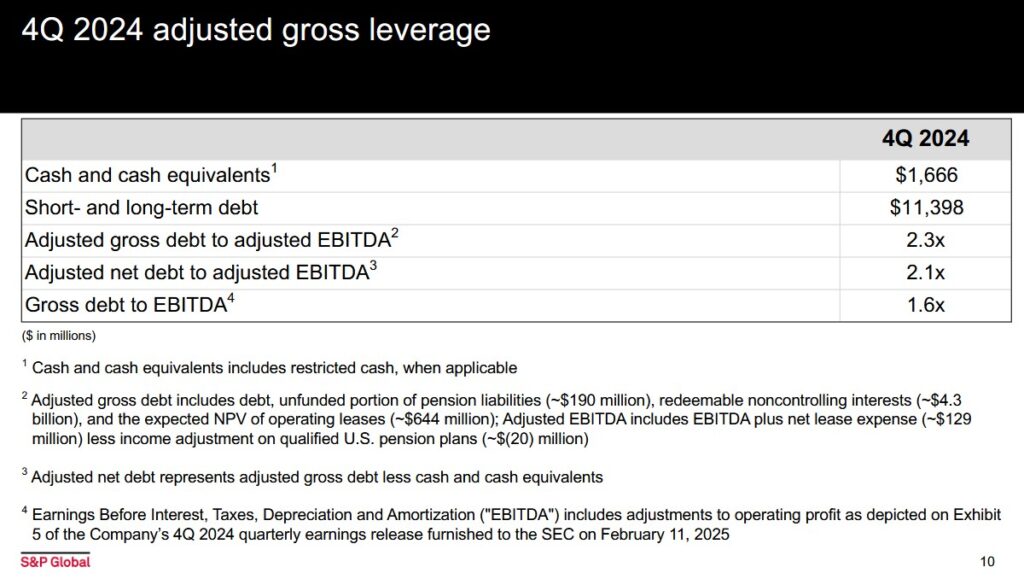
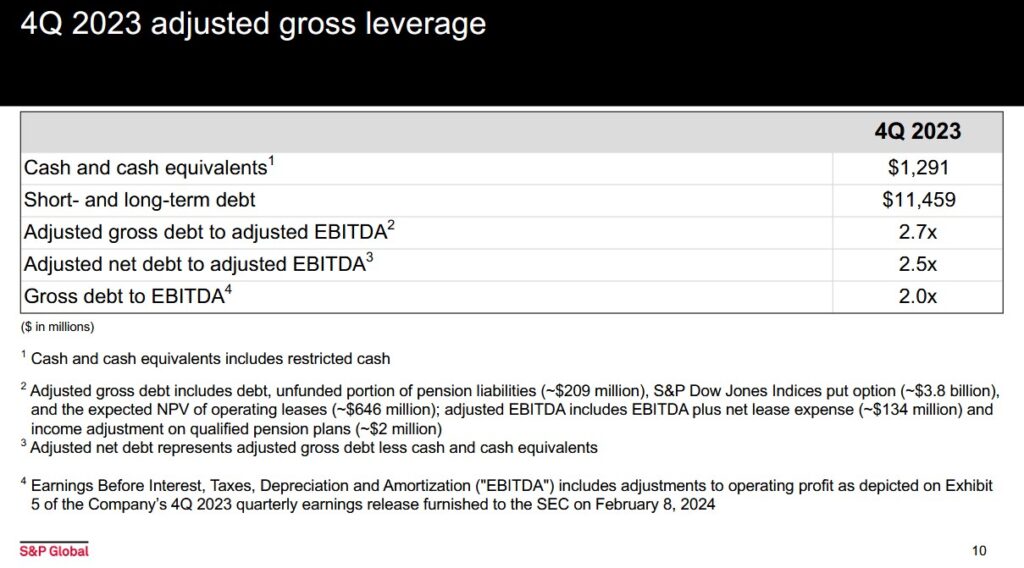
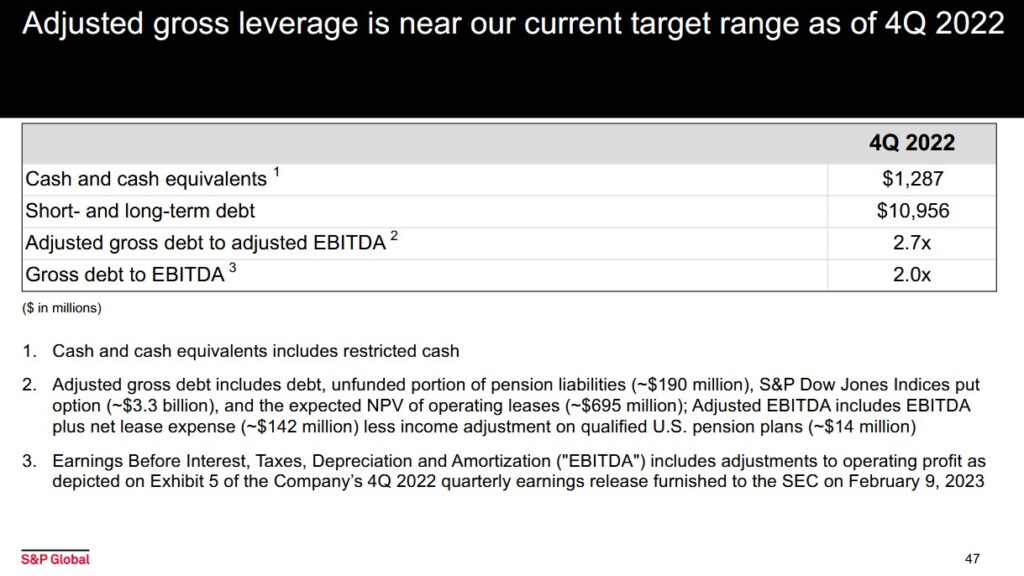
SPGI’s gross debt/EBITDA range (Earnings before Interest, Taxes, and Amortization) was 1.75 – 2.25 as a stand-alone entity. After the IHS Markit merger in 2022, however, the range was increased to 2 – 2.5 times EBITA because INFO’s leverage is higher than that of SPGI.
Action is taken to restore leverage to within the range once leverage falls outside this range. If leverage is below the lower end of the new range, SPGI adds additional leverage on the balance sheet to ensure an optimal overall corporate financing structure. When there is excess cash and excess capital, this presents an opportunity to increase returns to shareholders.
The following shows a gradual improvement in SPGI’s gross leverage following the IHS Markit merger.
On August 8, 2018, Moody’s upgraded SPGI’s domestic senior unsecured debt from Baa1 to A3 which is the lowest tier within the upper-medium investment-grade group of ratings.
This rating means SPGI has a STRONG capacity to meet its financial commitments. It is, however, somewhat more susceptible to the adverse effects of changes in circumstances and economic conditions than obligors in higher-rated categories.
SPGI’s credit risk is acceptable from my perspective.
Dividend and Dividend Yield
SPGI’s dividend history on its website only dates back to 1995 but its track record of consecutive years of dividend increases extends well beyond this.
Investors would be wise not to focus solely on the dividend return but rather the overall potential return. With most of SPGI’s potential return likely to come from capital gains, it is all that much more important to acquire shares when attractively or fairly valued!
Share Repurchases
The weighted average diluted shares outstanding for FY2019 – FY2024 is reflected in the table provided above.
SPGI has a newly approved share repurchase authorization up to $4.3B.
Valuation
My preference is to gauge a company’s valuation based on cash flow. I do, however, also consider GAAP and non-GAAP earnings guidance.
Using management’s GAAP diluted EPS guidance of $14.20 – $14.45 and my $518.76 purchase price, the forward diluted PE is ~36.2 based on the ~$14.325 mid-point. The forward adjusted diluted PE is ~30.3 based on the ~$17.125 mid-point of management’s $17.00 – $17.25 adjusted guidance.
The forward-adjusted diluted PE levels using my purchase price and the current broker estimates are:
- FY2025 – 20 brokers – ~30.1 using a mean of $17.21 and low/high of $16.40 – $17.51.
- FY2026 – 20 brokers – ~27 using a mean of $19.27 and low/high of $18.15 – $19.80.
- FY2027 – 12 brokers – ~24.1 using a mean of $21.56 and low/high of $20.05 – $22.45.
On the Q4 earnings call, management states its intention to maintain its target of returning 85% or more of the 2025 $6B FCF forecast ($6B x 85% = ~$5.1B) in the form of dividends and share repurchases.
At FYE 2022 – 2024 the actual shares outstanding were (in millions) 321.9, 314.1, and 307.8. Using a weighted-average number of diluted common shares outstanding of 304 million and a $0.96 quarterly dividend, we can expect SPGI to distribute ~$292 million a quarter in dividends or ~$1.167B in FY2025 (~$1.147B, and ~$1.134B in FY2023 and FY2024).
Subtract $1.167B from the $5.1B SPGI plans to return to shareholders and we get ~$3.93B to be returned in the form of share repurchases (versus $3.3B in FY2023 and FY2024). If it repurchases shares @ ~$560, this works out to share repurchases of ~7 million giving us FYE2025 shares outstanding of ~300 million. The FYE2024 shares outstanding was 307.8 million so the mid-point of this value and 300 million is ~304 million.
To estimate SPGI’s valuation using FCF, divide management’s $6B guidance by ~304 million shares. We get ~$19.74 in FCF/share. Divide my $518.76 purchase price by ~$19.74 and the forward P/FCF is ~26.3.
If we estimate FY2025’s SBC will be ~$0.255B (~$0.247B in FY2024), the FY2025 FCF drops to ~$5.745B ($6B – ~$0.255B). Divide this by 304 million shares and we get ~$18.90 FCF/share. Divide $518.76 by ~$18.90 and the P/FCF is ~27.4.
Final Thoughts
On October 25, 2018, I initiated a 200 shares position in SPGI @ $175.88 in one of the ‘Side’ accounts in the FFJ Portfolio. I subsequently acquired an additional 350 shares in January 2021, February 2022, and May 2022 at an average cost of ~$354.79 in a ‘Core’ account in the FFJ Portfolio.
It was never my intention to sell the 200 shares in the ‘Side’ account but the Canadian Federal government’s decision to change the rules regarding the tax treatment of capital gains forced my hand. In hindsight, I should have repurchased the shares I had to sell; my failure to do so goes along with the multiple investing errors I have made over the last ~4 decades of investing.
Since there is a reasonable probability that SPGI’s share price may experience further weakness, I purposely acquired only 100 shares on March 4, 2025. I fully intend to acquire additional shares if SPGI’s valuation improves.
I wish you much success on your journey to financial freedom.
Note: Please send any feedback, corrections, or questions to finfreejourney@gmail.com.
Disclosure: I am long SPGI and MCO.
Disclaimer: I do not know your individual circumstances and do not provide individualized advice or recommendations. I encourage you to make investment decisions by conducting your own research and due diligence. Consult your financial advisor about your specific situation.