
I last reviewed Intuitive Surgical (ISRG) in this July 23, 2024 post at which time it had just released Q2 and YTD2024 results and shares were trading at ~$461. In that post, I state that ISRG was my 7th largest holding when I completed my 2024 Mid Year FFJ Portfolio Review; the share price at the end of June was ~$445.
ISRG has now released Q3 and YTD2024 results following the October 17 market close. On October 18, ISRG’s share price surged ~$47.50 to close the day at ~$521.
In my You Don’t Need 10 Bagger Stocks To Create Financial Freedom, I touch upon how a few good investments can make the world of difference. Investors who invested $10,000 in ISRG in mid-October 2014 have seen their investment increase to ~$100,000 (if they did not interfere by actively trading the shares).
I did not have the foresight to invest in ISRG that long ago and merely initiated a position in the Fall of 2021 with periodic additional investments in the first half of 2022; my average cost is ~$279.50. At the time of those purchases, ISRG was experiencing challenges given the reduction in the number of elective procedures being performed because of lingering COVID headwinds. Shares were at the time, in my opinion, undervalued and/or close to fair valuation.
Now?
I think buying shares at ISRG’s current valuation is fraught with risk.
Let’s have a quick look.
Business Overview
Please review the company’s website and FY2023 Form 10-K if you are unfamiliar with the company.
The Q3 2024 Form 10-Q also contains a wealth of information.
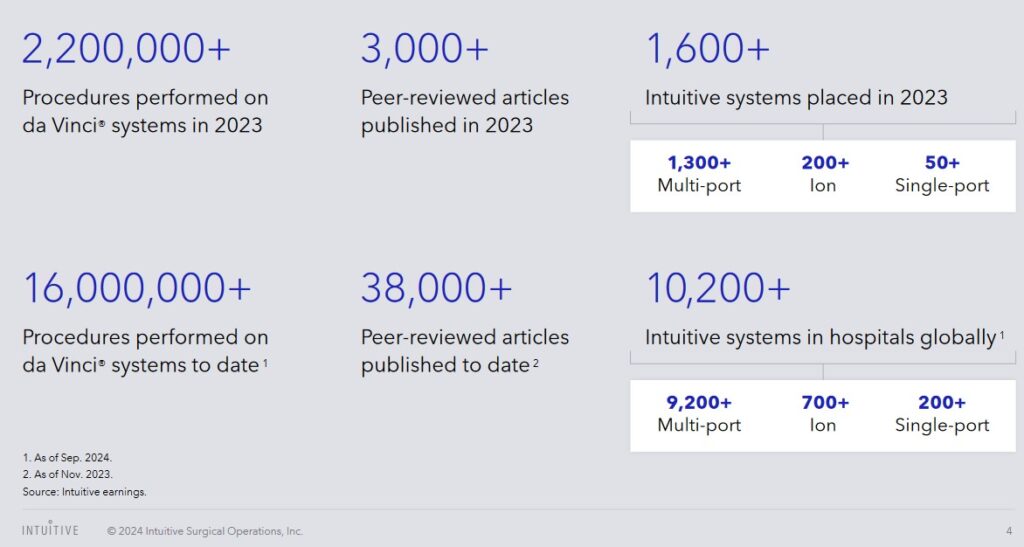
As of March 2024, 14,800,000 procedures were performed on da Vinci surgical systems and ISRG systems were in 9,400+ hospitals globally (8,600 multi-port, 600 Ion, and 200+ single-port). More recent statistics confirm significant growth in the number of medical procedures using ISRG’s various systems.
Financials
Q3 and YTD2024 Results
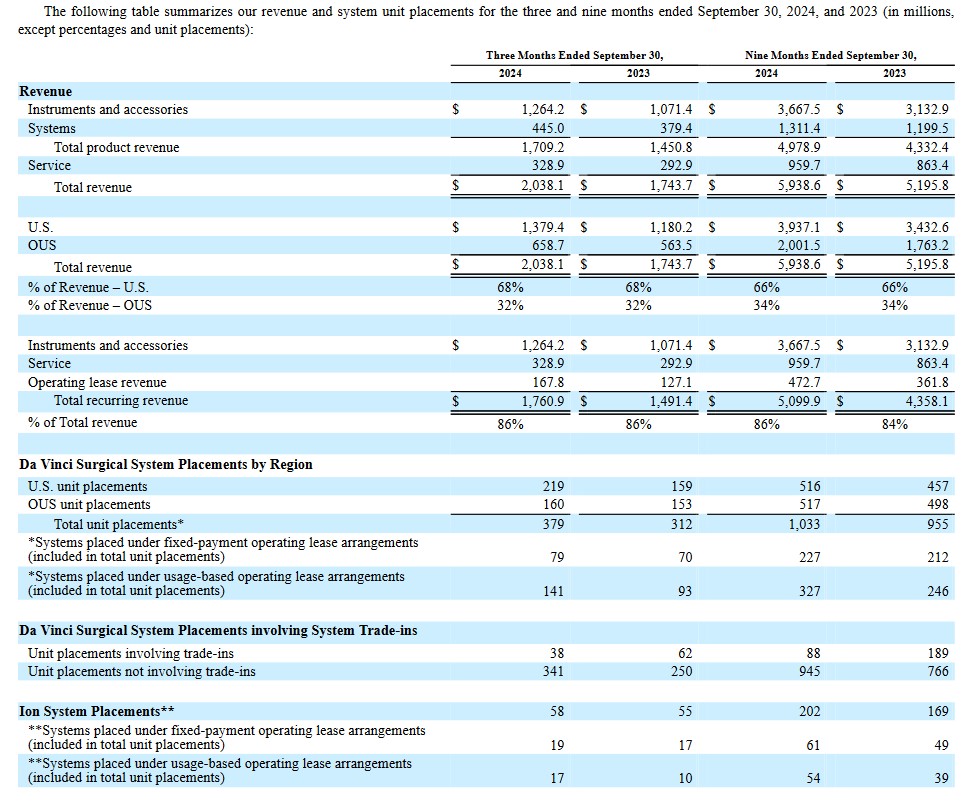
ISRG’s Q3 and YTD2024 results are accessible in the Form 8-K and Form 10-Q (refer to the SEC Filings).
As noted in my July 23, 2024 post, ISRG’s practice of providing detailed quarterly financial information has been discontinued. Instead, less detailed information is provided in the quarterly Form 10-Q.
Operating Cash Flow (OCF), CAPEX, and Free Cash Flow (FCF)
In the FY2014 – FY2023 time frame, ISRG’s:
- OCF was (in B$) 0.665, 0.806, 1.087, 1.144, 1.170, 1.598, 1.485, 2.089, 1.491, and 1.814.
- CAPEX was (in B$) 0.106, 0.081, 0.054, 0.191, 0.187, 0.426, 0.342, 0.340, 0.532, and 1.064.
- FCF was (in B$) 0.560, 0.725, 1.033, 0.953, 0.982, 1.173, 1.143, 1.750, 0.958, and 0.750.
The Q3 2024 Consolidated Statement of Cash Flows reflects ~$1.592B of OCF, ~$0.800B of CAPEX thus giving us ~$0.792B of FCF. In addition to generating impressive OCF and FCF, ISRG invested $0.671B, $0.879B, $1B and $0.851B in R&D in FY2021 – 2023 and the first nine months of FY2024.
In my September 28 How Stock Based Compensation Distorts Free Cash Flow post, I touch upon how a company’s FCF can be distorted.
Over the first 9 months of FY2024, ISRG’s share-based compensation amounted to ~$0.5B. If we do not add back this amount to determine ‘net cash provided by operating activities’, we get ~$1.092B of OCF and ~$0.292B of FCF.
Despite this adjustment, it is hard not to be impressed by ISRG’s ability to invest heavily for future growth without any reliance on debt.
Return On Invested Capital (ROIC)
ISRG’s ROIC (%) in FY2014 – FY2023 is 12.17, 15.3, 14.58, 12.57, 19.78, 18.46, 10.24, 15.05, 11.31, and 13.3.
High quality companies often generate a high ROIC. If a company generates a high ROIC, it needs to invest less to achieve a certain growth rate thus reducing the need for external capital.
A company that generates $0.15/profit for every $1 invested, for example, achieves a ROIC of 15%. I consider a ~15%+ ROIC to be a reasonable minimum threshold because most of the time, a company’s cost of capital will be lower than this level. ISRG’s ROIC often falls short of this level but there are a sufficient number of ‘positives’ that I am willing to make an exception in this case.
When a company consistently generates a high ROIC over the long term and it is growing its revenue, it can reinvest a portion of its profits under favorable conditions thereby leading to a compounding effect. I would much rather invest in a growing company that can reinvest to create greater shareholder value than to invest in a company that has limited growth opportunities and thus chooses to distribute a growing dividend.
FY2024 Outlook
On the Q2 earnings call, ISRG forecast FY2024 procedure growth of 15.5% – 17%. This has been revised to 16% – 17%.
The low end of the range assumes further softening in bariatric procedures along with increasing headwinds in Asia from physician strikes in Korea and from delayed tenders in domestic robotic systems in China impacting capital placements, and therefore, procedure growth. At the high end of the range, the assumption is that bariatric procedures stabilize at current quarter growth rates and headwinds in Korea and China do not worsen. The forecast does not reflect significant impact to elective procedures as a result of IV shortages or other hurricane-related impacts.
ISRG continues to expect its pro forma gross profit margin to be 68.5% – 69% of net revenue; the actual gross profit margin will vary quarterly depending largely on product, regional and trade-in mix and the impact of new product introductions.
Given recent and ongoing capital investments, ISRG expects:
- depreciation expense to increase in the second half; and
- a significant increase starting in Q1 2025.
Guidance for pro forma operating expense growth has been lowered to 10% – 12% versus the prior 10% – 13%.
FY2024 non-cash stock compensation expense is now $0.67B – $0.69B versus the prior guidance of $0.68B – $7B.
Guidance for other income, comprised mostly of interest income, is now $0.325B – $0.345B versus the prior guidance of $0.3B – $0.32B.
The FY2024 CAPEX forecast remains unchanged at $1B – $1.2B (primarily for planned facility construction activities).
The FY2024 pro forma income tax rate range is now 22% – 23% of pretax income versus the prior range of 22% – 24% of pretax income.
Credit Ratings
No rating agency rates ISRG because it has no debt.
Dividend and Dividend Yield
ISRG does not distribute a dividend.
Share Repurchases
One means by way a company can allocate its capital is to repurchase shares. This works wonders when shares are undervalued. Fortunately, ISRG has not repurchased any shares in recent quarters. This would have been a destruction of shareholder value. I suspect management recognizes this.
The weighted average number of diluted shares outstanding in FY2013 – FY2023 (in millions) is 339, 341, 354, 349, 356, 358, 361, 366, 362, and 357.4. ISRG repurchased no shares in Q1 – Q3 2024 to offset the issuance of common stock relating to employee stock plans. As a result, the weighted average number of diluted shares outstanding in Q1, Q2, and Q3 2024 rose to 360.5, 361 and 362.7. There is currently a remaining authorization to repurchase $1.1B of shares.
Valuation
FY2011 – FY2023 PE ratios based on GAAP earnings are 40.02, 30.69, 22.97, 46.20, 37.72, 34.17, 47.07, 72.02, 53.69, 93.18, 77.44, 70.38, and 79.38. At the time of my January 24 post, I anticipated revisions to broker estimates over the coming days. The forward-adjusted diluted PE estimates using the current ~$370 share price, however, were:
- FY2024 – 26 brokers – ~59 based on a mean of $6.29 and low/high of $5.96 – $6.76.
- FY2025 – 21 brokers – ~50 based on a mean of $7.36 and low/high of $6.76 – $8.34.
- FY2026 – 14 brokers – ~43 based on a mean of $8.63 and low/high of $7.84 – $10.12.
When I wrote my April 20, 2024 post, ISRG shares traded at ~$366. Based on the estimates at the time of my post, the forward-adjusted diluted PE estimates were:
- FY2024 – 26 brokers – ~58.4 based on a mean of $6.27 and low/high of $5.96 – $6.58.
- FY2025 – 26 brokers – ~50 based on a mean of $7.34 and low/high of $6.87 – $7.76.
- FY2026 – 18 brokers – ~42.6 based on a mean of $8.60 and low/high of $7.85 – $9.29.
At the time of my July 23, 2024 post, the share price was ~$461. ISRG’s forward-adjusted diluted PE levels using the currently available information were:
- FY2024 – 26 brokers – ~70.3 based on a mean of $6.56 and low/high of $6.21 – $6.75.
- FY2025 – 27 brokers – ~60.7 based on a mean of $7.60 and low/high of $7.16 – $8.01.
- FY2026 – 21 brokers – ~52.0 based on a mean of $8.86 and low/high of $8.28 – $9.56.
Using the ~$521 closing share price of October 18, 2024 and the current broker estimates, ISRG’s forward-adjusted diluted PE levels are:
- FY2024 – 26 brokers – ~76.4 based on a mean of $6.82 and low/high of $6.42 – $7.11.
- FY2025 – 27 brokers – ~66.9 based on a mean of $7.79 and low/high of $7.24 – $8.25.
- FY2026 – 23 brokers – ~57.3 based on a mean of $9.09 and low/high of $8.28 – $9.75.
If I arbitrarily increase the FY2024 adjusted diluted EPS to $8.00, the forward-adjusted diluted PE level is ($521/$8.00) ~65!
In FY2014 – FY2023, its P/FCF metrics were 28.83, 30.10, 24.67, 38.78, 48.70, 51.01, 69.60, 60.96, 59.72, and 59.53.
In my prior post, I estimated that:
- ISRG would generate $1B of FCF in FY2024; and
- the weighted average number of diluted shares outstanding for the full year would be ~361 million.
These estimates resulted in my arrival at $2.77 of FCF/share. Using the ~$461 share price at the time of my July 23 post, the P/FCF was ~166.
Actual YTD2024 results (3 quarters) are:
- ~$0.792B of FCF; and
- 361.4 million weighted average number of diluted shares outstanding.
If I adjust my FY2024 FCF estimate to $1.2B and increase the weighted average number of diluted shares outstanding to 362 million, the FCF/share is ~$3.31. With a ~$521 share price, the P/FCF is ~157 (~$521/$3.31).
To get an indication of the extent of ISRG’s lofty valuation, let’s arbitrarily use $2.667B of FCF for FY2024. Divide this amount by 362 million shares and we get ~$7.37 FCF/share. Using the current ~$521 share price, the P/FCF is ~70.7 (~$521/~$7.37).
Now, what happens if we do not add back share-based compensation to determine ‘net cash provided by operating activities’?
In the first 9 months of FY2024, ISRG incurred ~$0.5B YTD share-based compensation. If we estimate another ~0.167B of share-based compensation in Q4 (1/3 of ~$0.5B), the FY2024 share-based compensation should be ~$0.667B. If we deduct this amount from my $1.2B FCF estimate for the year, we get ~$0.533B of net cash provided by operating activities. Divide this amount by 362 million shares and we get ~$1.47 FCF/share. Using the current ~$521 share price, the P/FCF is ~354 (~$521/~$1.47).
Using $2B of FCF for FY2024 (this is AFTER adding back ~$0.667B of FY2024 share-based compensation) and 362 million shares, we get ~$5.52 FCF/share resulting in a P/FCF of ~94.4 (~$521/~$5.52).
These are by no means exact figures, however, I would want ISRG share price to plunge for me to consider adding to my exposure. With ISRG’s valuation is in the stratosphere, I will remain content to continue to just hold 450 shares held in a Core account within the FFJ Portfolio.
Final Thoughts
My thoughts on ISRG remain the same from those presented in recent previous posts (accessible through the Archives section of this site). Shares are overvalued and appear to be even more so than at the time of my prior posts.
It is hard not to be impressed by the ~$4.23B of cash and cash equivalents and short-term investments and ~$4.08B of liquid long-term investments; ISRG could eliminate 100% of its total liabilities and still have several billion dollars of liquidity.
Some companies may have billions of liquidity. Much of this liquidity, however, might be offset by deferred revenue (customers have prepaid for services to be rendered). ISRG’s short-term deferred revenue is less than $0.43B and less than $0.060B is long-term deferred revenue (reflected in other long-term liabilities).
ISRG may not appeal to some investors because it does not distribute a dividend. Focusing exclusively on dividend metrics, however, can lead to poor investment decisions. A preferable way to look at an investment is the potential total investment return (don’t forget the risk aspect of an investment!).
Since ISRG distributes no dividend it means 100% of any investment return must come from share price appreciation which is achieved through:
- organic growth;
- strategic acquisitions;
- share repurchases; and/or
- expansion in the earnings multiple.
Only #1 appears likely at the present time. Given this, it does not appear to be the right time to acquire shares.
I wish you much success on your journey to financial freedom!
Note: Please send any feedback, corrections, or questions to finfreejourney@gmail.com.
Disclosure: I am long ISRG.
Disclaimer: I do not know your circumstances and do not provide individualized advice or recommendations. I encourage you to make investment decisions by conducting your own research and due diligence. Consult your financial advisor about your specific situation. I wrote this article myself and it expresses my own opinions. I do not receive compensation for it and have no business relationship with any company mentioned in this article.