 When I last reviewed Cintas (CTAS) in this July 18, 2025 post, the company had recently released its FY2025 results and FY2026 guidance. Based on the currently available information and a $224.50 share price, I determined shares were too richly valued to warrant adding to my current exposure.
Fast forward to September 4, 2025 and we now have Q1 2026 results and revisions to the company’s FY2026 outlook. The share price has also retraced to ~$200 as I compose this post. This is, therefore, an opportune time to revisit this existing holding.
Business Overview
Part 1 Item 1 in the FY2025 Form 10-K and the company’s website provide a good overview of the company.
Business Segments
The company’s reportable operating segments are:
- Uniform Rental and Facility Services – consists of the rental and servicing of uniforms and other garments, including flame resistant clothing, mats, mops and shop towels and other ancillary items. In addition to these rental items, restroom cleaning services and supplies and the sale of items from our catalogs to our customers on route are included within this reportable operating segment.
- First Aid and Safety Services- consists of first aid and safety products and services, as well as workplace water services.
- Other – consists of Fire Protection Services and the Uniform Direct Sale operating segment.
Financials
Q1 2026 Results
The Q1 2026 September 24, 2025 earnings release is accessible through CTAS’s website for which there is a link to the company’s EDGAR Filings on the SEC website.
First quarter total revenue grew 8.7% to $2.72B.
The organic growth rate, which adjusts for the impacts of acquisitions and foreign currency exchange rate fluctuations, was 7.8%. Each of the company’s three route-based businesses had strong revenue growth.
Gross margin as a percent of revenue was 50.3%, a 20 bps increase over Q1 2025.
Operating income grew to $617.9 million, an increase of 10.1% over Q1 2025. Diluted EPS of $1.20 grew 9.1% over Q1 2025.
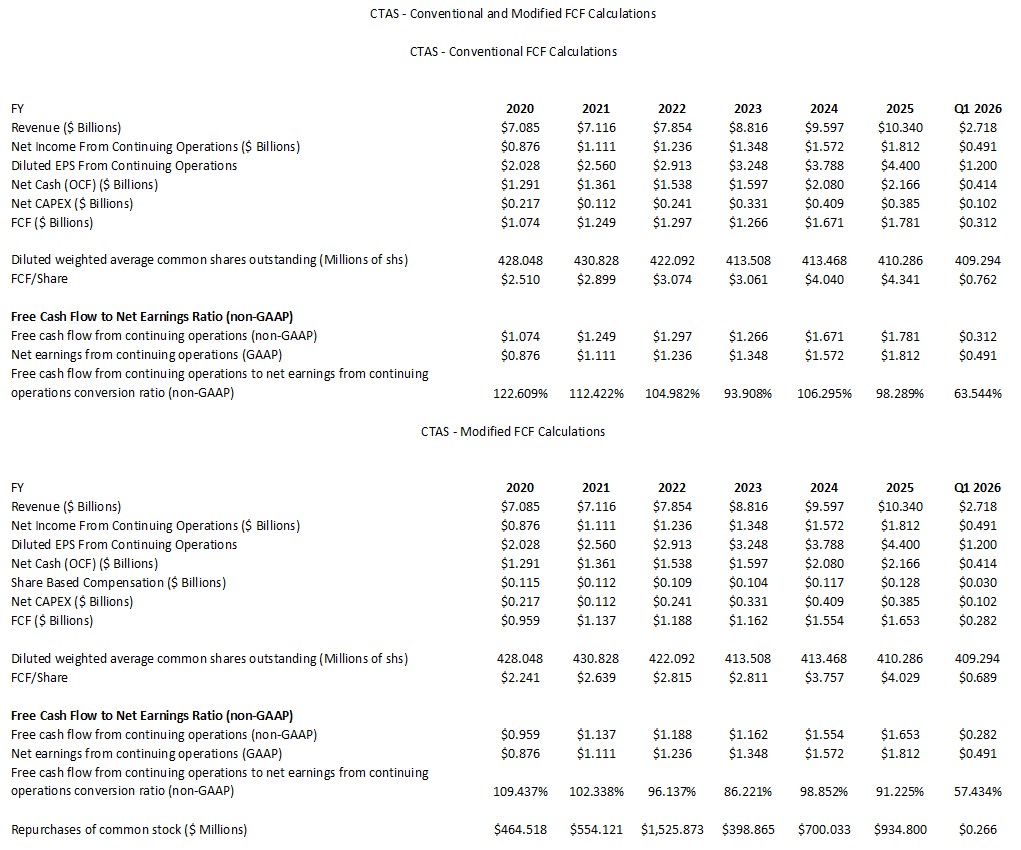
Conventional And Modified Free Cash Flow (FCF) Calculations (FY2020 – FY2025 and YTD2026)
FCF is a non-GAAP measure, and therefore, its method of calculation is open to debate. Most companies subtract capital expenditures (CAPEX) from Net Cash Provided by Operating Activities found in the Consolidated Statement of Cash Flows.
The ‘conventional’ calculations do not deduct share-based compensation (SBC) while the ‘modified’ calculations deduct SBC. In several posts, I touch upon why I deduct SBC when analyzing a company’s FCF.
You are cautioned not to draw a direct comparison between the Q1 2026 results and those for the prior fiscal years because the Q1 2026 data represents results solely for 1 quarter.
FY2026 Outlook
Current Outlook
- FY2025 and FY2026 have the same number of workdays for the year and by quarter;
- The exclusion of any future acquisitions;
- A constant foreign currency exchange rate;
- FY2026 net interest of ~$0.097B compared to $95.0 million in FY2025, primarily as a result of refinancing senior notes at a higher interest rate, partially offset by lower variable rate interest. Expected net interest may change as a result of future share buybacks or acquisition activity.
- A ~20% effective tax rate which is the same as FY2025.
Prior Outlook
- FY2025 and FY2026 have the same number of workdays for the year and by quarter;
- The exclusion of any future acquisitions;
- A constant foreign currency exchange rate;
- FY2026 net interest of ~$0.098B.
- A ~20% effective tax rate which is the same as FY2025.
Risk Assessment
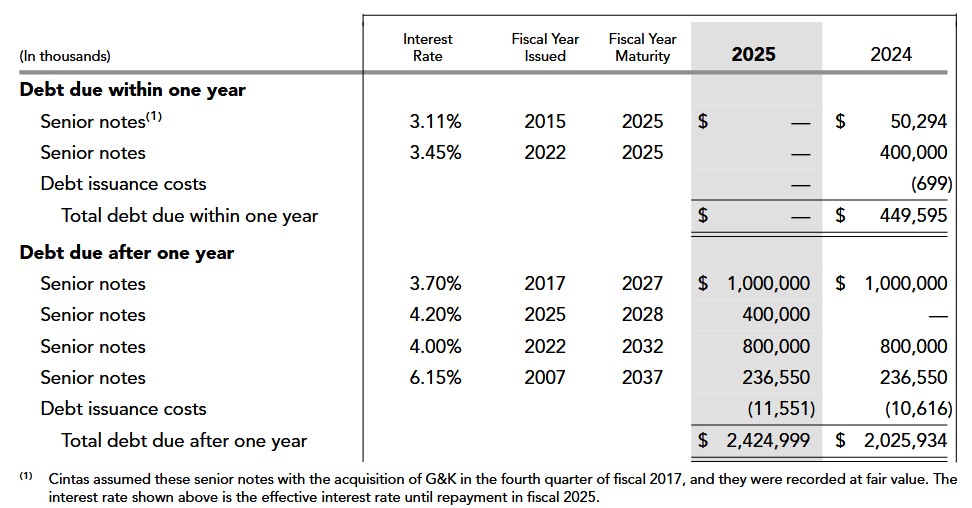
The following reflects CTAS’s outstanding debt at FYE2025. The amount owing at the end of Q1 2026 is $2,425,757 (relatively similar to FYE2025).
We see from the following schedule that no debt is due until FY2027.
CTAS’s credit agreement supports its commercial paper program; the revolving credit facility is in the amount of $2B. The credit agreement includes an accordion feature that provides the company with the ability to request increases to the borrowing commitments under the revolving credit facility of up to $0.5B in the aggregate, subject to customary conditions.
The maturity date of the revolving credit facility is March 23, 2027.
At the end of Q1 2026, there was no commercial paper outstanding and no borrowings on the revolving credit facility.
CTAS uses interest rate locks to manage its overall interest expense; interest rate locks effectively change the interest rate of specific debt issuances. These interest rate locks are entered into to protect against unfavorable movements in the benchmark treasury rate related to forecasted debt issuances. These interest rate locks represent cash flow hedges employed to hedge against movements in the treasury rates at the time the company issued its senior notes.
CTAS’s domestic senior unsecured long-term debt ratings are:
- Moody’s: A3 with a stable outlook (last reviewed on May 7, 2025)
- S&P Global: A- with a stable outlook (last reviewed on March 10, 2025)
Both ratings are the bottom tier of the upper medium-grade investment-grade category. These ratings define CTAS as having a strong capacity to meet its financial commitments. It is, however, somewhat more susceptible to the adverse effects of changes in circumstances and economic conditions than obligors in higher-rated categories.
Dividends and Share Repurchases
Dividend and Dividend Yield
CTAS’s dividend history is accessible here.
Little of CTAS’s total long-term shareholder return is likely to come from the quarterly dividend. I, therefore, recommend assigning little weight to the dividend aspect of this investment.
Stock Splits and Share Repurchases
CTAS’s stock split history is:
- September 11, 2024: 4:1
- November 18, 1997: 2:1
- April 2, 1992: 2:1
- April 2, 1991: 1.5:1
- April 2, 1987: 2:1
The table provided earlier in this post reflects the dollar value of shares repurchased and the diluted weighted average common shares outstanding in FY2020 – FY2025 and Q1 2026.
While CTAS’s FY2026 diluted EPS guidance excludes any future potential share buybacks, we see that the company remains active in opportunistically repurchasing its shares. In Q1 2026, CTAS repurchased just over $0.266B of its shares. On the September 24 earnings call, however, management states that CTAS has repurchased $0.3474B of its shares up to and including September 23.
Valuation
As I compose this post on September 24, CTAS’s shares price is ~$200.79. Using management’s current $4.74 – $4.86 adjusted diluted EPS outlook, the forward adjusted diluted PE is ~41.3 – ~42.4.
NOTE: CTAS’s diluted EPS and adjusted diluted EPS are likely to continue to be relatively similar.
Its valuation using the current broker guidance is:
- FY2026 – 20 brokers – mean of $4.85 and low/high of $4.76 – $4.92. Using the mean, the forward adjusted diluted PE is ~41.4.
- FY2027 – 19 brokers – mean of $5.35 and low/high of $5.13 – $5.51. Using the mean, the forward adjusted diluted PE is ~37.5.
- FY2028 – 10 brokers – mean of $5.89 and low/high of $5.51 – $6.19. Using the mean, the forward adjusted diluted PE is ~34.1.
Looking at the FCF/EPS metrics in prior years, I continue to estimate that the FY2026 FCF conversion ratio will be ~98% (calculated under the conventional method) and ~94% (calculated under the modified method). Using a $4.80 mid-point of management’s FY2026 guidance, CTAS’s FY2026 FCF is likely to be ~$4.70 (conventional) and ~$4.51 (modified). From these figures, we can estimate that CTAS’s P/FCF is ~42.7 and ~44.5 (calculated using the conventional and modified FCF values).
For comparison, the following is my valuation commentary from July 18, 2025 post.
CTAS generated $4.40 of diluted EPS in FY2025. Using the current $224.50 share price as I compose this post on July 18, CTAS’s P/E is ~51.
Its FY2025 FCF (conventional and modified) is ~$4.341 and ~$4.029. Using the $224.50 share price, the P/FCF (conventional and modified) is ~51.7 and ~55.7.
The current FY2026 adjusted diluted EPS outlook is $4.71 – $4.85 giving us a forward adjusted PE range of ~46.3 – ~47.7.
Its valuation using the current broker guidance and the current $224.50 share price is:
- FY2026 – 21 brokers – mean of $4.85 and low/high of $4.76 – $5.01. Using the mean, the forward adjusted diluted PE is ~46.3.
- FY2027 – 16 brokers – mean of $5.35 and low/high of $5.13 – $5.52. Using the mean, the forward adjusted diluted PE is ~42.
- FY2028 – 8 brokers – mean of $5.91 and low/high of $5.51 – $6.19. Using the mean, the forward adjusted diluted PE is ~38.
Looking at CTAS’s FY2020 – FY2025 FCF conversion ratio, I estimate that the FY2026 FCF conversion ratio will be ~98% and ~94%. On this basis, my FY2026 FCF/share estimate is ~$4.62 – ~$4.75 calculated under the conventional method. Under the modified method, this drops to ~$4.43 – ~$4.56. With shares currently trading at $224.50, the forward P/FCF is ~47.3 and ~48.6 using the FY2026 conventional FCF estimates and ~49.2 and ~50.7 using the FY2026 modified FCF estimates.
For comparison, the following is my valuation commentary from April 2, 2025 post.
When I last reviewed CTAS in my December 19, 2024 post, CTAS had reported $2.19 of diluted EPS in the first half of FY2025. Using the current ~$183 share price and a conservative FY2025 diluted EPS estimate of ~$4.25 – ~$4.30, the forward diluted PE was ~42.6 – ~43.06.
Management’s revised FY2025 diluted EPS guidance was $4.28 – $4.34 giving us a forward diluted PE of ~42.2 – ~42.8.
Its valuation using broker guidance was:
- FY2025 – 19 brokers – mean of $4.25 and low/high of $4.21 – $4.34. Using the mean, the forward adjusted diluted PE is ~43.06.
- FY2026 – 19 brokers – mean of $4.70 and low/high of $4.54 – $4.92. Using the mean, the forward adjusted diluted PE was ~39.
- FY2027 – 10 brokers – mean of $5.15 and low/high of $4.91 – $5.53. Using the mean, the forward adjusted diluted PE was ~35.5.
I also estimated FCF in the second half of FY2025 would be similar to that of the first half thus giving me a FCF/share of ~$3.44 and ~$3.12 using the conventional and modified methods of calculating FCF. With a ~$183 share price, the P/FCF was ~53.2 and 58.7.
When I last reviewed CTAS, the company had generated $3.31 of diluted EPS in the first 9 months of FY2025. I estimated its FY2025 diluted EPS would be ~$4.40 or the upper end of management’s $4.36 – $4.40 guidance. Using the ~$206.50 share price at the time I finalized my April 2, 2025 post, the forward diluted PE was ~47.
Its valuation using the current broker guidance was:
- FY2025 – 20 brokers – mean of $4.38 and low/high of $4.32 – $4.41. Using the mean, the forward adjusted diluted PE is ~47.1.
- FY2026 – 20 brokers – mean of $4.83 and low/high of $4.69 – $4.94. Using the mean, the forward adjusted diluted PE was ~42.8.
- FY2027 – 12 brokers – mean of $5.31 and low/high of $5.02 – $5.58. Using the mean, the forward adjusted diluted PE was ~38.9.
At the end of Q3, CTAS’s FCF was ~$3.069 and ~$2.831 using the conventional and modified methods of calculating FCF. I estimated that it would generate a comparable amount of FCF in Q4 as in each of the prior 3 quarters. In doing so, I estimated ~$4.09 and ~$3.77 of FCF calculated using the conventional and modified methods. Using the current ~$206.50 share price, the forward P/FCF was ~50.5 and ~54.8.
The following is my valuation commentary from December 19, 2024 post.
CTAS has generated $2.19 of diluted EPS in the first half of FY2025. If we use the current ~$183 share price and conservatively estimate FY2025 diluted EPS of ~$4.25 – ~$4.30, the forward diluted PE is ~42.6 – ~43.06.
Management’s revised FY2025 adjusted diluted EPS is $4.28 – $4.34 giving us a forward adjusted diluted PE of ~42.2 – ~42.8.
Its valuation using the current broker guidance (which will likely be amended slightly over the coming days) is:
- FY2025 – 19 brokers – mean of $4.25 and low/high of $4.21 – $4.34. Using the mean, the forward adjusted diluted PE is ~43.06.
- FY2026 – 19 brokers – mean of $4.70 and low/high of $4.54 – $4.92. Using the mean, the forward adjusted diluted PE was ~39.
- FY2027 – 10 brokers – mean of $5.15 and low/high of $4.91 – $5.53. Using the mean, the forward adjusted diluted PE was ~35.5.
If the second half of the FY2025 FCF is similar to that of the first half, we can reasonably expect CTAS’s FCF/share to be ~$3.44 and ~$3.12 calculated using the conventional and modified methods. With a ~$183 share price, the P/FCF is ~53.2 and 58.7.
NOTE: I acquired additional shares on December 31, 2024 at a relatively similar price to those purchased on December 19, 2024.
Final Thoughts
I previously held 500 shares in a ‘Side’ account in the FFJ Portfolio at an average cost of ~$184.56. On September 24, however, I acquired an additional 100 shares @ $200.79 bringing my total exposure to 600 shares. Despite this additional purchase, CTAS is still not a top 30 holding.
My September 24 purchase price is higher than the average cost of my previous 500 shares. CTAS’s valuation, however, is slightly superior to that at the time of my prior purchases and reviews.
In my most recent prior review, I noted that CTAS generated ~$4.8B and ~$10.34B of revenue in FY2016 and FY2025, respectively. The current FY2026 revenue outlook is $11.06B – $11.18B which is an increase from the management’s prior $11B – $11.15B guidance. Looking at the top line growth over several years, it seems reasonable that CTAS will generate ~$14B of revenue by FY2035. If it can continue to generate ~15% – ~17% Net Income From Continuing Operations as a percentage of Revenue (16.4% and 17.5% in FY2024 and FY2025), it could generate ~$2.1B – ~$2.38B in FY2035.
Naturally, trying to extrapolate data a decade into the future is fraught with risk. I would not, therefore, rely heavily on my FY2035 assumptions.
Looking at the variance in brokers’ earnings estimates, I place virtually no reliance on broker earnings estimates beyond the current fiscal year.
Since earnings can be manipulated, my preference is to gauge a company’s valuation using FCF. Since FCF is a non-GAAP metric, the manner in which it is calculated is inconsistent. If I consistently calculate FCF in the same manner, however, I can compare CTAS’s valuation over several years.
In my prior post I wrote:
I am prepared to acquire additional CTAS shares under ~$210. At ~$210 and using the approximate mid-points of my FY2026 FCF range assumptions (~$4.70 under the conventional method and ~$4.50 under the modified method) the P/FCF would be ~44.7 and ~46.7. This valuation is still ‘rich’ but sometimes we have to ‘pay up’ if we want to invest in high quality companies that have a dominant position in their industry.
CTAS’s share price is currently less than ~$210 AND management’s FY2026 guidance has been raised. While current guidance excludes any additional share repurchases, the company is actively repurchasing shares after Q1 2026. It also has no debt maturing until FY2027 so with an exemplary track record of allocating capital, we should expect the company’s strong free cash flow to be appropriately allocated so as to increase shareholder value.
I wish you much success on your journey to financial freedom!
Note: Please send any feedback, corrections, or questions to finfreejourney@gmail.com.
Disclosure: I am long CTAS.
Disclaimer: I do not know your circumstances and do not provide individualized advice or recommendations. I encourage you to make investment decisions by conducting your research and due diligence. Consult your financial advisor about your specific situation.
I wrote this article myself and it expresses my own opinions. I do not receive compensation for it and have no business relationship with any company mentioned in this article.