With the recent release of FTV’s Q2 and YTD2024 results and FY2024 outlook, I am taking this opportunity to determine if I should increase my Fortive (FTV) exposure.
I last reviewed FTV, a Danaher (DHR) spin-off, in this February 1, 2024 post at which time it had just released its Q4 and FY2023 results and FY2024 outlook. At the time of that review, FTV’s share price was ~$78. Using company and broker guidance, I concluded the share price would need to retrace to at least ~$71 before I would consider adding to my exposure.
Business Overview
FTV operates and reports its results in three segments:
- Intelligent Operating Systems (IOS);
- Precision Technologies (PT); and
- Advanced Healthcare Solutions (AHS).
Using the company directory, you can view each company within each segment to learn about its respective capabilities.
Should you be unfamiliar with FTV, I encourage you to read Management’s Discussion and Analysis of Financial Condition and Results of Operations that commences on page 27 of 73 in FTV’s Q2 Form 10-Q that is accessible through the SEC Filings section of the company’s website.
Financials
Q2 and YTD2024 Results
FTV’s Q2 and YTD2024 earnings material is accessible here.
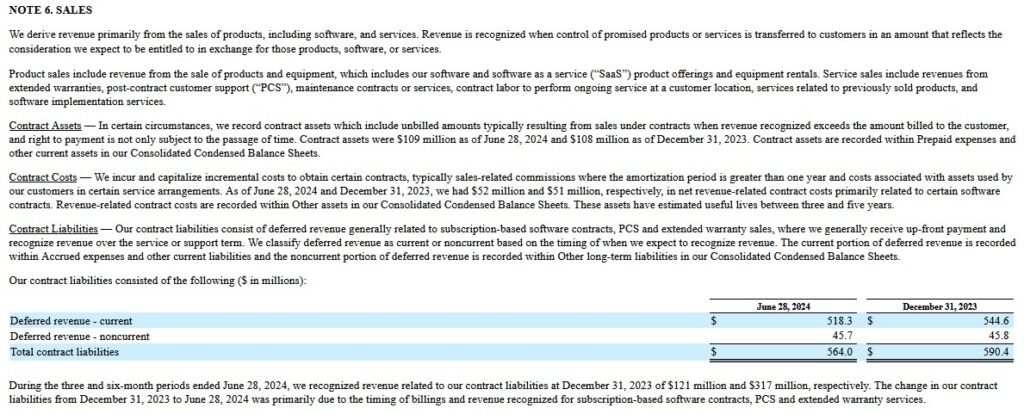
It is important to note that at the end of Q2 2024, FTV’s liabilities included ~$0.564B of deferred revenue. This represents funds FTV has received prior to it rendering services. I include the following from the Form 10-Q that provides an explanation of FTV’s contracts assets, contract costs, and contract liabilities.
While relatively immaterial, I note that FTV incurred a non-recurring $25.6 million loss from the June 2024 divestiture of Invetech, excluding the Motion Solution Business.
Operating Cash Flow (OCF), CAPEX, and Free Cash Flow (FCF)
In the FY2014 – FY2023 time frame, FTV’s:
- OCF was (in B$) 0.95, 1.01, 1.14, 1.18, 1.34, 1.27, 1.44, 0.96, 1.30, and 1.35.
- CAPEX was (in B$) 0.10, 0.12, 0.13, 0.14, 0.11, 0.11, 0.08, 0.05, 0.10, and 0.11.
- FCF was (in B$) 0.96, 0.97, 0.97, 1.11, 1.12, 1.06, 0.70, 1.05, 1.23, and 1.33.
The Q2 2024 Consolidated Statement of Cash Flows reflects YTD ~$0.566B of OCF, ~$0.056B of CAPEX thus giving us ~$0.510B of FCF.
I look closely at a company’s FCF and trend because it provides useful information in assessing a company’s ability to:
- generate cash without external financing;
- fund acquisitions and other investments; and
- in the absence of refinancing, repay debt obligations.
FCF, however, is not without its drawbacks. As a liquidity measure, it has material limitations because it excludes certain expenditures that are required or to which a company is committed, such as debt service requirements and other non-discretionary expenditures. This is why I look at the credit rating and outlook assigned by major rating agencies.
The following reflects FTV’s FCF conversion ratio in Q2 and YTD2024.
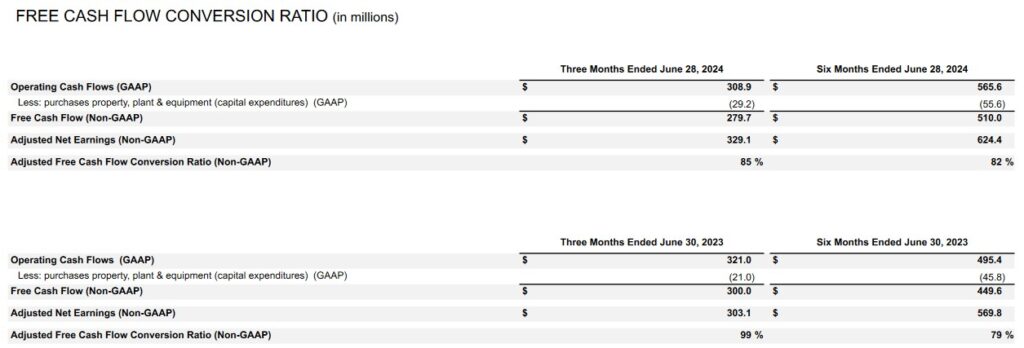
In FY2023, management expected a FCF conversion ratio of ~105% but this metric came up short at 102%.

FTV’s FY2024 FCF outlook is for ~$1.365B yet it has only generated ~$0.51B of YTD FCF. Looking at FTV’s quarterly FCF generated over the past couple of years, it is not beyond the realm of possibility that FTV’s FCF conversion ratio will be similar or greater than the 102% it reported for FY2023.
Return On Invested Capital (ROIC)
FTV’s ROIC (%) in FY2014 – FY2023 is 17.07, 15.48, 12.45, 16.04, 31.42, 5.59, 12.35, 4.94, 6.28, and 7.15.
High quality companies often generate a high ROIC. If a company generates a high ROIC, it needs to invest less to achieve a certain growth rate thus reducing the need for external capital.
A company that generates $0.15/profit for every $1 invested, for example, achieves a ROIC of 15%. I consider a ~15%+ ROIC to be a reasonable minimum threshold because most of the time, a company’s cost of capital will be lower than this level. FTV’s ROIC has fallen short of this level several times in recent years.
When a company consistently generates a high ROIC over the long term and it is growing its revenue, it can reinvest a portion of its profits under favorable conditions thereby leading to a compounding effect. I would much rather invest in a growing company that can reinvest to create greater shareholder value than to invest in a company that has limited growth opportunities and thus chooses to distribute a growing dividend.
FY2024 Outlook
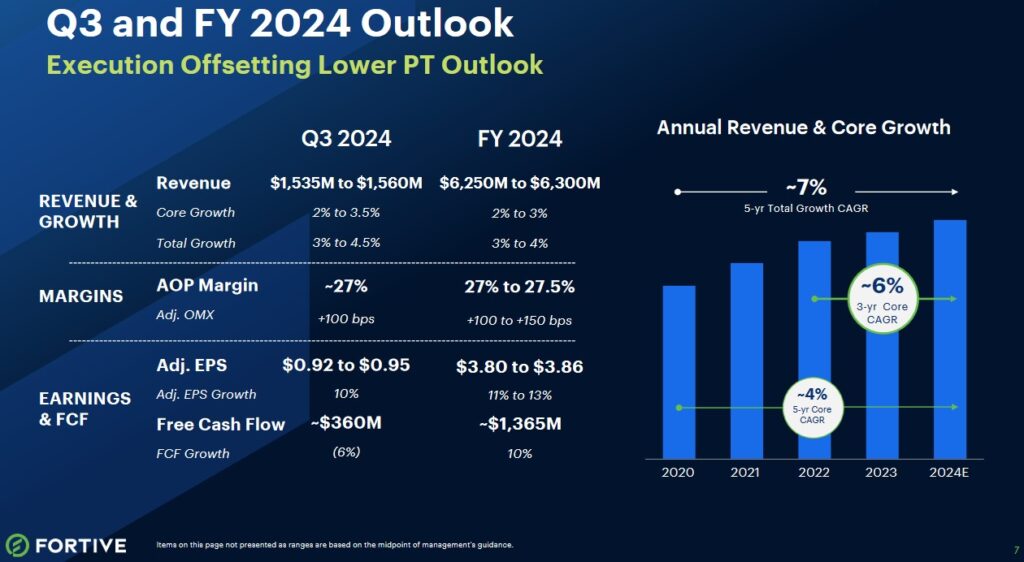
The following is FTV’s Q3 and FY2024 outlook.
The following reflects FTV’s FY2024 outlook when it released its FY2023 results.

While the most recent sales outlook is lower, the margins, earnings, and FCF have been revised higher.
Credit Ratings
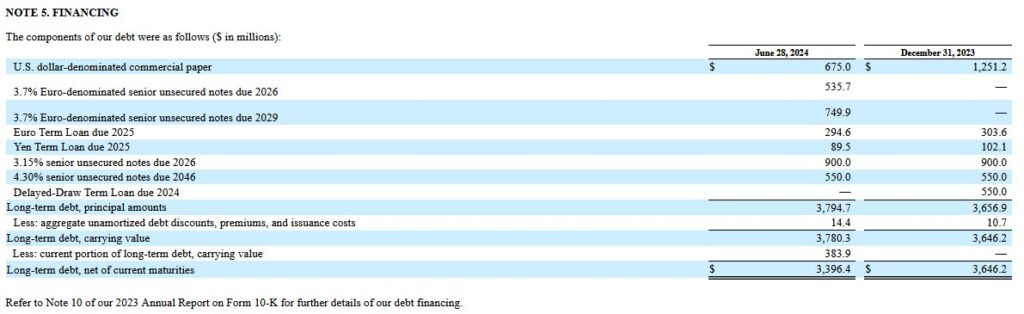
The following reflects FTV’s long-term debt at the end of Q2 2024 and FYE2023.
FTV’s senior unsecured long-term debt credit ratings and outlook are the same as at the time of my prior review.
- Moody’s: Baa1 and stable
- S&P: BBB and stable
Moody’s rating is the top tier of the lower medium investment-grade category. S&P’s rating is 1 notch lower and is the middle tier of the lower medium investment-grade category.
These ratings define FTV as having an ADEQUATE capacity to meet its financial commitments. However, adverse economic conditions or changing circumstances are more likely to lead to a weakened capacity to meet financial commitments.
Both ratings are satisfactory for my conservative nature.
Dividend and Dividend Yield
One look at FTV’s dividend history and investors fixated on dividend metrics will likely rule out FTV as a potential investment.
With shares currently trading at ~$71, the $0.08 quarterly dividend yields well below 1%.
From a capital allocation perspective, dividend increases are a low priority. Much like DHR, FTV focuses on retaining funds in the company to fuel its growth.
The diluted weighted average shares outstanding (in millions) in FY2016 – FY2023 are 347, 353, 351, 340, 359, 352, and 361. This has been reduced to ~354.8 in the quarter ending on June 28, 2024.
On February 17, 2022, FTV announced that its Board authorized a share repurchase program under which up to 20 million shares can be purchased from time to time on the open market or in privately negotiated transactions. There is no expiration date for the repurchase program, and the timing and amount of repurchases under the program are determined by FTV’s management based on market conditions and other factors.
As of FYE2023, there were 9 million shares remaining for repurchase under the program. On January 23, 2024, FTV’s Board increased the number of shares authorized under the share repurchase program by an additional 11 million shares.
During both the 3 and 6-month periods ended June 28, 2024 and June 30, 2023, FTV purchased 2 million shares of its common stock at an average share price of $76.43 and $64.54, respectively.
Looking at the Consolidated Statement of Cash Flows, FTV repurchased $152.9 million and $129.1 million during 6-month periods ended June 28, 2024 and June 30, 2023. Its stock based compensation expense during the same periods was $53.1 million and $55.7 million.
As of June 28, 2024, there were 18 million shares remaining for repurchase under the program.
Valuation
When I analyzed FTV’s valuation in October 2023, management’s FY2023 diluted EPS and adjusted diluted EPS guidance had been revised to $2.30 – $2.33 and $3.37 – $3.40, respectively. With shares trading at ~$65, the forward diluted PE range was ~27.9 – ~28.3 and the forward adjusted diluted PE range was ~19.1 – ~19.3.
Using the current ~$65 price and adjusted diluted EPS broker guidance, the following were the adjusted forward diluted PE levels:
- FY2023 – 18 brokers – ~19.1 based on a mean of $3.40 and low/high of $3.37 – $3.46.
- FY2024 – 18 brokers – ~17.7 based on a mean of $3.67 and low/high of $3.52 – $3.80.
- FY2025 – 11 brokers – ~15.9 based on a mean of $4.07 and low/high of $3.85 – $4.30.
Management continued to expect an FY2023 adjusted FCF conversion rate of ~105% of adjusted diluted EPS. Using management’s adjusted diluted EPS guidance of $3.37 – $3.40 ($3.39 mid-point), I estimated FTV’s FY2023 FCF/share would be ~$3.56 (105% of $3.39). This resulted in a Price/adjusted FCF ratio is ~18.3 ($65/$3.56).
When FTV reported its FY2023 results, it reflected diluted net EPS for FY2023 of $2.43 and adjusted diluted net EPS of $3.43. With shares trading at ~$78, FTV’s diluted PE was ~32 and the adjusted diluted PE was ~23.
The adjusted FCF conversation ratio for FY2023 was ~102% and not ~105% as management expected. Multiplying the $3.43 of adjusted diluted net EPS by 102% and we arrived at ~$3.50 of FCF/share. By dividing the ~$78 share price by ~$3.50, the P/FCF was ~22.3.
The FY2024 diluted EPS and adjusted diluted EPS forecast was $2.58 – $2.70 and $3.73 – $3.85, respectively. Using the current ~$78 share price, the forward diluted PE was ~29 – ~30 and the forward adjusted diluted PE was ~20 – ~21.
Using the ~$78 price and adjusted diluted EPS broker guidance, the following were the adjusted forward diluted PE levels:
- FY2024 – 19 brokers – ~21 based on a mean of $3.74 and low/high of $3.57 – $3.82.
- FY2025 – 12 brokers – ~19 based on a mean of $4.11 and low/high of $4.00 – $4.20.
- FY2026 – 4 brokers – ~17 based on a mean of $4.57 and low/high of $4.39 – $4.73.
I anticipated these estimates would be adjusted very slightly over the next several days as more brokers updated their guidance.
Using management’s FY2024 adjusted diluted EPS forecast and assuming FTV replicated its ~102% adjusted FCF conversation ratio for FY2024, my FCF estimate was ~$3.80 – $3.93. Using this estimated range and the current ~$78 share price, the forward adjusted diluted P/FCF was ~20 – ~20.5.
In the first half of FY2024, FTV has generated $1.13 of diluted EPS and $1.76 of adjusted diluted EPS. The current FY2024 forecast is for $3.80 – $3.86 of adjusted diluted EPS. With shares trading at ~$71, the forward adjusted diluted PE is ~18.4 – ~18.7.
The adjusted forward diluted PE levels using the ~$71 price and adjusted diluted EPS broker guidance is:
- FY2024 – 18 brokers – ~18.6 based on a mean of $3.81 and low/high of $3.75 – $3.84.
- FY2025 – 19 brokers – ~17.1 based on a mean of $4.15 and low/high of $4.00 – $4.30.
- FY2026 – 5 brokers – ~15.5 based on a mean of $4.59 and low/high of $4.34 – $4.80.
FTV’s FY2024 FCF forecast is ~$1.365B. If the weighted average diluted shares outstanding for FY2024 is 354 million shares, we get a FCF/share value of ~$3.86. Divide $71 by ~$3.86 and the forward P/FCF is ~18.4.
Final Thoughts
At no time when I have completed a FFJ Portfolio Review (the 2024 Mid Year FFJ Portfolio Review being the most recent) has FTV been a top 30 holding; I only hold 300 shares in a ‘Core’ account within the FFJ Portfolio.
I am not increasing my Fortive exposure despite an attractive valuation. The plan is to increase exposure to other holdings likely to generate long-term total investment returns superior to that of FTV.
I wish you much success on your journey to financial freedom!
Note: Please send any feedback, corrections, or questions to finfreejourney@gmail.com.
Disclosure: I am long FTV and DHR.
Disclaimer: I do not know your circumstances and do not provide individualized advice or recommendations. I encourage you to make investment decisions by conducting your research and due diligence. Consult your financial advisor about your specific situation.