In my last Home Depot (HD) review on August 15, 2024, I state that shares are perennially overvalued. The decision to invest in HD typically comes down to how much are you willing to ‘overpay’. At the time of that review, the most current financial information was for Q2 and YTD2024. With the release of Q2 and YTD2025 results, I revisit this existing holding.
NOTE: The company’s fiscal year end is either the end of January or the beginning of February meaning HD is currently in FY2026. HD’s Form 10-K issued in early 2025, however, reflects results as being for ‘Fiscal 2024’. Furthermore, HD’s recent quarterly results reflect FY2025 guidance.
Business Overview
A good overview of the company and Risk Factors is found in Part 1, Items 1 and 1A in the FY2024 Form 10-K.
The retail home improvement industry is cyclical and highly competitive. HD, however, is by far the industry leader with Lowe’s (LOW) being a distant second.
In FY2024, for example, HD’s revenue and net cash provided by operating activities were ~$159.5B and ~$19.8B, respectively. In comparison, LOW’s numbers were ~$83.7B and ~$9.625B.
This highly fragmented industry has experienced consolidation in recent years. Some industry participants have declared bankruptcy with a dissolution (eg. LL Flooring formerly Lumber Liquidators) or have declared bankruptcy with a sale of the remaining business operations (eg. TrueValue declares bankruptcy in October 2024 with business operations sold to Do It Best in November 2024).
In other instances, private equity has stepped into the picture. On November 10, 2021, for example, an affiliate of Charlesbank Capital Partners, a private investment firm based in Boston and New York, acquired Empire Today. Empire Today is the largest direct-to-consumer flooring company in the United States.
HD has also contributed to the industry consolidation with the acquisition of SRS Distribution Inc. (SRS) which I touched upon in my August 15, 2024 post. This ~$18.25B acquisition was announced on March 28, 2024 and the acquisition was completed on June 18, 2024.
GMS Inc. Acquisition (Gypsum Management and Supply)
Most recently, HD announced that it had entered into a definitive agreement for its specialty trade distribution subsidiary, SRS to acquire GMS Inc. (GMS – Gypsum Management and Supply), a leading North American specialty building products distributor (eg. drywall, ceilings, steel framing, and insulation) related to remodeling and construction projects. Details of the transaction (including the transaction terms) are in this June 30, 2025 News Release.
This strategic acquisition will enhance HD’s contractor-focused offerings and allow it to capture more business from professional contractors which is a key customer segment. It will add a highly complementary adjacent vertical to SRS’s business with differentiated capabilities, product categories and customer relationships. It will also broaden SRS’s distribution footprint across the U.S. and Canada. With the addition of GMS, SRS will have a network of more than 1,200 locations, a sales operation of over 3,500 associates, and a fleet of nearly 8,000 trucks capable of making tens of thousands daily job site deliveries.
The total equity value of ~$4.3B implies a total enterprise value (including net debt) of ~$5.5B.
Financing of this transaction is to be through cash on hand and debt. HD, however, continues to plan a return to a 2.0x leverage ratio by the end of FY2026.
Lowe’s (LOW) Announces Intent to Acquire Foundation Building Materials
Not to be outdone, on August 20, 2025, LOW announced the $8.8B acquisition of Foundation Building Materials (FBM) which reflects a multiple of 13.4x Adj. EBITDA.
FBM supplies the construction industry with 370+ locations across the US and Canada.
Since 2011, FBM has grown by both organic expansion and strategic transactions.
In 2021, FBM was acquired by American Securities LLC. In January 2024, Clayton, Dubilier & Rice and American Securities LLC announced that funds managed by CD&R acquired a significant ownership position in FBM from affiliates of American Securities.
Under the ownership of both companies, FBM has experienced 27% per annum revenue growth and 31% per annum EBITDA growth. FBM’s strategic acquisitions include Beacon Roofing Supply’s interior products business, Marjam Supply Company, Unified Door & Hardware, and REW Materials. These acquisitions have improved the Company’s competitiveness, broadened its product and service portfolio, and expanded its scope across key regions in North America.
Various initiatives, including launching a new e-commerce platform and digital application and investing to expand its commercial capabilities has strengthened FBM’s market presence.
The transaction is subject to customary closing conditions, including regulatory approvals, and is expected to close in Q4 2025. The purchase is to be financed with combination of short-term and long-term debt. At the time of closing, LOW’s expected leverage (Lease Adjusted Debt to EBITDAR) is expected to be 3.4x – 3.5x. LOW will pause share repurchases until its leverage reaches 2.75x. Management expects to achieve this leverage ratio by the end of Q2 2027.
NOTE: EBITDAR is a financial metric that stands for Earnings Before Interest, Taxes, Depreciation, Amortization, and Restructuring or Rent. It is a non-GAAP (Generally Accepted Accounting Principles) measure used to evaluate a company’s operating performance, particularly when comparing businesses with different lease structures or those undergoing restructuring. It is a way to calculate a company’s profitability by adding back certain expenses (interest, taxes, depreciation, amortization, and rent or restructuring costs) to its net income.
Financials
Q2 and YTD2025 Results
Earnings-related material is accessible here.
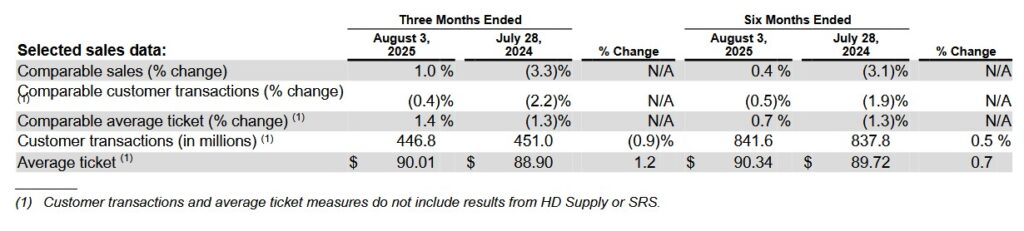
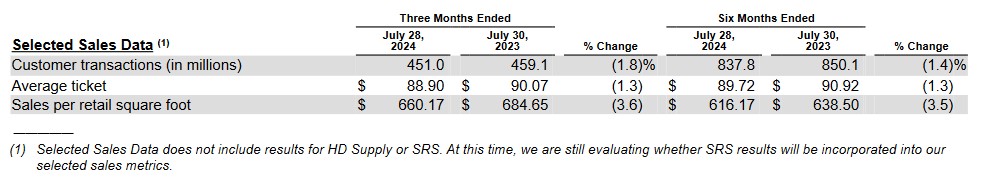
The following data reflects challenging business conditions. Various key metrics reflect a decline or no meaningful change when we compare the first 6 months of FY2024 and FY2025.
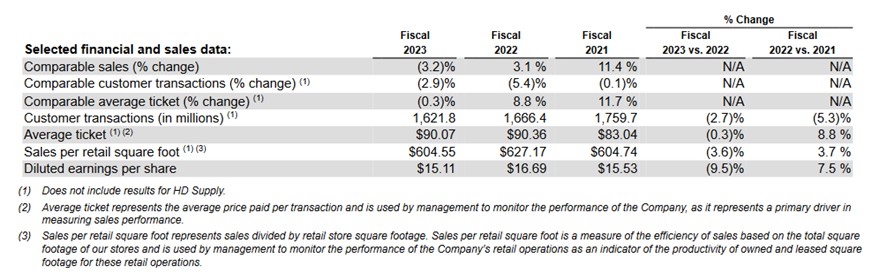
I included the following in my August 15, 2024 post and include it again so we get a better idea of HD’s performance over a longer period.
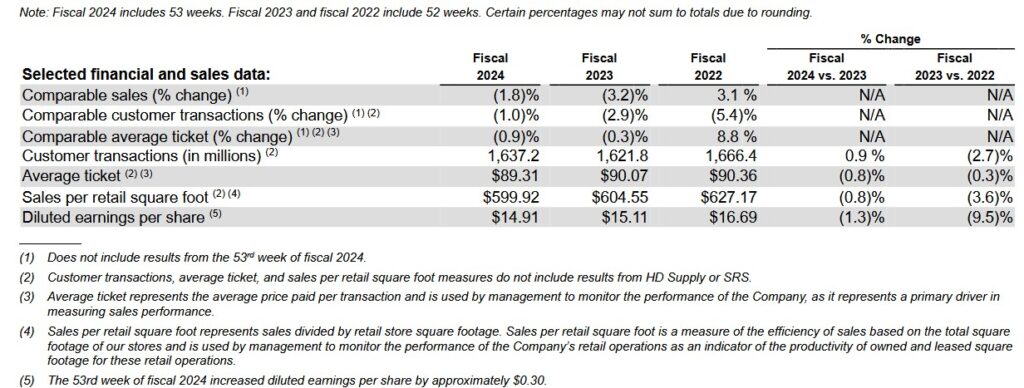
Looking at FY2024 sales per retail square foot we see $599.92. In FY2021 – FY2023, these results were in excess of $600.
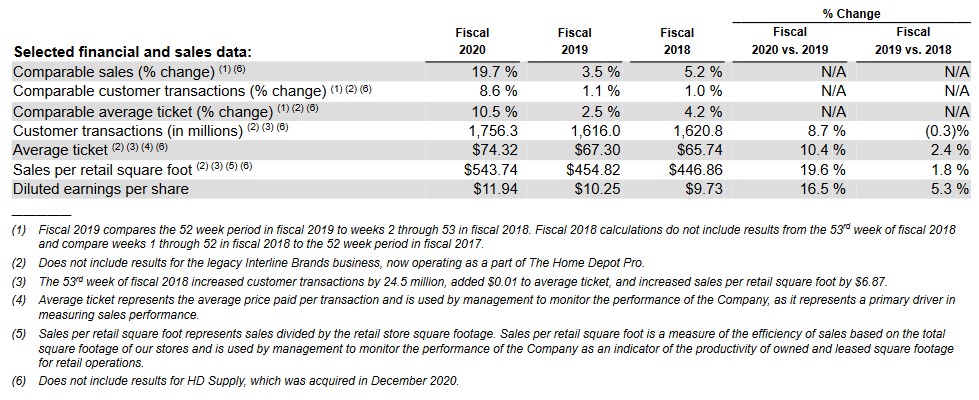
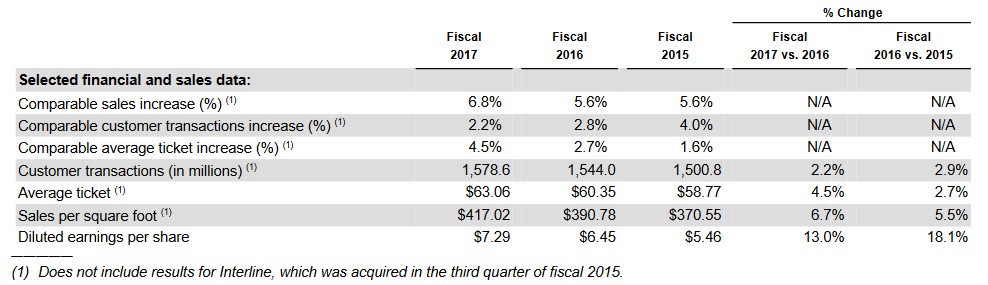
Over a longer time frame, we see that key metrics reflect a marked improvement; compare HD’s FY2015 results versus FY2024 and YTD2025 results.
On the Q2 2025 earnings call, management states:
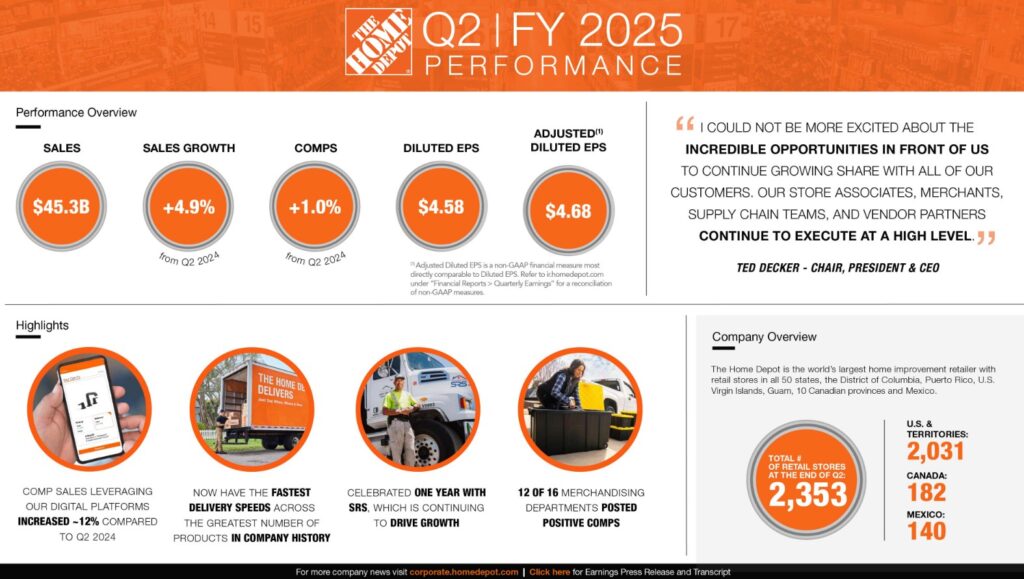
Turning to our merchandising department comp performance for the second quarter, 12 of our 16 merchandising departments posted positive comps, including storage, bath, hardware, building materials, indoor garden, electrical, kitchen, outdoor garden, millwork, power, plumbing and appliances.
During the second quarter, our comp average ticket increased 1.4%, and comp transactions decreased 0.4%. The growth in our comp average ticket primarily reflects a greater mix of higher ticket items, inflation from core commodity categories, including lumber and copper, and a modest decrease in promotional activity relative to prior years.
Big ticket comp transactions, or those over $1,000, were positive 2.6% compared to the second quarter of last year. We were pleased with the performance we saw in categories such as building materials, lumber and hardware.
However, we continue to see softer engagement in larger discretionary projects where customers typically use financing to fund the renovation project.
In Q2 2025, HD opened three new stores, bringing the total store count to 2,353.
At the end of the quarter, merchandise inventories were $24.8B, up ~$1.8B compared to Q2 2024 and inventory turns were 4.6x, down from 4.9x in Q2 2024.
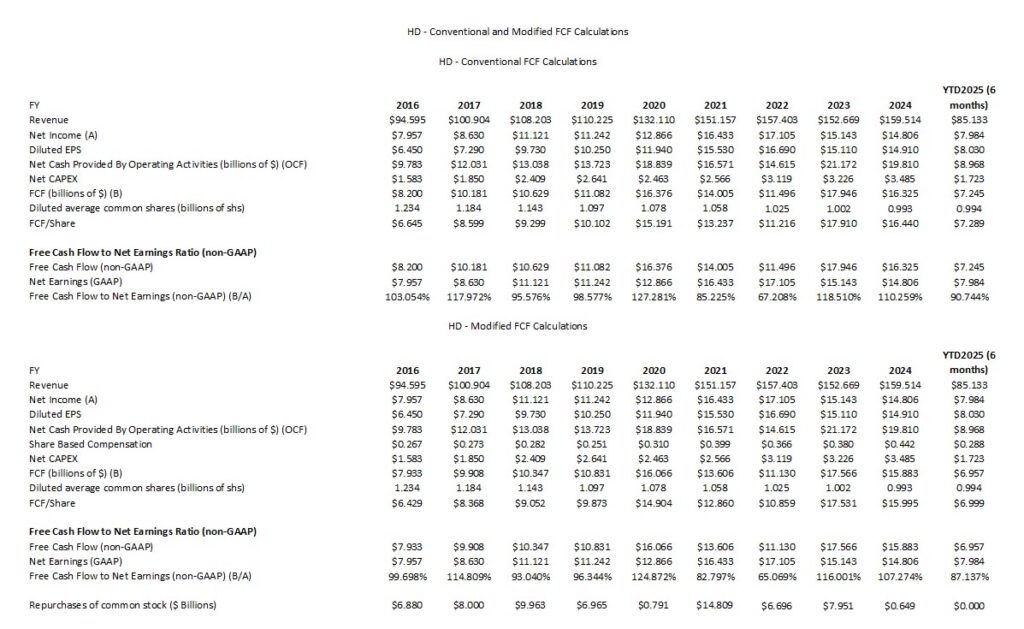
Operating Cash Flow (OCF), Free Cash Flow (FCF), and CAPEX
HD is the industry leader in the highly competitive and cyclical retail home improvement industry.
HD is highly focused on its capital allocation and while the FCF/Net Earnings ratio in FY2021 and FY2022 was well below levels in other years, we need to appreciate the impact of the COVID pandemic on the entire construction industry.
HD’s share based compensation (SBC) in FY2025 will likely be slightly more than double that in FY2016. HD’s earnings and FCF, however, are considerably higher than in FY2016. While FY2025 SBC will likely be ~$0.58B we need to put this in perspective – HD’s FY2025 revenue will likely be ~$172B.
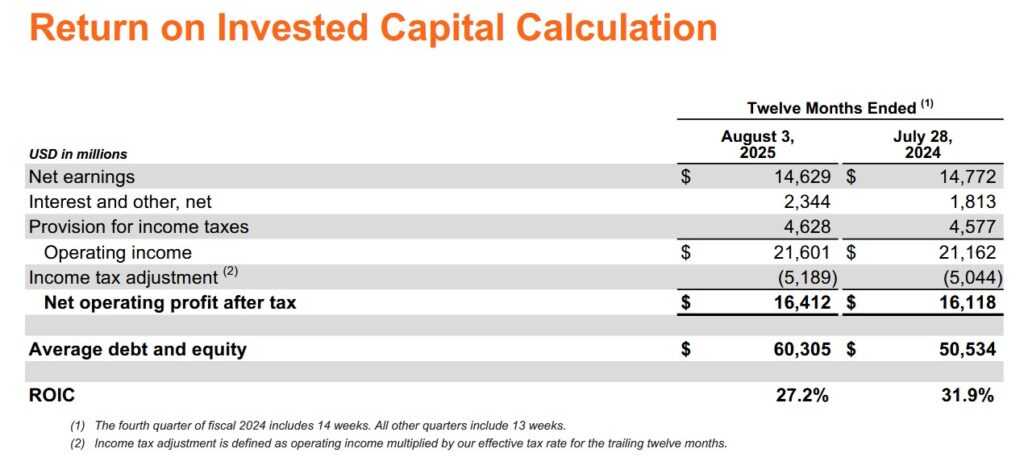
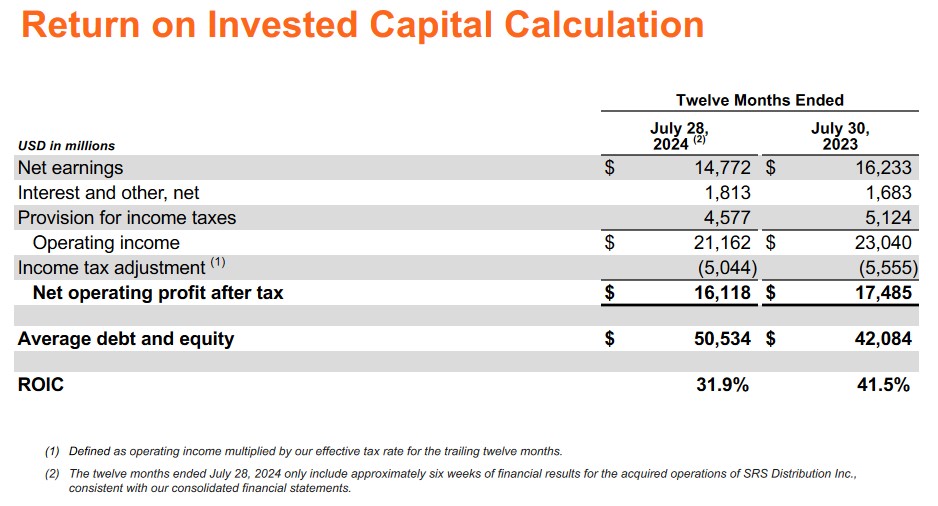
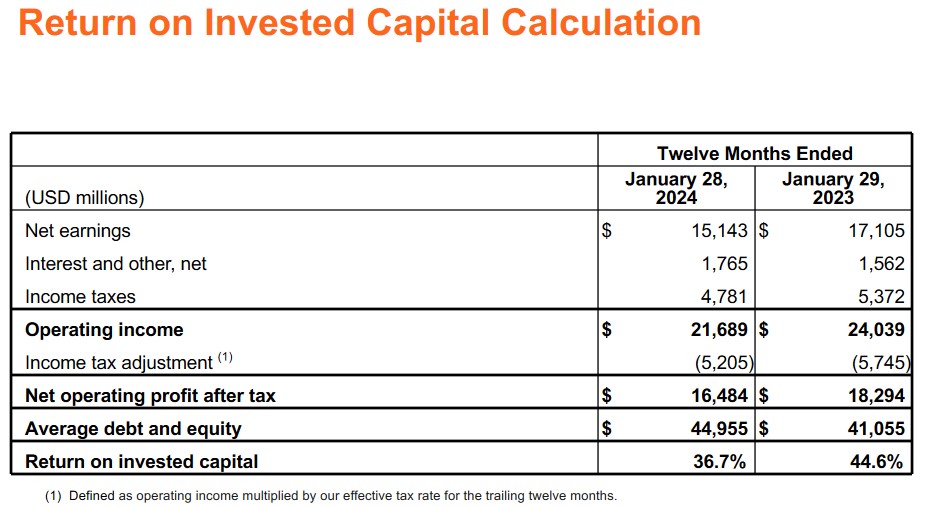
Return On Invested Capital (ROIC)
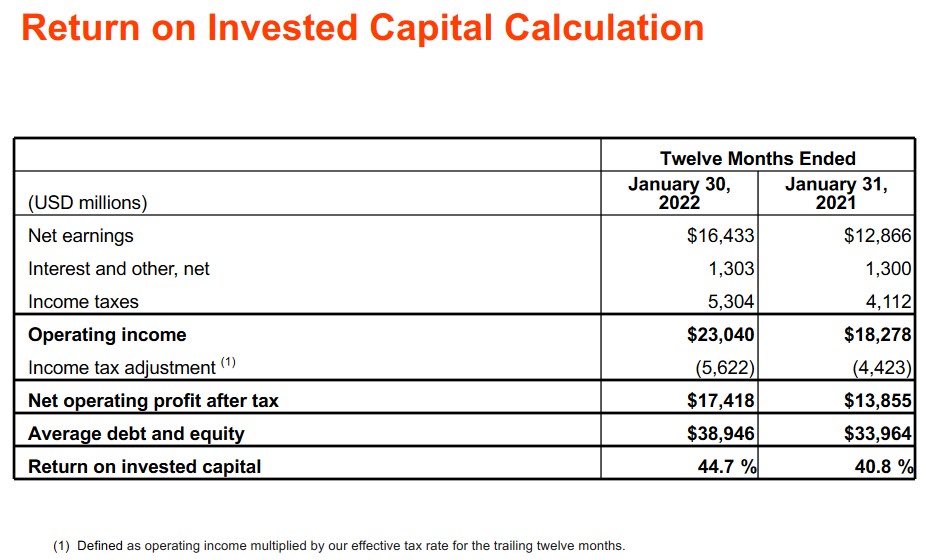
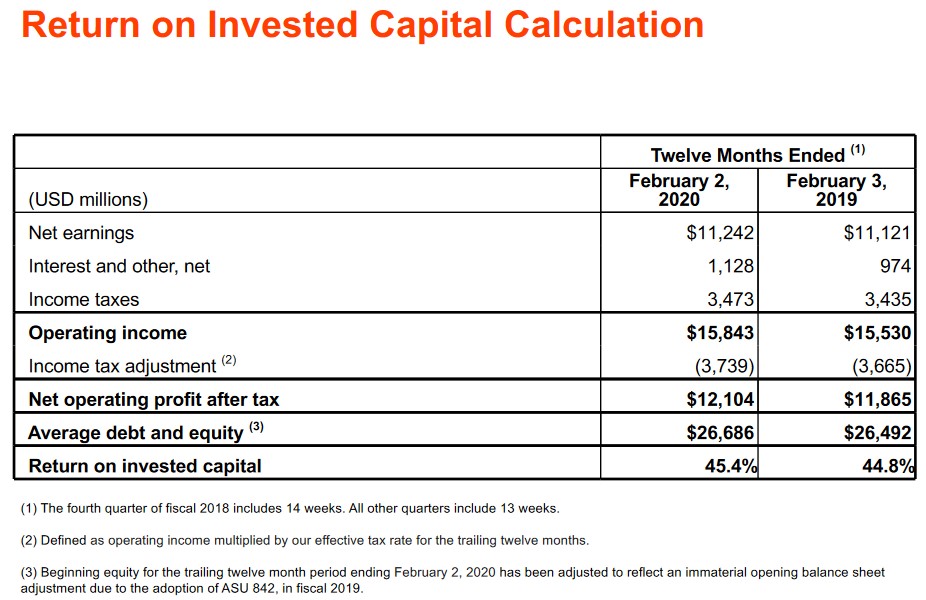
High quality companies often generate a high ROIC. If a company generates a high ROIC, it needs to invest less to achieve a certain growth rate thus reducing the need for external capital.
When a company consistently generates a high ROIC over the long term and it is growing its revenue, it can reinvest a portion of its profits under favorable conditions thereby leading to a compounding effect. I would much rather invest in a growing company that can reinvest to create greater shareholder value than to invest in a company that has limited growth opportunities and thus chooses to distribute a growing dividend.
A company that generates $0.15/profit for every $1 invested, for example, achieves a ROIC of 15%. I consider a ~15%+ ROIC to be a reasonable minimum threshold because most of the time, a company’s cost of capital will be lower than this level. HD’s ROIC in recent years consistently exceeds this level but has fallen from the mid 40% range to the high 20% range.
The trend is not encouraging but this is not the only consideration when investing in a company. We must also consider that HD operates in a very cyclical industry and that the world is experiencing a highly disruptive period. As investors, we should not be focusing on what is likely to happen within the next couple of years but rather the likely performance over the very long-term. I anticipate that HD’s ROIC will be restored to the 30s within the next few years.
Capital Allocation
HD’s capital allocation principles are:
- reinvest in the business to drive growth faster than the market;
- pay a quarterly dividend after meeting the needs of the business; and
- return excess cash to shareholders through share repurchases after reinvesting in the business and paying a dividend.
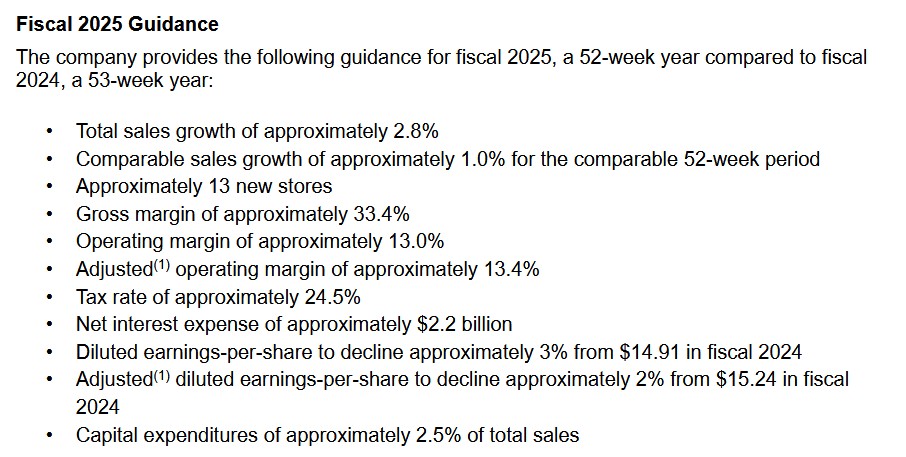
Investors can now expect CAPEX of ~2.5% of FY2025 sales.
In Q2 2025, HD reinvested ~$0.915B in the form of capital expenditures and it distributed ~$2.3B in dividends.
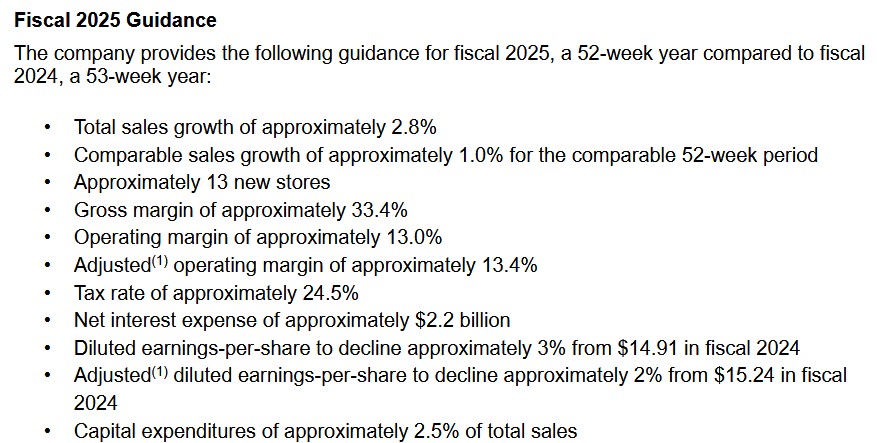
FY2025 Guidance
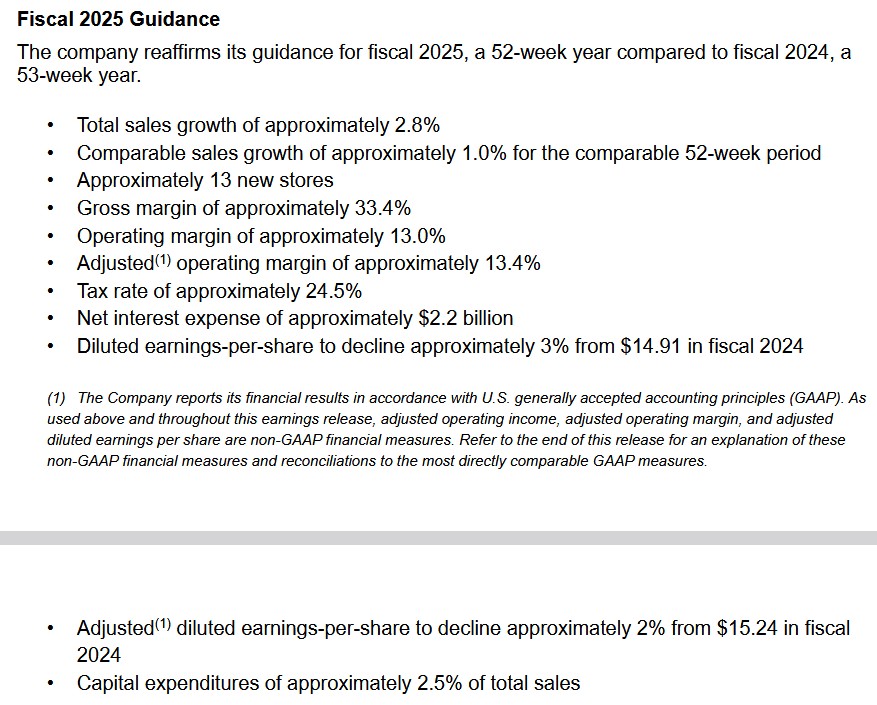
There is no change to HD’s FY2025 guidance. This is HD’s current guidance.
The following is HD’s guidance at the time of its release of Q1 2025 results.
The following is HD’s guidance at the time of its release of Q4 2024 results.
Risk Assessment
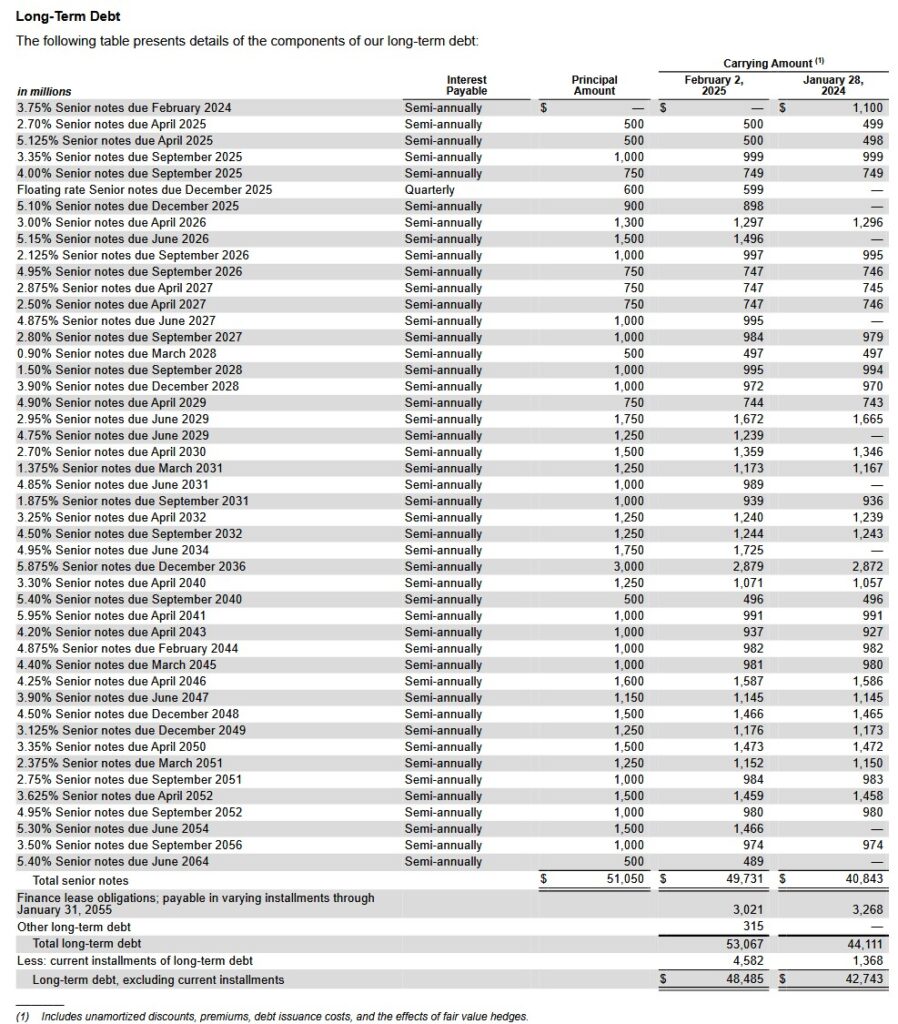
The currently available Q2 2025 information does not include a schedule of HD’s long-term debt. The total debt of ~$52.3B, however, is relatively similar to ~$53.07B at FYE2024.
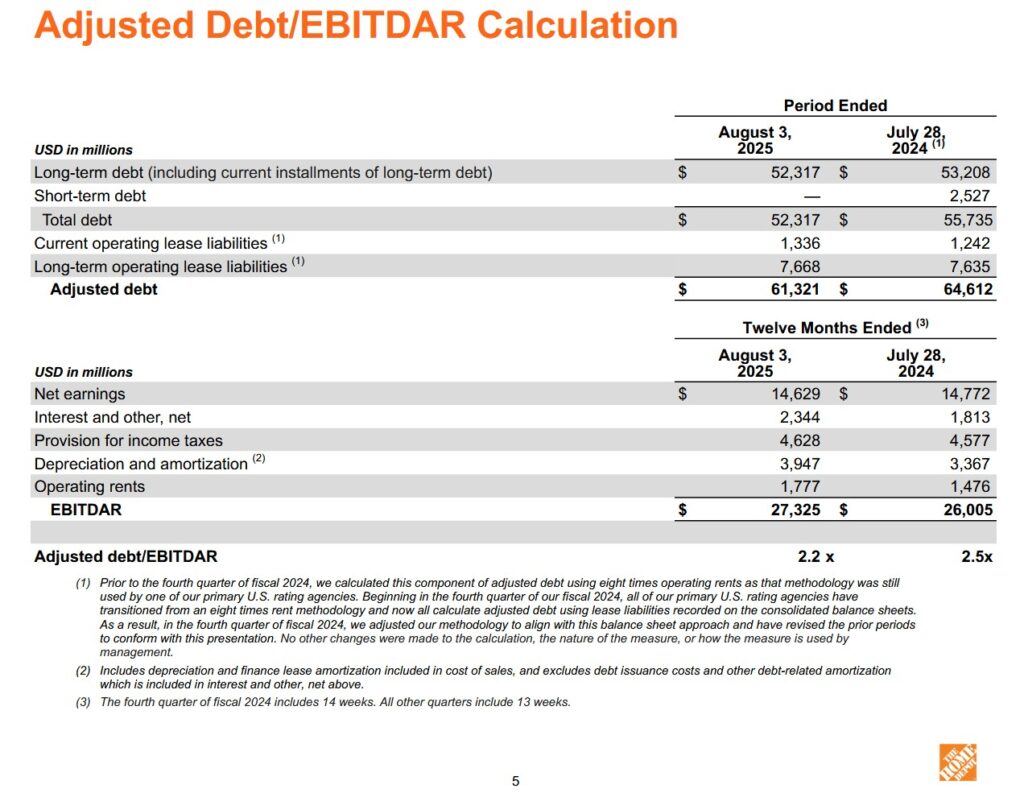
Looking at HD’s most recent schedule of long-term debt, we see that it has a manageable level of debt maturing in the next few years. HD should be able to meet its obligations and reduce its adjusted debt/EBITDAR ratio to 2x by the end of FY2026.
NOTE: HD defines EBITDAR as net earnings before interest and other, net, income taxes, depreciation and amortization, and operating rents calculated on a trailing twelve month basis.
There is no change to HD’s senior unsecured domestic currency credit ratings following my prior post. The ratings and outlook remain:
- Moody’s: A2 and stable – last reviewed March 28, 2024;
- S&P Global: A and stable – last reviewed April 1, 2025; and
- Fitch: A and stable – last reviewed July 1, 2025.
These ratings are the middle tier of the upper-medium grade category. They define HD as having a STRONG capacity to meet its financial commitments. However, it is somewhat more susceptible to the adverse effects of changes in circumstances and economic conditions than obligors in higher-rated categories.
These investment-grade ratings are acceptable for my purposes.
Dividends and Share Repurchases
Dividend and Dividend Yield
HD’s dividend history is accessible here.
Share Repurchases
In August 2023, HD’s Board approved a $15B share repurchase authorization with no prescribed expiration date that replaced the previous authorization of $15B which was approved in August 2022. As of May 4, 2025, ~$11.7B of the $15.0B share repurchase authorization remained available. This figure has not changed in Q2 2025 because HD paused share repurchases in March 2024 because of its acquisition of SRS Distribution.
HD’s currently has a 2.2x debt-to-EBITDAR ratio and the focus is to reduce this to ~2.0x by the end of FY2026 before the resumption of repurchases.
Valuation
HD’s FY2025 guidance calls for diluted EPS to decline ~3% from $14.91 in FY2024 (or ~$14.46) and adjusted diluted EPS to decline ~2% from $15.24 in FY2024 (or ~$14.94).
As I compose this post, HD’s share price is ~$401.74. Based on management’s FY2025 guidance, we get a ~27.8 forward diluted PE and a ~27 forward adjusted diluted PE.
NOTE: The broker estimates reflect the current fiscal year as being FY2026 despite HD treating the current fiscal year as being FY2025.
HD has very recently released its Q2 results. I, therefore, expect a slight adjustment to adjusted diluted EPS broker estimates over the coming days. For now, however, this is HD’s forward valuation using currently available estimates and the current ~$401.74 share price:
- FY2026 – 33 brokers – mean of $15.01 and low/high of $14.93 – $15.30. Using the mean estimate, the forward adjusted diluted PE is ~26.8.
- FY2027 – 33 brokers – mean of $16.28 and low/high of $15.45 – $16.83. Using the mean estimate, the forward adjusted diluted PE is ~24.7.
- FY2028 – 24 brokers – mean of $17.73 and low/high of $16.20 – $18.90. Using the mean estimate, the forward adjusted diluted PE is ~22.7.
I anticipate that HD’s FCF/Diluted EPS ratio for the current fiscal year will be ~100% when calculated under the conventional method and ~97% when calculated under the modified method. Given this, HD’s valuation based on FCF will likely be marginally higher than the ~27.8 forward diluted PE and a ~27 forward adjusted diluted PE (based on management’s guidance).
For comparison, I wrote the following in my August 15, 2024 post:
YTD2024, HD has generated diluted EPS and adjusted diluted EPS of $8.23 and $8.34. The current FY2024 guidance, however, is for a 53-week diluted EPS decline of 2% – 4% and a 53-week adjusted diluted EPS decline of 1% – 3%. We can, therefore, anticipate diluted EPS of ~$14.51 – ~$14.81. With shares having closed at $355.66 on August 14, the forward diluted PE is ~24 – ~24.5.
I expect adjusted diluted EPS broker estimates to be amended slightly lower over the coming days but for now, this is HD’s forward valuation based on currently available estimates:
- FY2024 – 22 brokers – mean of $14.84 and low/high of $14.53 – $15.18. Using the mean estimate, the forward adjusted diluted PE is ~24.
- FY2025 – 31 brokers – mean of $15.62 and low/high of $14.56 – $17.34. Using the mean estimate, the forward adjusted diluted PE is ~22.8.
- FY2026 – 20 brokers – mean of $17.04 and low/high of $15.55 – $18.99. Using the mean estimate, the forward adjusted diluted PE is ~20.9.
HD has generated YTD FCF of ~$9.4B. Let’s give HD the benefit of the doubt that it will generate $15B in FY2024 despite the difficult business environment. The diluted weighted average common shares outstanding in Q2 and the first half of FY2024 is 992 million. No change is expected since share repurchases have been paused until HD deleverages.
If we divide $15B by 992 million shares, we get ~$15.12 FCF/share. Divide $355.66 by $15.12 and we get P/FCF of ~23.52.
A more reasonable valuation for me would be if shares were to retrace to ~$310 or less. If HD’s share price were to retrace to ~$310 and we use a diluted EPS of ~$14.51 – ~$14.81, we would be looking at a ~24 – ~21.4 PE.
On a FCF basis, ~$310/$15.12 is a P/FCF of ~20.5.
I was of the opinion HD’s valuation was rich at the time of my August 15, 2024 post. Now, its valuation is even less attractive. I, therefore, have no intention of immediately increasing my exposure.
Final Thoughts
At various points in FY2016 – FY2018, FY2020 (the onset of COVID), FY2022, and FY2023 HD was overvalued but not enough to dissuade me from initiating a position on April 4, 2022 with the purchase of 200 shares @ ~$303.36. I subsequently acquired an additional 50 shares @ ~$301.64 on August 2, 2022.
Through the automatic reinvestment of dividend income, my HD exposure is currently 263 shares in a ‘Side’ account within the FFJ Portfolio.
HD was not a top 30 holding when I completed my 2025 Mid-Year Portfolio Review.
As the industry leader by a wide margin, HD will likely benefit from industry consolidation. The recent addition of SRS and the impending acquisition of GMS bode well for its continued dominance.
The housing market in many key US and Canadian regions in which HD operates are struggling. On the Q2 2025 earnings call with analysts, management states:
Certainly, some relief on mortgage rates, in particular, could help, I think, referring to it a bit of a frozen housing market with 40-plus year low turnover rates, and even new starts are struggling a bit.
In addition to stagnant real estate growth, the implementation of tariffs have led to a highly uncertain macroeconomic environment. Fortunately, HD sources over 50% of its products domestically from within the US. These products are not subject to tariffs. Imported goods will, obviously, experience upward price pressure as a result of various tariff rates. Management is of the opinion, however, that significantly higher prices will not be broad based.
Given the current economic environment, many consumers are reining in their spending. As a result, HD’s key sales metrics will likely continue to experience short-term pressure.
A fair price appears to be closer to ~$330 versus the current ~$401.74. At ~$330 and using management’s FY2025 guidance of $14.46 diluted EPS and ~$14.94 adjusted diluted EPS, we arrive at a more reasonable forward diluted PE of ~22.8 and adjusted forward diluted PE of ~22.1.
I wish you much success on your journey to financial freedom!
Note: Please send any feedback, corrections, or questions to finfreejourney@gmail.com.
Disclosure: I am long HD.
Disclaimer: I do not know your circumstances and do not provide individualized advice or recommendations. I encourage you to make investment decisions by conducting your research and due diligence. Consult your financial advisor about your specific situation.