I last reviewed Danaher Corporation (DHR) in this April 25, 2025 post at which time the most current financial information was for Q1 2025.
On July 21, 2025, I acquired an additional 100 shares @ $188.30 in a ‘Core’ account in the FFJ Portfolio bringing my exposure to 901 shares. As I finalize this post the morning of July 23, the share price has risen to ~$197.40. The company has not fundamentally changed in a matter of 2 days yet the share price has risen ~$9.10. With ~719.1 million outstanding diluted shares (Q2 2025), the market cap has risen ~$6.544B. This is insane!
Business Overview
DHR is a global science and technology innovator committed to accelerating the power of science and technology to improve human health. It is comprised of more than 18 operating companies with leadership positions in the biotechnology, life sciences and diagnostics sectors, organized under three segments (Biotechnology, Life Sciences and Diagnostics). Its research and development, manufacturing, sales, distribution, service and administrative facilities are located in more than 50 countries.
Links to the websites of the entities under the DHR umbrella are accessible here.
Part 1 Item 1 in the Form 10-K that is accessible through the SEC Filings section of the company’s website provides ample information to learn about the company.
Financials
Q2 and YTD2025 Results
On July 22, DHR released Q2 and YTD2025 results and revised FY2026 guidance. Refer to the material available in the Quarterly Earnings section of DHR’s website.
Within DHR’s Q2 2025 Form 10-Q is a section entitled ‘Business Performance and Outlook’ that commences on page 29 of 45. Within this section we find the following:
As a diversified, global business, Danaher operates a global supply chain and sources parts and materials globally. In the second quarter of 2025, the U.S. implemented significant new tariffs on imports from a wide range of countries, which has also prompted retaliatory tariffs by a number of countries and a cycle of retaliatory tariffs by both the U.S. and other countries. Subsequently, actions were taken by the U.S. and certain other countries to modify certain of these tariffs and/ or delay their effective dates, but a number of new tariffs remain in effect, including significant tariffs between the U.S. and China. In addition, a number of new tariffs have been threatened and the U.S. and other countries continue to negotiate trade arrangements and tariff levels.
Based on the tariffs enacted and in effect as of July 20, 2025 (the “enacted tariffs”), the Company anticipates incurring incremental tariff costs for the full year 2025 of several hundred millions of dollars. These incremental costs from the enacted tariffs reflect their impact on the costs of parts and materials used by the Company to produce products, as well as costs the Company may incur on finished goods shipped to customers. The Company expects to largely offset the operating profit impact of the enacted tariffs with manufacturing footprint changes, supply chain adjustments, surcharges and additional productivity and cost savings actions. To the extent the Company is unable to offset the incremental cost from the enacted tariffs, or the enacted tariffs negatively impact demand, the Company’s revenue and profitability would be adversely impacted. If the delayed tariffs come into effect or other additional tariffs are adopted, the Company would incur additional tariff costs that could be material and the Company’s revenue and profitability could be adversely impacted.
Given the current business environment, investors would be wise not to fixate on DHR’s short-term business challenges. They are unlikely to persist in perpetuity, and therefore, we should concern ourselves with how management navigates the company during periods of economic upheaval.
Many retail investors often overlook a company’s effective tax rate to their detriment. Fortunately, DHR is acutely aware of the impact of taxes on its results as noted in its Q2 2025 Form 10-Q.
As a company with global operations, DHR operates in certain jurisdictions with lower tax rates than the U.S. federal statutory rate. The impact of DHR’s global operations and benefits from tax credits and incentives, however, contribute to a lower effective tax rate compared to the U.S. federal statutory tax rate. In the Q2 and YTD 2024 and 2025, DHR’s effective tax rate differs from the U.S. federal statutory rate of 21.0% principally due to the impact of the Company’s global operations, research tax credits, foreign-derived intangible income and aggregate net discrete benefits or charges. In Q2 2025, for example, DHR’s effective tax rate was reduced by the tax effect from an intangible asset impairment in a jurisdiction with a higher statutory tax rate than the Company’s effective tax rate, partially offset by changes in uncertain tax positions. The net impact reduced DHR’s effective tax rate by 1.4%.
Conventional And Modified Free Cash Flow (FCF) Calculations (FY2019 – FY2024 and the first half of FY2024 and FY2025)
In several posts I express my thoughts about the way many companies calculate Free Cash Flow (FCF). Since FCF is a non-GAAP metric, there is no standardization in its calculation.
In most cases, companies merely deduct net CAPEX from net cash flows from operating activities. I think it is also necessary to deduct share based compensation (SBC).
Many companies employ SBC as part of their employee compensation plans and reflect this cost within the Income Statement. Because SBC involves no cash outlay, however, companies add back SBC to determine net cash flows from operating activities in the Condensed Consolidated Statement of Cash Flows.
Suppose, however, that DHR were to compensate employees 100% by way of SBC. Since there is no cash outlay, the full amount of its employee compensation is added back in the Condensed Consolidated Statement of Cash Flows to determine net cash flows from operating activities.
If, on the other hand, DHR were to have no SBC and were to actually disburse funds to pay its employees, nothing would be added back in the Condensed Consolidated Statement of Cash Flows.
By merely changing the manner in which it compensates its employees we get very different net cash flows from operating activities! How does this make any sense? Is the use of SBC not a form of ‘financing’? Would it be more proper to reflect SBC within the Cash Flows From Financing Activities section of the Condensed Consolidated Statement of Cash Flows? This way, we would arrive at similar FCF results no matter how a company chooses to compensate its employees.
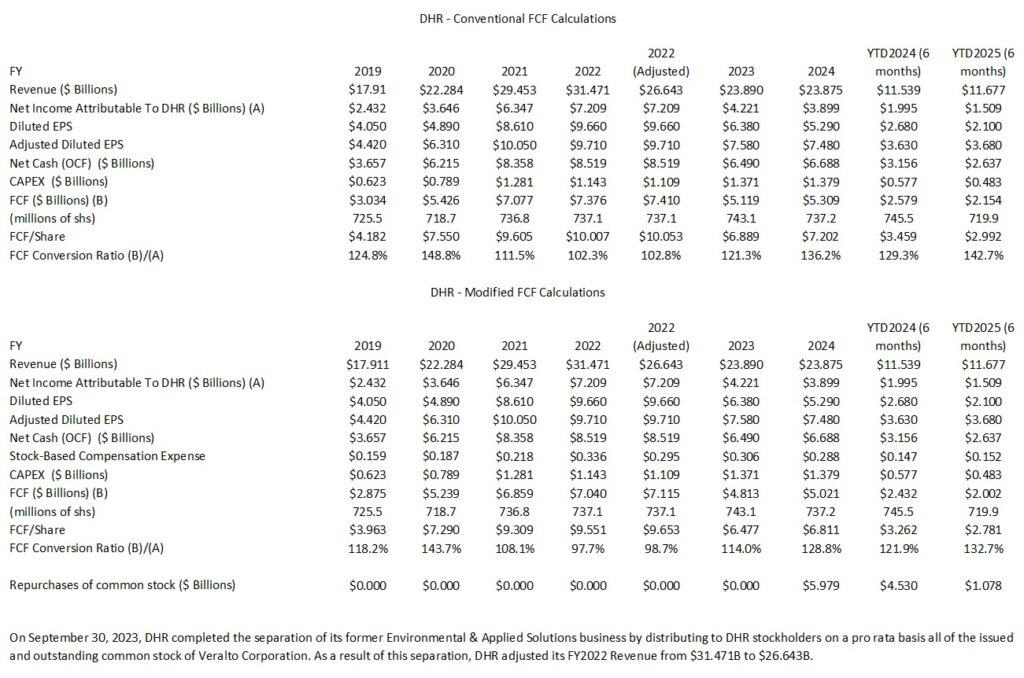
The following table reflects data extracted from the FY2019 – FY2024 and Q2 2025 reconciliation of GAAP and non-GAAP financial measures and supplemental forward-looking information documents that are accessible here. The section with the modified FCF calculations deducts share based compensation (SBC) from total operating cash provided by continuing operations.
In revisiting the historical data, I noticed that I inadvertently neglected to reflect DHR’s adjustment to its FY2022 revenue. Despite this oversight, there is no change in my assessment of DHR’s long-term outlook.
Strong free cash flow generation is one of the most important metrics at DHR. FY2024 marked the 33rd consecutive year of FCF to net income conversion which exceeded 100%. If we deduct SBC to determine FCF, however, DHR just fell short of 100% in FY2022. While there remains another half year in DHR’s FY2025 fiscal year, DHR is ‘on track’ to record its 34th consecutive year in which FCF (calculated the in the conventional manner) exceeds GAAP earnings.
FY2025 Outlook
DHR’s Q2 2025 earnings release reflects the following:
With respect to forecasted core sales growth and adjusted diluted net earnings per common share, the Company does not reconcile either of these non-GAAP measures to its respective, comparable measure prepared in accordance with U.S generally accepted accounting principles (GAAP) because (except for estimated amortization of acquisition-related intangible assets of $1.7 billion for the year ending December 31, 2025 and estimated currency translation contributions to revenue growth of 1.5% (for the third quarter 2025) and 1.0% (for the full year 2025), assuming the currency exchange rates in effect as of June 27, 2025) the additional elements that would be reflected in any such GAAP measures (such as the impact of currency exchange rates on profitability, acquisitions, divested product lines, discrete tax adjustments, impairments and gains and losses on investments) are difficult to predict and estimate and are often dependent on future events that may be uncertain or outside of our control. The impact of these additional elements could be material to our results computed in accordance with GAAP.
For the third quarter 2025, the Company anticipates that non-GAAP core revenue will grow low-single digits year-over-year.
For full year 2025, there is no change to the Company’s expectation that non-GAAP core revenue will grow approximately 3% year-over-year. The Company is also increasing its full year adjusted diluted net earnings per common share guidance to a range of $7.70 to $7.80 versus previous guidance of $7.60 to $7.75.
Risk Assessment
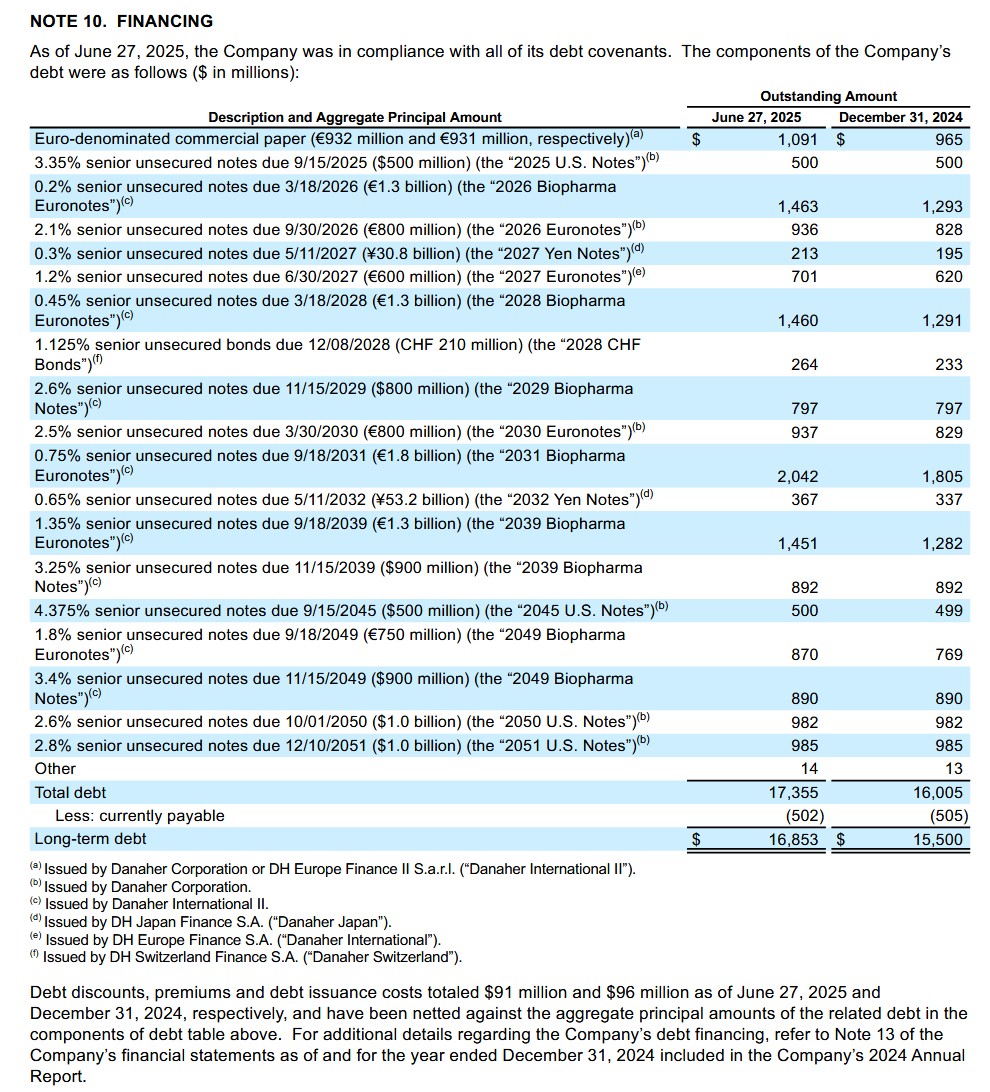
The change in the value of DHR’s long-term debt is attributed to the change in value of the reporting currency (USD) relative to the currency of DHR’s various long-term debt arrangements.
We see from these schedules that DHR has credit arrangements at very attractive rates and the scheduled maturity dates are well staggered.
The following schedule reflects DHR’s long term debt at the end of Q2 2025 and FYE2024.
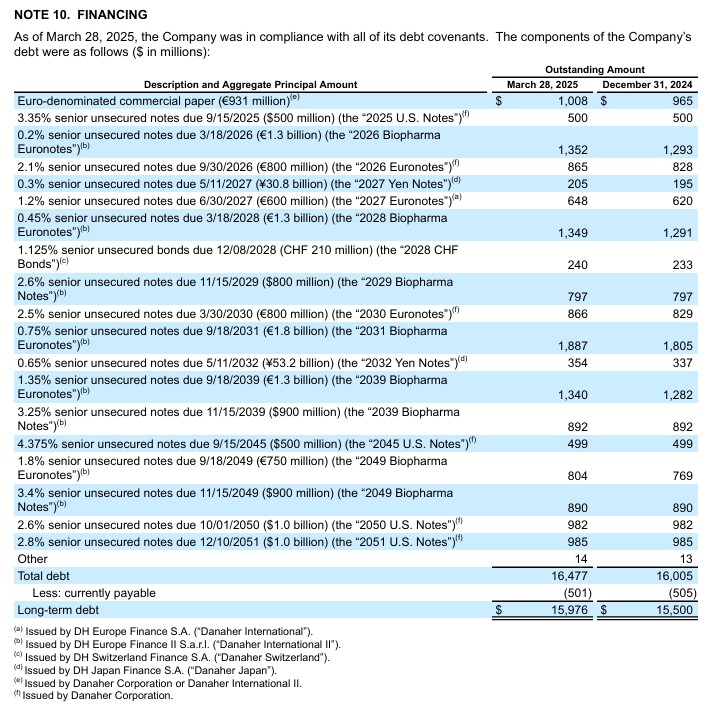
For comparison purposes, I provide DHR’s long term debt at the end of Q1 2025 and FYE2024.
DHR’s credit ratings remain the same from my last review.
- Moody’s: Upgraded to A3 from Baa1 on October 10, 2022. June 18, 2024 is the last review date and the outlook remains stable.
- S&P Global: Upgraded to A- from BBB+ on June 11, 2022. June 23, 2025 is the last review date and the outlook remains stable.
Both ratings are at the bottom tier of the upper-medium investment-grade tier and define DHR as having a STRONG capacity to meet its financial commitments. However, DHR is somewhat more susceptible to the adverse effects of changes in circumstances and economic conditions than obligors in higher-rated categories.
These ratings satisfy my conservative investment profile.
Dividend and Dividend Yield
DHR’s quarterly dividend is likely to remain a negligible component of the total investment return. Do not, however, fixate on dividend metrics. Focus on total potential long-term investment returns!
There were 710.2, 725.2, 718.7, 736.8, 737.1, 743.1, and 737.2 million diluted average common stock and common equivalent shares outstanding in FY2018 – FY2024. In Q1 2025, the diluted weighted average shares outstanding was 720.8 million. This was further reduced to 719.1 million in Q2 (719.9 million in the first half of FY2025).
On July 22, 2024, DHR’s Board approved a new repurchase program authorizing the repurchase of up to an additional 20 million shares of common stock from time to time on the open market or in privately negotiated transactions. As of June 27, 2025, ~12 million shares remained available for repurchase pursuant to the repurchase program.
In several recent years, DHR has repurchased no shares. In FY2024, however, DHR repurchased 3.5 million shares under the Repurchase Program for ~$5.979B. During the first half of FY2025, it repurchased ~4.5 million shares for ~$1.078B. This includes $4 million of excise taxes which will be paid in 2026.
As of June 27, 2025, ~12 million shares remained available for repurchase pursuant to the Repurchase Program.
Valuation
In Q1, DHR generated diluted and adjusted diluted EPS of $1.32 and $1.88. In Q2, it generated diluted and adjusted diluted EPS of $0.77 and $1.80. YTD2025 diluted and adjusted diluted EPS total $2.09 and $3.68. If it generates similar diluted and adjusted diluted EPS in the second half of the year, FY2025 diluted and adjusted diluted EPS could be ~$4.18 and ~$7.36.
Management’s revised adjusted diluted earnings forecast for FY2025, however, is $7.70 – $7.80 versus previous guidance of $7.60 – $7.75. Using my recent $188.30 purchase price, the forward adjusted diluted PE range is ~24.1 – ~24.45.
With shares currently trading at ~$197.40, the forward adjusted diluted PE range is ~25.3 – ~25.64.
Using my recent $188.30 purchase price and the currently available broker earnings estimates, the forward adjusted diluted PE levels are:
- FY2025 – 26 brokers – mean of $7.76 and low/high of $7.65 – $7.90. Using the mean, the forward adjusted diluted PE is ~24.3.
- FY2026 – 25 brokers – mean of $8.59 and low/high of $8.32 – $9.00. Using the mean, the forward adjusted diluted PE was ~22.
- FY2027 – 17 brokers – mean of $9.51 and low/high of $9.05 – $10.15. Using the mean, the forward adjusted diluted PE was ~20.
- FY2028 – 8 brokers – mean of $10.61 and low/high of $10.20 – $11.55. Using the mean, the forward adjusted diluted PE was ~17.7.
The valuation is slightly higher if we use the current ~$197.40 share price.
These estimates are likely to change over the coming days since results have just been released.
For comparison, the following are my valuation estimates in my April 25, 2025 post. I used the current broker guidance and the April 24 closing share price of ~$196.50.
- FY2025 – 26 brokers – mean of $7.70 and low/high of $7.60 – $7.83. Using the mean, the forward adjusted diluted PE is ~25.5.
- FY2026 – 25 brokers – mean of $8.56 and low/high of $8.21 – $8.85. Using the mean, the forward adjusted diluted PE is ~23.
- FY2027 – 18 brokers – mean of $9.47 and low/high of $8.95 – $10.15. Using the mean, the forward adjusted diluted PE is ~20.7.
- FY2028 – 8 brokers – mean of $10.60 and low/high of $10.06 – $11.55. Using the mean, the forward adjusted diluted PE is ~18.5.
I place no credence in the FY2026 – FY2028 estimates as much can change over the next few years.
Earnings are subject to manipulation, and therefore, I prefer to value a company using free cash flow. Given that I rely on the more conservative modified FCF calculation method, my P/FCF estimates are higher than results calculated using the conventional method. The disparity between the conventional and modified calculations become increasingly pronounced the greater the SBC component.
In the first half of FY2025, DHR’s FCF/share is $2.99 and $2.78 (see table above) calculated using the conventional and the modified methods.
Given the current business environment, I anticipate that DHR’s FCF in the second half of FY2025 will be similar to the first half of the year. I, therefore, estimate that DHR’s FY2025 conventional and modified FCF/share will be ~$5.99 and ~$5.56. Using my recent $188.30 purchase price, my DHR forward P/FCF estimates are ~31.4 and ~33.9. With shares currently trading at ~$197.40, the forward P/FCF estimates increase to ~33 and ~35.5.
Final Thoughts
DHR was my:
- 28th largest holding when I completed my 2023 Year-End Portfolio Review;
- 22nd largest holding when I completed my 2024 Mid-Year Portfolio Review;
- 19th largest holding when I completed my 2024 Year-End Portfolio Review; and
- 23rd largest holding when I completed my 2025 Mid-Year Portfolio Review.
I am unable to predict short-term share price behavior. As a long-term investor, however, I am relatively confident that attractively valued quality companies have a good probability of generating attractive returns.
In my prior post I conclude:
Should DHR’s share price improve from the current ~$196.50 to ~$230 – below the ~$265 I consider to be a fair value – investors would generate a ~17% return. If the share price appreciates to $245 or $265, the return rises to ~24.7% and ~34.9%, respectively.
I continue to anticipate that DHR will face challenging business conditions over the next few quarters. Once growth trends normalize, however, I think it will be able to generate low double-digit earnings growth. This, however, is unlikely to begin until 2026 – 2027.
Management has a solid track record of allocating capital to enhance shareholder returns. The time to invest in DHR is when it has fallen out of favor with the investment community. Based on my assessment of the company’s long-term outlook, shares continue to be undervalued despite the sudden share price surge.
I wish you much success on your journey to financial freedom!
Note: Please send any feedback, corrections, or questions to finfreejourney@gmail.com.
Disclosure: I am long DHR.
Disclaimer: I do not know your circumstances and do not provide individualized advice or recommendations. I encourage you to make investment decisions by conducting your research and due diligence. Consult your financial advisor about your specific situation.
I wrote this article myself and it expresses my own opinions. I do not receive compensation for it and have no business relationship with any company mentioned in this article.