After ~38 years of investing, I have lost count of my errors of omission and commission. Intuitive Surgical (ISRG) has to rank amongst one of my biggest errors!
On October 20, 2021, I initiated a 30 share position in one of the ‘Core’ accounts within the
FFJ Portfolio. I subsequently acquired another 30 shares on November 22, 2021.
Our ISRG exposure was less than a quarter percent of our total investment holdings when I completed my
2022 Investment Holdings Review. ISRG, however, was our 7th largest holding and it comprised 3.27% of our total investment holdings when I completed my
2024 Year End Review.
At the time of my 2024 year end review, ISRG’s share price was ~$522; the closing share price on January 24 is ~$584. In addition, I sold shares in other holdings in early January 2025 as part of our Registered Retirement Savings Plan meltdown strategy. ISRG is now our 6th largest holding.
A young investor I am helping on their journey to financial freedom also has ISRG exposure. I exclude these shares, however, when completing my semi-annual reviews.
Had I
‘backed up the truck’ in the first half of 2022, my ISRG exposure would be significantly greater than the current level. This is the issue I address in my January 8, 2025
The Position Sizing Conundrum post. When we have a high conviction in a particular company and the valuation is attractive, we should make a meaningful investment.
At some point diversification becomes ‘d
iworsification’; this is when an investor adds too many assets to their portfolio which can increase risk and decrease returns.
Over several recent months I have made a concerted effort to cull our holdings to focus on increasing exposure to certain high quality companies; I currently have exposure to 7 Canadian and 48 US companies and the top 20 companies now comprise ~70% – ~75% of our total holdings.
In all my 2023 and 2024 ISRG posts that are accessible through the
Archives section of this site, I express concern about ISRG’s valuation. Nevertheless, the share price continues to rise. On January 22, for example, ISRG’s share price rose to ~$610.50. After the January 23 market close, however, ISRG released its Q4 and FY2024 results and FY2025 outlook and on January 24, the share price tumbled to ~$584. Even after the pullback, I consider ISRG’s valuation to be too rich.
Business Overview
Please review the
company’s website and FY2023 Form 10-K if you are unfamiliar with the company.
The Q3 2024 Form 10-Q also contains a wealth of information.
ISRG To Acquire Distribution Businesses in Certain Euro Countries
On January 21,
ISRG announced that it has entered into a definitive agreement with the current Intuitive technology distributors ab medica, Abex, Excelencia Robotica, and their affiliates to acquire the da Vinci and Ion distribution businesses in Italy, Spain, Portugal, Malta, and San Marino, and associated territories. The transaction consists of an upfront cash payment of approximately €290 million and up to an additional €31 million in commercial milestone cash payments, subject to certain closing adjustments.
ISRG expects to complete the transaction in the first half of 2026, subject to customary closing conditions.
The expectation is for this transaction to be slightly accretive to pro forma EPS.
The primary motivation for this transaction is to develop closer relationships with customers serving a combined population of ~118 million people.
Financials
Q4 and FY2024 Results
ISRG’s Q4 and YTD2024 results are accessible in the
January 23 Press Release and the Form 8-K released on January 23 which is accessible through the
SEC Filings section of ISRG’s website.
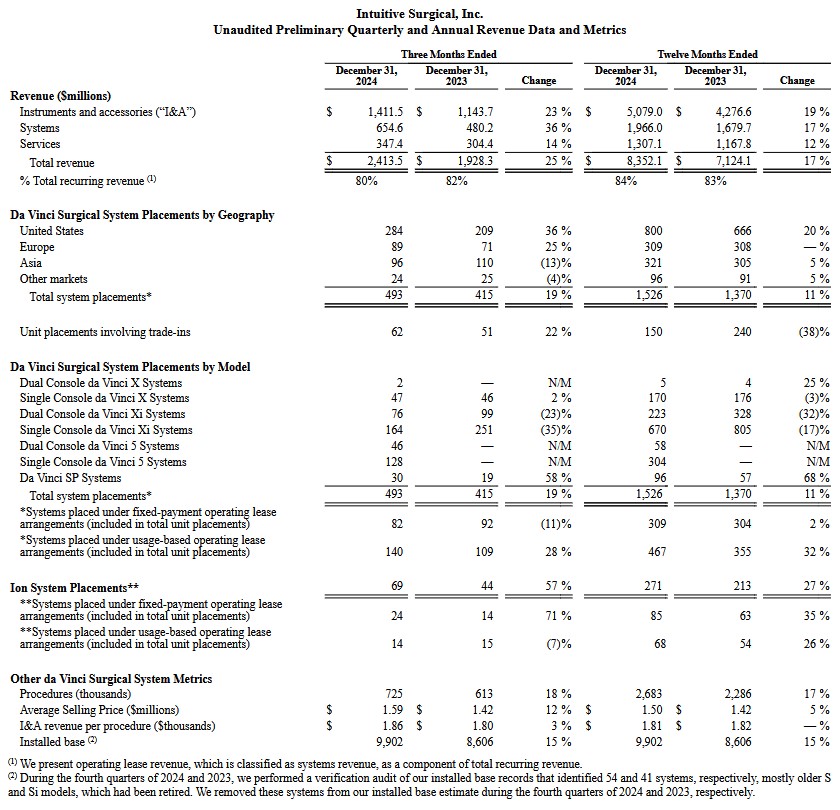
At FYE2023 and FYE2024, ISRG’s cash, cash equivalents, and investments amounted to ~$7.343B and ~$8.832B, respectively.
Of the ~$2.044B and ~$2.214B in total liabilities at FYE2023 and FYE2024, ~$0.492B and ~$0.523B was deferred revenue. A
very small component of ISRG’s long-term liabilities is deferred revenue; at the end of Q3 2024 it was less than $60 million. Deferred revenue is money received from customers before services/products are provided.
ISRG could clear 100% of its liabilities and still have several billion dollars of liquidity remaining.
Single and dual console da Vinci 5 systems placements,
a fifth-generation robotic surgical system, are accelerating as the adoption of da Vinci 5 increases. The
da Vinci 5 builds on decades of technology developed by ISRG and has
10,000 times more computing power than the da Vinci Xi systems.
The average selling price of ISRG’s various systems was ~$1.86 million in Q4 2024 versus ~$1.8 million in Q4 2023. With many hospitals facing budget constraints, it becomes increasingly necessary for hospitals to finance the acquisition of ISRG systems; ISRG generates additional income through ISRG System Leasing.
ISRG’s Ion system adoption is also gaining traction but its results pale in comparison to the other systems.
With the release of ISRG’s Form 10-K not expected for a few more weeks, please refer to ISRG’s Q3 2024 Form 10-Q. On page 11 of 56, ISRG reports ~$1.455B of operating lease assets. Page 13 of 56 reflects ~$0.56B of sales-type or operating lease revenue in the first 9 months of FY2024.
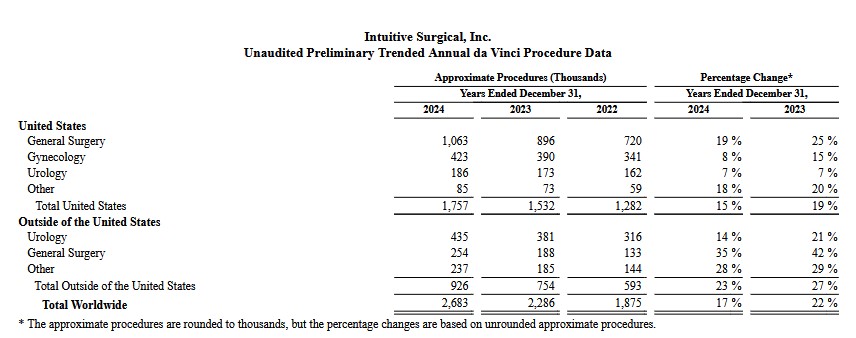
Although procedures in the US dominate, international procedures are experiencing strong growth. This explains why ISRG is acquiring international businesses in parts of Europe. I anticipate ISRG will acquire distribution businesses in other regions if installations and procedure volumes continue to increase internationally.
Conventional And Modified Free Cash Flow (FCF) Calculations (FY2019 – FY2024)
In my September 28
How Stock Based Compensation Distorts Free Cash Flow post, I touch upon how a company’s FCF can be distorted. In several subsequent posts, I take a conservative approach when looking at a company’s FCF.
FCF is a non-GAAP measure, and therefore, the manner in which it is computed is open to debate. Most companies subtract capital expenditures (CAPEX) from Net Cash Provided by Operating Activities found in the Consolidated Statement of Cash Flows. They do not, however, deduct share-based compensation (SBC). Given the magnitude of ISRG’s SBC, I think it is prudent to deduct it.
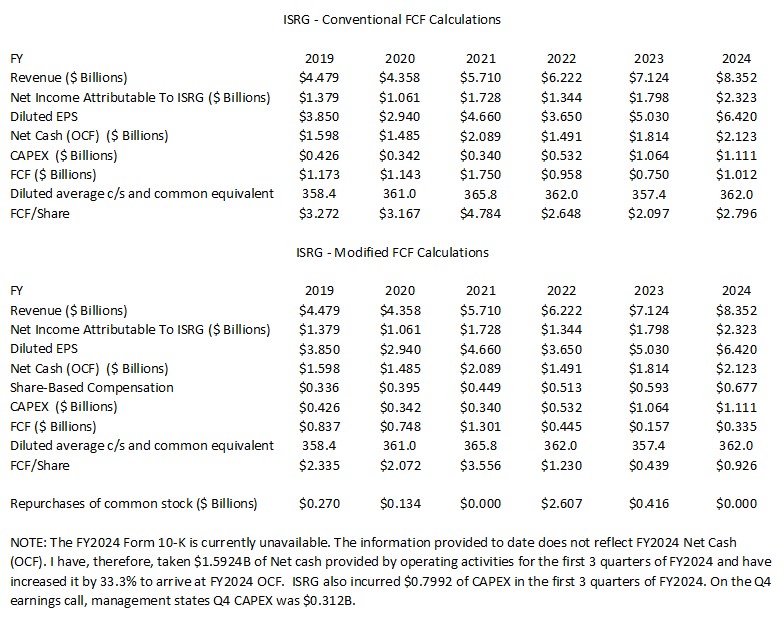
On a positive note, ISRG has not aggressively repurchased shares with the exception of FY2022 when its valuation was more reasonable. The Board is likely of the opinion that reinvesting in the business is the superior means by which to allocate capital. The company is growing rapidly and needs to ensure it is well positioned to fend off competitors who are developing competing products. I suspect the Board also recognizes that shares are richly valued.
When compared to a company such as Union Pacific (UNP) which I reviewed in this
January 24, 2025 post, ISRG does not appear to be a capital intensive company. In the last couple of years, CAPEX has increased to just over $1B as the company ramps up operations to handle future growth. CAPEX, however, is forecast to subside with the FY2025 CAPEX outlook being ~$0.65B – ~$0.8B versus ~$1B in each of FY2023 and FY2024. Annual R&D expenses, however, are significant. ISRG will likely spend ~$1B on R&D in FY2025 which is roughly the same as in each of FY2023 and FY2024.
FY2025 Outlook
ISRG expects worldwide da Vinci procedures to increase ~13% – ~16% in 2025 as compared to 2024; worldwide da Vinci procedure growth was 17% in 2024 as compared to 2023.
The low end of the range assumes:
- growth in China continues to be impacted by environmental and competitive dynamics;
- European governments continue to constrain hospital CAPEX budgets limiting the expansion of capacity in the field; and
- bariatric procedure declines continue at rates similar to 2024.
The high end of the range assumes:
- China procedure growth recovers relative to 2024;
- the CAPEX environment improves in Europe; and
- bariatric procedure declines moderate.
In 2024, non-GAAP gross profit margin was ~69.1%. In 2025, ISRG expects non-GAAP gross profit margin to be ~67% – ~68% of net revenue. The lower estimate reflects significant incremental depreciation as ISRG brings on new facilities, the impact of growth in newer products, and the impact of the stronger US dollar. This range does not include any potential impact of new tariffs, which could be material.
In 2024, non-GAAP operating expenses grew ~10%. In 2025, ISRG expects non-GAAP operating expense growth of ~10% – ~15%. This growth reflects increased depreciation from new facilities, investments in innovation to drive our growth objectives, and an increase in legal expenses.
ISRG anticipates its operating margins in 2025 to be slightly weaker than in 2024 due to:
- the expectation that leasing rates will be higher than in Q4 2024 which results in revenue and profits for related system placements to be recorded over multiple years versus in the quarter of placement;
- significantly higher depreciation expense given recent capital expenditures; and
- a higher mix of da Vinci 5, Ion NSP revenue, which carry product margins below the corporate average.
In addition:
- revenue denominated in non-USD currencies represents ~25% of ISRG’s total revenue. On a revenue-weighted basis, using current exchange rates, the US dollar is ~4% stronger than rates realized in Q4 2024.
- the broad launch of da Vinci 5 is slated for mid-2025. Customers will have the opportunity to upgrade their fleets and ISRG expects trading credits to be significantly higher than recent periods adversely impacting system average selling prices.
- the increasing choice customers have. As competitors introduce robotic systems to the market and seek geographical clearances, ISRG may see capital selling cycles lengthen as customers evaluate alternatives.
The 2025 non-cash stock compensation expense forecast is ~$0.76B – ~$0.79B.
The expectation for Other Income, which is mostly of interest income, is ~$0.37B – ~$0.4B.
The CAPEX forecast is ~$0.65B – ~$0.8B. The primary CAPEX will be for planned facility construction activities.
ISRG’s pro forma income tax rate was 21.4% in FY2024 and the estimate for 2025 is ~22% – ~23% of pretax income.
Credit Ratings
No rating agency rates ISRG because it
has no debt.
Dividends
Dividend and Dividend Yield
ISRG does not distribute a dividend.
Share Repurchases
One means by way a company can allocate its capital is to repurchase shares. This works wonders when shares are undervalued. Fortunately, ISRG has not repurchased any shares in recent quarters as this would have been a destruction of shareholder value.
Valuation
ISRG appears richly valued when I look at it from earnings and cash flow perspectives.
As a rapidly growing business that does not rely on debt to fuel its growth, it is not surprising many investors view ISRG is an attractive investment. Unfortunately, some investors will acquire shares at any price.
If I try to value ISRG using GAAP earnings or modified FCF, ISRG’s valuation is in the stratosphere. As it is, using much higher adjusted diluted EPS broker estimates leads to extremely high valuations.
At the time of my January 24 post, the forward-adjusted diluted PE estimates using the current ~$370 share price were:
- FY2024 – 26 brokers – ~59 based on a mean of $6.29 and low/high of $5.96 – $6.76.
- FY2025 – 21 brokers – ~50 based on a mean of $7.36 and low/high of $6.76 – $8.34.
- FY2026 – 14 brokers – ~43 based on a mean of $8.63 and low/high of $7.84 – $10.12.
When I wrote my April 20, 2024 post, ISRG shares traded at ~$366. Based on the estimates at the time of my post, the forward-adjusted diluted PE estimates were:
- FY2024 – 26 brokers – ~58.4 based on a mean of $6.27 and low/high of $5.96 – $6.58.
- FY2025 – 26 brokers – ~50 based on a mean of $7.34 and low/high of $6.87 – $7.76.
- FY2026 – 18 brokers – ~42.6 based on a mean of $8.60 and low/high of $7.85 – $9.29.
At the time of my July 23, 2024 post, the share price was ~$461. ISRG’s forward-adjusted diluted PE levels using the currently available information were:
- FY2024 – 26 brokers – ~70.3 based on a mean of $6.56 and low/high of $6.21 – $6.75.
- FY2025 – 27 brokers – ~60.7 based on a mean of $7.60 and low/high of $7.16 – $8.01.
- FY2026 – 21 brokers – ~52.0 based on a mean of $8.86 and low/high of $8.28 – $9.56.
Using the ~$521 closing share price of October 18, 2024 and the current broker estimates, ISRG’s forward-adjusted diluted PE levels were:
- FY2024 – 26 brokers – ~76.4 based on a mean of $6.82 and low/high of $6.42 – $7.11.
- FY2025 – 27 brokers – ~66.9 based on a mean of $7.79 and low/high of $7.24 – $8.25.
- FY2026 – 23 brokers – ~57.3 based on a mean of $9.09 and low/high of $8.28 – $9.75.
Now, ISRG’s January 24, 2025 closing share price is ~$584. Using the current broker estimates, ISRG’s forward-adjusted diluted PE levels are:
- FY2025 – 27 brokers – ~73.4 based on a mean of $7.96 and low/high of $7.69 – $8.45.
- FY2026 – 26 brokers – ~62.7 based on a mean of $9.32 and low/high of $8.05 – $10.00.
- FY2027 – 15 brokers – ~53.5 based on a mean of $10.91 and low/high of $10.01 – $11.68.
- FY2028 – 3 brokers – ~49 based on a mean of $11.93 and low/high of $11.39 – $12.80.
Final Thoughts
Despite new competitors arriving on the scene, I anticipate ISRG will retain its system dominance. An extension in the sales cycle and margin pressure, however, are likely.
The total addressable market remains significant considering ISRG’s systems were used to ‘only’ perform ~2.683 million procedures in FY2024. I expect continued growth since existing robotic surgery applications do not currently cover all the potential procedures in soft tissue surgery that could migrate to robot surgery.
Although ISRG has a promising future, I am reluctant to acquire very richly valued shares.
While tempting to write covered calls, the most contracts I could write is 4 (100 shares = 1 contract). A March 21, 2025 expiry is the longest I would go. At a $640 strike price, I would receive ~$3.60/share so I would only collect $1440 (before fees).
I do not profess to understand the short-term behavior of share prices. Under the current market conditions, I cannot rule out ISRG’s share price being bid up even further. If ISRG’s share price suddenly surges above the $640 strike price, I face the risk of having my shares called away. If this happens, I would incur a significant capital gain on which I would incur a tax liability. For the sake of $1440, I will not assume the risk.
One concern I have with ISRG is the extent to which it relies on SBC to compensate its employees. Fortunately, weakness in ISRG’s share price in 2022 and parts of 2023 provided ISRG with the opportunity to ramp up share repurchases. As a result, the diluted weighted average number of outstanding shares in FY2024 is close to the level in FY2020. I do, however, wonder if ISRG will follow Salesforce, Workday, and Zoom Communications by curtailing the issuance of SBC as part of its employee compensation.
I cannot justify adding to my exposure at this point. A plunge in the share price to the mid $300s, however, would prompt me to
‘back up the truck’. I wish you much success on your journey to financial freedom!
Note: Please send any feedback, corrections, or questions to finfreejourney@gmail.com.
Disclosure: I am long ISRG.
Disclaimer: I do not know your circumstances and do not provide individualized advice or recommendations. I encourage you to make investment decisions by conducting your own research and due diligence. Consult your financial advisor about your specific situation. I wrote this article myself and it expresses my own opinions. I do not receive compensation for it and have no business relationship with any company mentioned in this article.