![]()
I last reviewed Intercontinental Exchange (ICE) in this February 15, 2026 post at which time the Q4 and FY2025 results were the most current. With the release of Q1 2026 results on April 30, 2026 I revisit this existing holding.
Business Overview
Part 1 Item 1 in the FY2025 Form 10-K describes ICE’s business as follows:
ICE is a leading global provider of technology and data to a broad range of customers including financial institutions, corporations and government entities. Our products, which span major asset classes including futures, equities, fixed income and US residential mortgages, provide our customers with access to mission critical tools that are designed to increase asset class transparency and workflow efficiency. Although we report our results in three reportable business segments, we operate as one business, leveraging the collective expertise, particularly in data services and technology, that exists across our platforms to inform and enhance our operations. Our segments are as follows:
-
Exchanges: We operate regulated marketplace technology for the listing, trading and clearing of a broad array of derivatives contracts and financial securities as well as data and connectivity services related to our exchanges and clearing houses.
-
Fixed Income and Data Services: We provide fixed income pricing, reference data, indices, analytics and execution services as well as global credit default swaps, or CDS, clearing and multi-asset class data delivery technology.
-
Mortgage Technology: We provide a technology platform that offers customers comprehensive, digital workflow tools that aim to address inefficiencies and mitigate risks that exist in the U.S. residential mortgage market life cycle, from application through closing, servicing and the secondary market.
The company’s website and the Investor Presentation that is accessible through the Additional Resources link also contain a wealth of information.
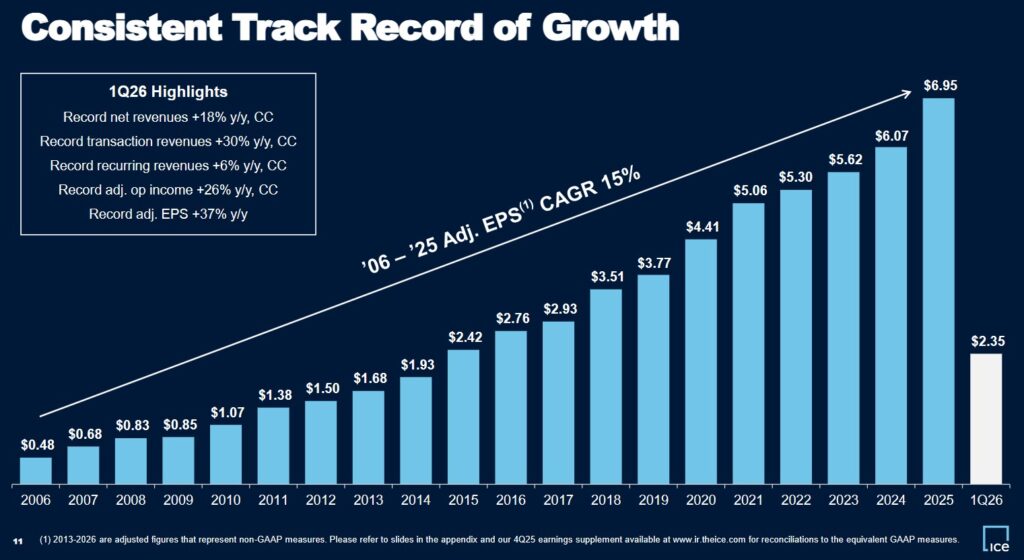
We see from the following graph that ICE has a consistent track record of adjusted EPS growth.
ICE’s revenue used to be heavily reliant on volatile trading revenue. This made ICE’s quarterly results susceptible to wild variances. Through a series of acquisitions, ICE has diversified its business into new lines of business that generate more reliable annual recurring revenue (ARR).
ICE has successfully used its Mortgage Technology segment to significantly shift the firm toward a more stable, recurring revenue model. Prior to COVID, ICE’s recurring revenue was ~40% of total revenue. Recurring revenue is now closer to ~51%. ICE now no longer only wins when markets are volatile. It is now a software powerhouse that earns money every month from the massive backlog of existing U.S. mortgages.
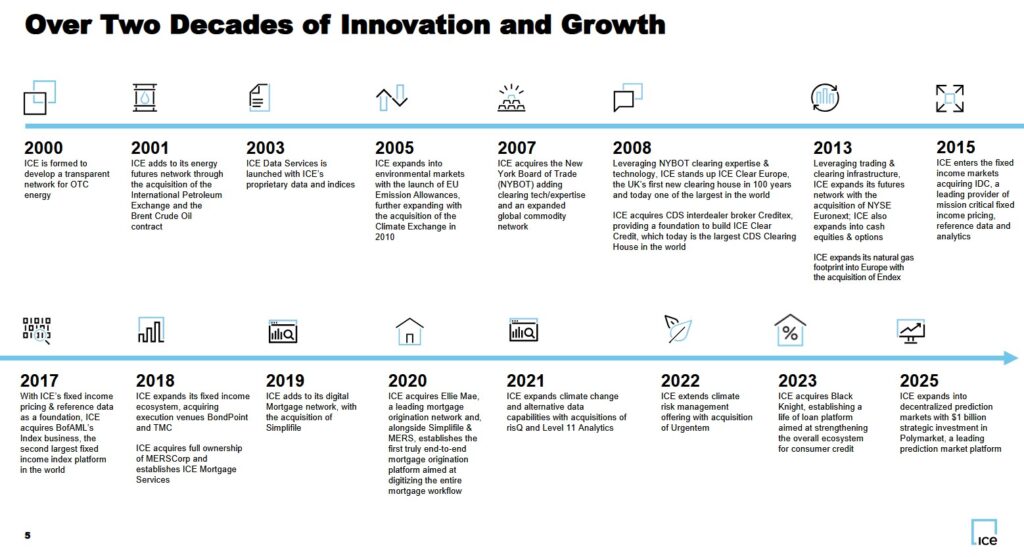
By combining Ellie Mae (acquired for ~$11B in 2020) with Black Knight (acquired for ~$11.7B in 2023), ICE is now the largest provider of mortgage technology in the US.
The mortgage technology segment business segment provides services that allow for the electronic registration, origination, and servicing of mortgages as well as data analytics for mortgage issuers and investors. The rationale for making these two sizable acquisitions was to streamline the entire mortgage process. To do so, ICE must consolidate a highly fractured industry with multiple layers and participants onto a single platform. The value of this platform should increase as more participants, regulators, and data avail themselves of ICE’s platform.
A current headwind, however, is that the entire mortgage industry is facing pressure from high mortgage rates thus impacting mortgage origination volume. Until such time as interest rates decline, the mortgage technology business segment’s results will be underwhelming.
Financial Review
Q1 2026 Results
Material related to ICE’s Q1 2026 and prior quarters is accessible here.
ICE’s Net Income in Q1 2026 includes $0.411B in ‘Other Income, Net’ versus $0.019B in Q1 2025. Note 3 commencing on page 11 of 69 in the Q1 2026 Form 10-Q provides commentary on the carrying value of ICE’s investments including ‘Equity Investments Without Readily Determinable Fair Values’. Were we to exclude $0.411B in ‘Other Income, Net’, ICE’s ‘Income before income tax expense’ would be $1.486B versus $1.897B. This is still well in excess of what it reported in Q1 2025 ($1.067B less $0.019B ‘Other Income, Net’).
In addition, Supplemental Information is provided so we can see the trend in ICE’s volumes.
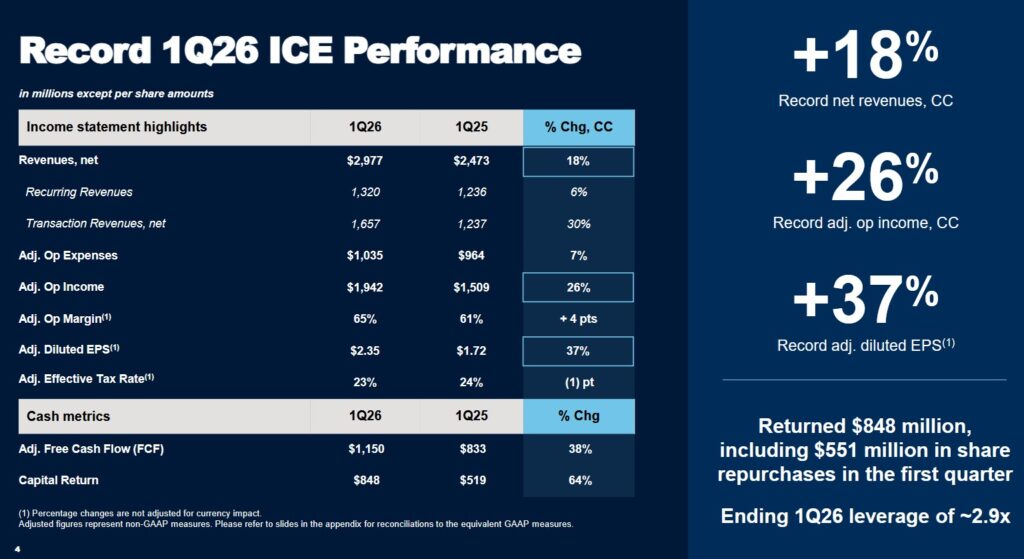
ICE reported record-breaking trading volume in its futures business. This contributed to a ~18% increase in net revenue from Q1 2025 to $2.977B and a 37% increase to $2.35 in adjusted diluted EPS from $1.72 in Q1 2025.
ICE’s Net Non-Current Deferred Tax Liability Is Quasi-Equity
At the end of Q1 2026, ICE’s Net Non-current Deferred Tax Liability (DTL) was $4.136B versus $3.998B at FYE2025. This liability is primarily a byproduct of its aggressive M&A strategy (e.g., Black Knight, Ellie Mae, and Interactive Data). It represents the temporary difference between the financial reporting (GAAP) value of assets and their tax basis.
ICE holds ~$45.7B in goodwill and other intangible assets. When it acquires a company, it writes up the book value of these assets for financial statements. For tax purposes, however, the tax basis remains lower or is amortized on a different schedule.
The DTL is essentially the future tax expense ICE would owe if it were to sell those assets at their current book value today. To a lesser extent, it also includes differences in how ICE depreciates its data centers and hardware (using accelerated methods for tax to save cash now, but straight-line for reporting).
The probability of ICE having to pay this $4.136B in cash in the near-to-medium term is extremely low because a significant portion of ICE’s DTLs is tied to indefinite-lived intangibles (like certain exchange licenses and goodwill). These liabilities only trigger a cash payment if the asset is sold or impaired. Since ICE’s core strategy is to aggregate and hold these assets indefinitely, the liability remains a permanent fixture on the balance sheet.
As long as ICE continues to grow or acquire new businesses, the reversal of old deferred taxes that would require cash disbursements is typically offset by the creation of new deferred taxes from new investments. This creates a rolling deferral where the net balance actually grows over time.
It is critical to distinguish DTLs from Current Tax Liabilities. While current taxes are paid quarterly in cash, the non-current DTL is a non-cash accounting entry. It acts more like an interest-free loan from the government that only comes due upon the liquidation of the underlying assets. Most analysts treat this as quasi-equity because it is unlikely to ever represent a real cash outflow for a going concern. It is, in the case of ICE, a permanent source of capital.
Conventional And Modified Free Cash Flow (FCF) Calculations (FY2019 – FY2025 and Q1 2026)
FCF is a non-GAAP measure, and therefore, its calculation is inconsistent. Many investors deduct CAPEX from Operating Cash Flow (OCF) to arrive at FCF. The more conservative modified method also deducts share-based compensation (SBC).
As noted in prior ICE, CME Group (CME), and Nasdaq (NDAQ) posts, we must make an adjustment for Section 31 fees (SEC or transaction fees). They are small regulatory charges imposed on the sale of exchange-listed securities based on Section 31 of the Securities Exchange Act of 1934. The fee is 1% of one eight-hundredth of the dollar value of the equities sold.
These fees are deducted because:
-
They represent a real cash outflow directly tied to a company’s trading activities, such as when a brokerage or trading firm executes stock sales.
-
Self-regulatory organizations (SROs) technically pay these fees to the SEC. They are passed on to broker-dealers and ultimately to their customers or the company itself if it is executing trades as part of its operations.
-
Free cash flow aims to reflect all operating and transactional cash obligations that reduce available cash to equity holders, including recurring, transaction-specific outflows like Section 31 fees. Not deducting them would overstate a company’s true free cash flow, misrepresenting its financial capacity for dividends, reinvestment, or debt paydown.
The CAPEX figures below include capital expenditures and capitalized software development costs.
NOTE: Since the Q1 2026 data is solely for a 3 month period, it is unwise to compare that period’s FCF conversion ratios with those of prior fiscal years.
FY2026 Guidance
We can expect ICE to continue focus on balancing cost discipline with investments in future profitable growth. The following reflects ICE’s current FY2026 guidance.
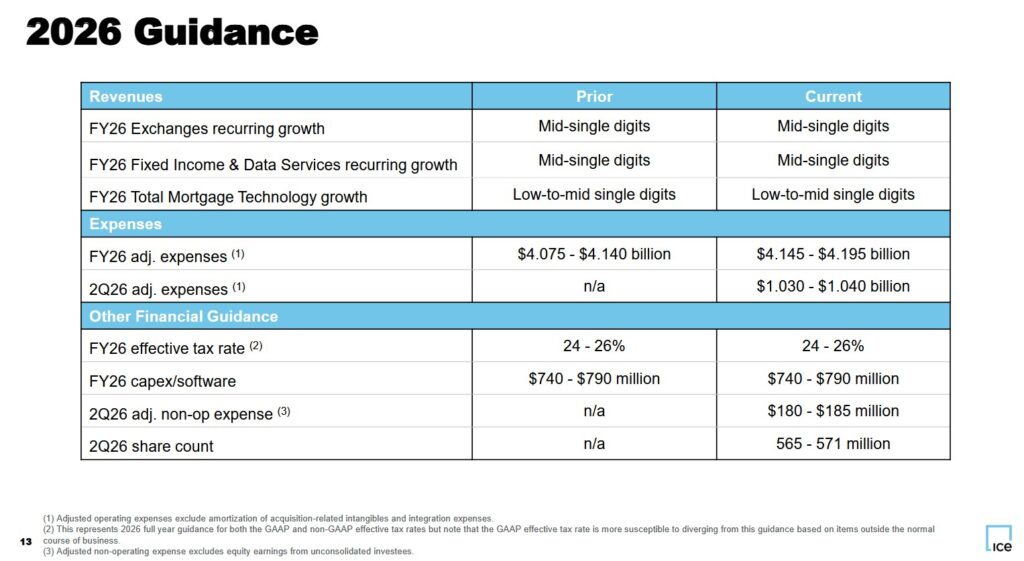
The following guidance was provided when ICE released its Q4 2025 results.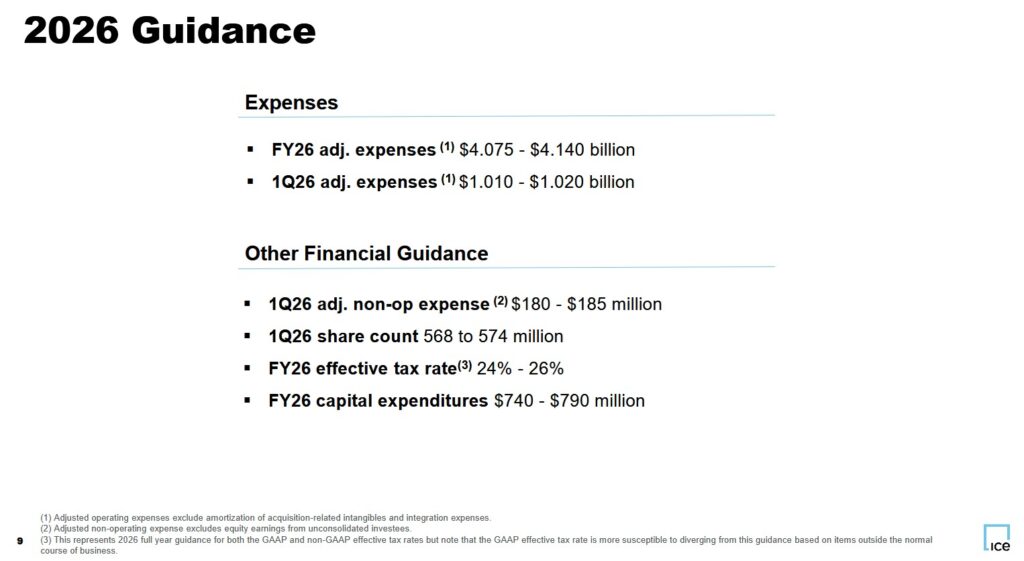
ROIC and WACC
Return on Invested Capital (ROIC) provides an indication of a company’s efficiency. In essence, is a company actually creating value or ‘burning’ cash for the sake of growth?
A company with a higher ROIC is mathematically worth more because it requires less reinvestment to achieve that growth.
A good indication of how well a company is performing is to compare ROIC to the Weighted Average Cost of Capital (WACC). WACC, however, is not a metric officially reported by ICE but it can be roughly estimated based on the company’s credit profile and market conditions.
The generally accepted high-level formula used by Wall Street is:
ROIC = NOPAT/Average Invested Capital
with the Net Operating Profit After Tax (NOPAT) formula being Operating Income (EBIT) x (1-tax rate)
This shows how much profit the core business makes while ignoring how much debt the company has.
The Average Invested Capital is the total money tied up in the business.
- The Operating Approach formula is
- The Financing Approach is
One shortcoming with ROIC is that it is a non-GAAP metric meaning the input data plugged into the ROIC formula is inconsistent.
ICE consistently maintains a positive ROIC spread, meaning it generates returns significantly higher than its cost of capital. In FY2024 and FY2025, for example, ICE’s adjusted ROIC was ~10.5% and ~11% while its WACC was ~8%.
Capital Allocation
ICE maintains a highly disciplined capital allocation framework. It typically focuses on:
- organic growth investment;
- dividend growth;
- deleveraging; and
- opportunistic share repurchases.
In recent years, it has transformed into a business that is less reliant on the transaction-heavy exchange segment to a high-margin, recurring data and software firm. Aggressive deleveraging has been a primary focus following the $11.9B Black Knight acquisition in order to return to its target leverage ratio of 3.0x – 3.25x.
The debt-to-adjusted EBITDA leverage ratio at the end of Q1 2026 is ~2.9x. This is a reduction from 4.3x upon the completion of the Black Knight acquisition in Q3 2023, and 4.1x, 3.3x, and 3x at FYE2023, FYE2024, and FY2025.
Risk Assessment
The following table reflects the fair value of ICE’s debt as of March 31, 2026 and December 31, 2025.
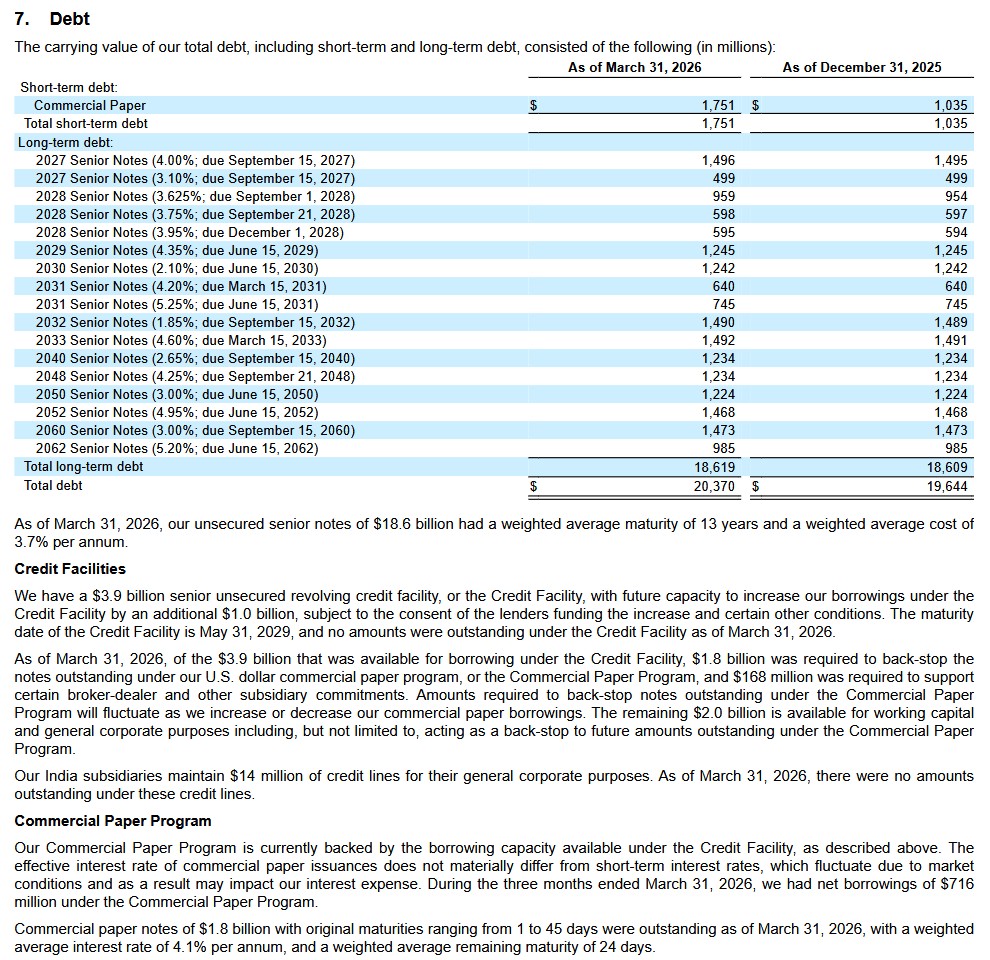
ICE’s current senior unsecured long-term debt credit ratings and outlook remain unchanged from my prior review.
- Moody’s: A3 (stable and affirmed on August 21, 2025)
- S&P Global: A- (stable and last reviewed on February 25, 2026)
Both ratings are at the bottom of the upper-medium grade investment-grade category. These ratings define ICE as having a strong capacity to meet its financial commitments. It is, however, somewhat more susceptible to the adverse effects of changes in circumstances and economic conditions than obligors in higher-rated categories.
ICE’s ratings are acceptable for my purposes.
Dividend and Dividend Yield
ICE does not maintain a dividend history on its website. Its dividend history is accessible here.
Dividend metrics should have little bearing on our investment decisions. The focus should be on total potential shareholder return.
In December 2025, ICE’s Board approved an aggregate of $3.0B for future share repurchases with no fixed expiration date that became effective January 1, 2026. This replaced the previous amount approved by the Board.
In Q1 2026, ICE repurchased a total of 3.5 million shares at a cost of~$0.551B, of which 1.3 million shares were purchased on the open market at a cost of $0.2B during mid-February when the market price of ICE’s shares further disconnected from the fundamentals of the business.
As of March 31, 2026, the remaining balance of Board approved funds for future repurchases was $2.5B.
Valuation
Although ICE does not provide adjusted diluted EPS guidance, we can use current broker estimates to gauge the forward adjusted diluted PE levels. The valuation levels reflected below use the May 1, 2026 $154.75 closing share price.
- FY2026 – 15 brokers – mean of $8.04 and low/high of $7.66 – $8.35. Using the mean estimate: ~19.2.
- FY2027 – 15 brokers – mean of $8.75 and low/high of $8.38 – $9.04. Using the mean estimate: ~17.7.
- FY2028 – 9 brokers – mean of $9.72 and low/high of $9.09 – $10.19. Using the mean estimate: ~15.9.
ICE’s FCF conversion ratio calculated using the modified method and adjusted diluted EPS is generally slightly lower than 100% (see table in the Conventional And Modified Free Cash Flow (FCF) Calculations (FY2019 – FY2025 and Q1 2026) section of this post). ICE’s valuation based on FCF should, therefore, be slightly inferior to the valuation levels reflected above.
In my February 15, 2026 post I reflected:
Using the current $152.28 share price and the current broker estimates, the forward adjusted diluted PE levels are:
- FY2026 – 13 brokers – mean of $7.63 and low/high of $7.44 – $7.92. Using the mean estimate: ~20.
- FY2027 – 12 brokers – mean of $8.53 and low/high of $7.87 – $9.08. Using the mean estimate: ~17.9.
- FY2028 – 7 brokers – mean of $9.38 and low/high of $8.51 – $10.17. Using the mean estimate: ~16.2.
In FY2025, ICE’s FCF/share was ~$7.282 and ~$6.868 calculated used the conventional and modified methods. Using the current share price, ICE’s valuation based on FY2025 FCF/share results is ~21 and ~22.2.
ICE’s FCF conversion ratio using modified FCF is often just less than 100% if we use non-GAAP EPS but often in excess of 100% if we use diluted EPS. FY2021 is the only year during the FY2019 – FY2025 time frame in which adjusted diluted EPS is less than GAAP EPS.
If we use a 96% FCF conversion ratio for FY2026 and $7.63 for the FY2026 adjusted diluted EPS, FCF is likely to be ~$7.32 ($7.63 * 96%). Using the current $152.28 share price, the adjusted P/FCF for FY2026 is ~20.8.
The Q1 2026 share count guidance is 568 – 574 million with a 571 million mid-point. The weighted average in FY2025 is 575 million shares for a 4 million variance. Repurchasing 4 million shares in Q1 at an average price of ~$155 amounts to ~$0.62B versus ~$1.294B in FY2025. Since ICE has reached it target leverage level, I envision additional share repurchases in Q2 – Q4 2026.
In my October 31, 2025 post I reflected:
On October 31, 2025, I acquired an additional 100 shares @ $145.245 in a ‘Core’ account in the FFJ Portfolio.
ICE does not provide adjusted diluted EPS guidance. Using my recent purchase price and current broker estimates the forward adjusted diluted PE levels are:
- FY2025 – 17 brokers – mean of $6.90 and low/high of $6.75 – $7.11. Using the mean estimate: ~21.05.
- FY2026 – 17 brokers – mean of $7.53 and low/high of $6.92 – $7.96. Using the mean estimate: ~19.3.
- FY2027 – 12 brokers – mean of $8.36 and low/high of $7.30 – $8.81. Using the mean estimate: ~17.4.
ICE has generated $5.517 and $5.224 of YTD2025 FCF/share. This is based on ~576 million diluted outstanding shares.
If ICE generates a comparable level of FCF in Q4 as in each of the first 3 quarters, we can expect another ~$1.84 and ~$1.74 thereby increasing the FY2025 FCF to ~$7.36 and ~$7 calculated on a conventional and modified basis. Divide my $145.245 purchase price by these FCF estimates and we get P/FCF of ~19.7 and ~20.8 (conventional and modified FCF calculation methods).
These FY2025 FCF estimates are ~107% (~$7.36/$6.90) and ~101% (~$7/$6.90) of the FY2025 mean adjusted diluted broker estimates. This appears reasonable considering FCF/share typically exceeds GAAP EPS by a wide margin.
With a wide variance in ICE’s FY2025 share count guidance (569 – 575 million), we could see better valuations than those calculated above. Much will depend on the extent to which ICE repurchases shares in Q4.
Final Thoughts
In the FFJ Portfolio I currently hold:
- 300 shares in a ‘Core’ account at an average cost of $122.6553; and
- 200 shares in a ‘Side’ account at an average cost of $126.9656.
I also hold more shares in a retirement account but do not disclose the details of these accounts.
In my 2025 Mid-Year Portfolio Review, ICE was my 25th largest holding. At the time of that review, shares were trading at ~$183.45.
At the time of my 2025 Year-End Investment Holdings Review, the share price was $161.96. ICE was my 27th largest holding.
The general sentiment suggests that while the stock faces weakness due to mortgage technology headwinds, the massive growth in the energy and derivatives segments is more than offsetting these concerns. This is leading many analysts to view the current price as a significant discount to its long-term intrinsic value.
Several firms which cover ICE have raised their targets following ICE’s recent earnings release due to surging energy trading volumes and better than expected margins. The consensus price target is now ~$199.33. I think a fair value is ~$175 – ~$180 suggesting ICE is ~15% undervalued with shares currently trading at $154.75.
I wish you much success on your journey to financial freedom!
Note: Thanks for reading this article. Please send any feedback, corrections, or questions to finfreejourney@gmail.com.
Disclosure: I am long ICE.
Disclaimer: I do not know your circumstances and am not providing individualized advice or recommendations. I encourage you not to make any investment decisions without conducting your research and due diligence. You should also consult your financial advisor about your specific situation.
I wrote this article myself and it expresses my own opinions. I am not receiving compensation for it and have no business relationship with any company whose stock is mentioned in this article.