![]()
I last reviewed Ecolab Inc. (ECL) in a February 24, 2022 guest post at Dividend Power. I subsequently sold:
- 96 shares on October 12, 2022 @ $141.6028
- 120 shares on January 4, 2024 @ $197.0267
This reduced my ECL exposure to a relatively insignificant level where it just ‘dropped off my radar’.
After neglecting ECL for a few years I am revisiting it following the release of its Q1 2026 earnings.
Business Overview
ECL’s operating segments share similar economic characteristics and future prospects, including the nature of the products and production processes, end-use markets, channels of distribution
and regulatory environment. They are aggregated into four reportable segments:
- Global Water
- Global Institutional & Specialty
- Global Pest Elimination; and
- Global Life Sciences.
It directly operates in ~100 countries outside of the US through wholly-owned subsidiaries or, in some cases, through a joint venture with a local partner. In certain countries, selected products are sold by ECL’s export operations to distributors, agents or licensees. The volume of these sales, however, is not significant in terms of overall revenues. In general, ECL’s businesses conducted outside the US are similar to those conducted in the US.
As of December 31, 2025 (FYE2025), ECL employed ~48,000 employees. The largest component of the workforce is more than 25,000 sales and service employees. The company’s innovation efforts are supported by ~3,000 research, development, engineering and digital experts. Approximately 43% of ECL’s employees are employed in North America, 21% in Europe, 12% in Latin America, 8% in Asia Pacific, 8% in India, Middle East and Africa, and 8% in Greater China.
Part 1 in the FY2025 10-K and the company’s website explain ECL’s business and risk factors.
Impending Acquisition of CoolIT Systems
On March 20, 2026, ECL entered into a definitive agreement to acquire CoolIT Systems, a high-growth, high-margin leader in liquid cooling technology for next-gen AI data centers. The purchase price is ~$4.75B in cash at the closing of the transaction, subject to customary adjustments. This represents 29x and 24x estimated next 12-month and 2027 adjusted EBITDA for CoolIT.
The Press Release and accompanying presentation provide more details.
Financial Results
Q1 FY2026
Material related to the April 28 Q1 2026 earnings release, including detail about each business segment’s performance in Q1 2026 relative to Q1 2025 is accessible here.
Operating Cash Flow (OCF), Free Cash Flow (FCF), and CAPEX (FY2019 – FY2025 and Q1 2026)
FCF is a non-GAAP metric, and therefore, its method of calculation is inconsistent. Historically, ECL deducts CAPEX from OCF to calculate its FCF. My preference is to also deduct share-based compensation (SBC) from a company’s OCF. An explanation for this is provided in prior posts.
The following reflects ECL’s FCF using the conventional and modified calculation methods.
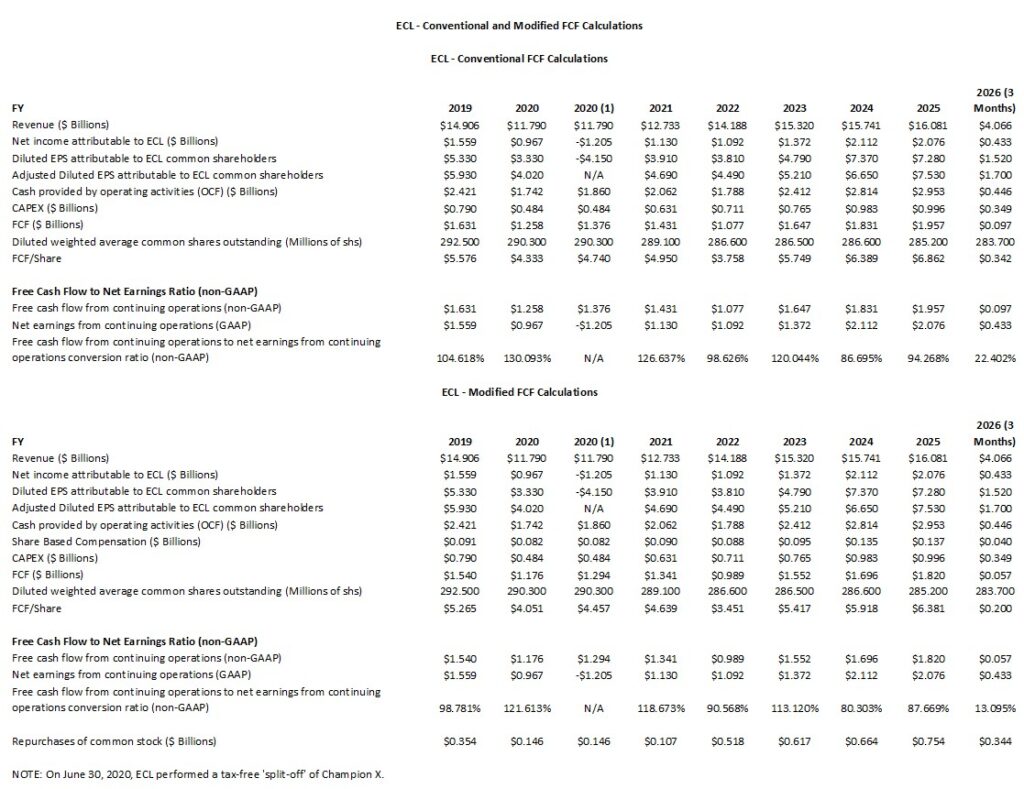
NOTE: The YTD2026 data is just for the first quarter. A direct comparison should not, therefore, be made between Q1 2026 FCF conversion ratios and those for prior fiscal years.
Unless we understand what occurred, it looks like ECL imploded in FY2020.
In the table reflected above, I reflect 2 columns for FY2020. One column reflects ECL’s results excluding the accounting entries related to the separation of ChampionX from the rest of the company on June 3, 2020. The other column includes all entries related to the separation.
Through a Reverse Morris Trust, ECL strategically bisected the Nalco Champion business. The Upstream business that went to ChampionX focused on drilling, completion, and energy production chemistry. The upstream activities are highly sensitive to oil price volatility and capital expenditure cycles. ECL retained the downstream chemistry business (refining and petrochemical processing) and integrated it into its Nalco Water brand. This business is more stable and aligned with Ecolab’s core focus on water and industrial hygiene.
The rationale for this transaction was to:
- Reduce Cyclicality: By offloading the upstream business, ECL significantly reduced its exposure to the boom-and-bust cycles of the oil and gas industry.
- Focus on Core Strengths: It allowed ECL to double down on its high-margin businesses in water, hygiene, and infection prevention.
- Deleverage: The deal included a $0.492B cash payment to ECL to help to strengthen the balance sheet during the early months of the COVID-19 pandemic. ChampionX funded this net cash payment to ECL through a new term loan facility.
This move effectively allowed ECL to turn a volatile segment into a specialized, scale-driven independent company while retaining the most profitable and stable parts of the original energy acquisition.
In separating the ChampionX business from the rest of ECL, however, ECL reported a one-time hit to its FY2020 reported earnings.
ECL’s FY2020 Form 10-K reported:
- ~$2.173B net loss from discontinued operations;
- ~$1.205B net loss income attributable to ECL;
- $3.33 diluted EPS (U.S. GAAP) from continuing operations;
- $7.48 diluted EPS loss (U.S. GAAP) from discontinued operations; and
- $4.15 diluted EPS loss (U.S. GAAP) attributable to ECL
The reported loss was primarily a non-cash accounting loss that had to be reported under GAAP rules. Because ECL effectively sold the business through a split-off, it had to compare the value it received (ChampionX shares and cash) against the book value of the disposed business.
The following are the 3 main factors for the loss:
- The net assets ECL transferred to ChampionX were valued at ~$3.49B. The fair value of the shares exchanged by shareholders plus the cash received by ECL, however, totaled ~$1.58B.
- ECL had to record a $0.23B write-off of Cumulative Translation Adjustments. This figure represented currency exchange gains/losses that had been sitting on the balance sheet for years related to the international energy business.
- Prior to the closing of the transaction, the energy sector was hit hard by the onset of COVID-19 and a crash in oil prices. This forced ECL to take ~$0.56B in goodwill and intangible asset impairment charges because the market value of the oilfield business had plummeted.
Capital Allocation
ECL’s disciplined capital allocation framework is designed to support its double-digit EPS growth commitment. Based on management’s 2025 Investor Day and the Q1 2026 earnings report, ECL’s capital allocation priorities are:
Organic Business Investment (High Priority)
ECL reinvests heavily in R&D, digital innovation, and capacity expansion to drive organic growth. In Q1 2026, for example, CAPEX rose to $348.5 million from $237.9 million in Q1 2025. The areas of focus are Industrial Water Purification and digital platforms like AquaIQ and Pest Intelligence.
Support and Grow the Dividend
ECL views its dividend as a core commitment to shareholders. In December 2025, ECL’s Board authorized a 12% increase in the quarterly dividend to $0.73 per share. Management treats the dividend as a priority after essential business reinvestment, aiming for a payout ratio that allows for both growth and reliability.
Strategic M&A (Bolt-on & Transformative)
ECL uses M&A to enter high-growth verticals or acquire specialized technology that can be scaled through its massive global sales force.
ECL has been aggressive in the High-Tech Water space. It acquired Ovivo Electronics for $1.6B in late 2025 and in March 2026, it announced its intent to acquire CoolIT Systems to lead in AI data center cooling. This acquisition is expected to close in Q3 2026.
The company targets acquisitions that are accretive to growth and margins within a few years, typically maintaining a Net Debt-to-EBITDA ratio of 2.0x to 2.5x.
Share Repurchases (Opportunistic)
Buybacks are generally used to offset dilution from stock-based compensation or to return excess cash when M&A opportunities are sparse. In Q1 2026, ECL repurchased ~1.3 million shares.
Share repurchases are more flexible than the dividend and ECL often dials back the repurchases if a large acquisition requires more immediate capital.
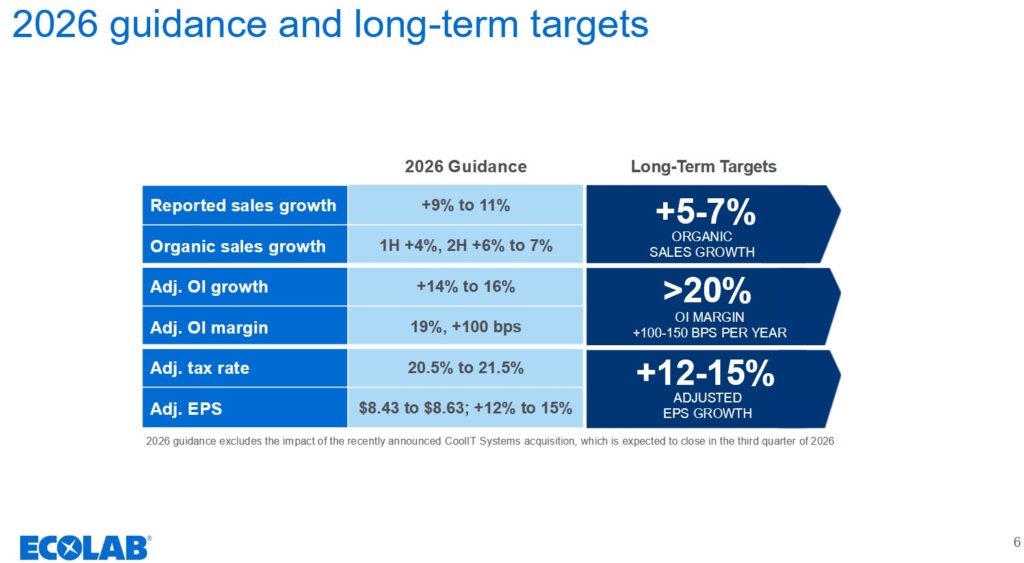
FY2026 Guidance
The following reflects ECL’s updated FY2026 guidance for the company as a whole and by division.
On the Q1 2026 earnings call, management states:
CoolIT financing and non-cash amortization are expected to have a short-term impact on adjusted EPS in second half of the year. Following the close, the impact is expected to reduce quarterly EPS by approximately $0.20. Importantly, underlying EPS growth remains unchanged. Beyond the short-term impact this year, we expect EPS growth, including CoolIT, to accelerate back into the 12%-15% range as contributions from this high-growth, high-margin acquisition accelerate and amortization from the Nalco acquisition falls off. What’s even better, the impact of our growth engines on Ecolab’s global performance is accelerating as we scale down. This is especially true for Global High-Tech, where AI is driving significant new demand for circular water management and high-performance cooling.
By bringing CoolIT and Ovivo together with our Global High-Tech water business, we’re building a one-and-a-half billion dollar powerhouse that will help fuel Ecolab’s next phase of growth and margin expansion.
Our pending acquisition of CoolIT builds on this momentum, adding a scaled direct to chip liquid cooling platform and positioning Global High-Tech with an integrated service-led cooling solution for high-density AI data centers. Here’s more good news. CoolIT has shared with us that they are off to a very strong start in uncertain, with 1st quarter sales growing well ahead of the 30%+ we discussed on the acquisition call as demand for their leading liquid cooling technologies continues to rapidly accelerate. Together, these two businesses have the potential to add a couple points of high-margin organic sales growth to Ecolab’s total growth as they scale and capture more of this huge and fast-growing high-tech market.
ROIC and WACC
Return on Invested Capital (ROIC) provides an indication of a company’s efficiency. In essence, is a company actually creating value or ‘burning’ cash for the sake of growth?
A company with a higher ROIC is mathematically worth more because it requires less reinvestment to achieve that growth.
A good indication of how well a company is performing is to compare ROIC to the Weighted Average Cost of Capital (WACC). WACC, however, is not a metric officially reported by ECL but it can be roughly estimated based on the company’s credit profile and market conditions.
The generally accepted high-level formula used by Wall Street is:
ROIC = NOPAT/Average Invested Capital
with the Net Operating Profit After Tax (NOPAT) formula being Operating Income (EBIT) x (1-tax rate)
This shows how much profit the core business makes while ignoring how much debt the company has.
The Average Invested Capital is the total money tied up in the business.
- The Operating Approach formula is
- The Financing Approach is
One shortcoming with ROIC is that it is a non-GAAP metric meaning the input data plugged into the ROIC formula is inconsistent.
ECL’s financial profile from 2019 through Q1 2026 reflects the impact of the pandemic and the ChampionX separation. ECL in recent years, however, has experienced a robust recovery driven by pricing power and expansion into high-growth sectors like Life Sciences and AI data center cooling.
In FY2020 – FY2022, the spread between ROIC and WACC narrowed significantly.
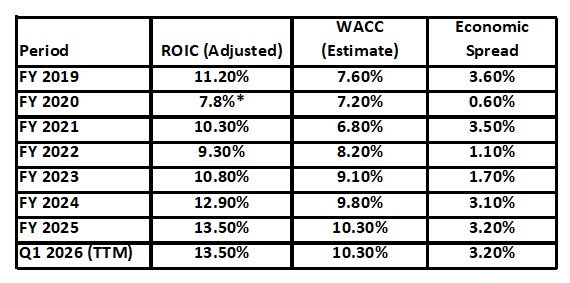
The separation of the capital-intensive Upstream Energy business initially lowered the invested capital base. However, the immediate pandemic-related volume declines in the Institutional segment suppressed NOPAT.
In 2022, ROIC dipped to 9.3% as raw material costs surged ~50%, temporarily outpacing ECL’s ability to implement value-based pricing.
In FY2023 – FY2025, ECL expanded its spread back above 3% as ECL transitioned to more aggressive value pricing,. This helped margins recover despite high commodity costs. Growth was led by the Life Sciences and Pest Elimination segments which carry higher returns on capital than the legacy industrial water business. ECL’s Net Debt-to-EBITDA also dropped from 3.4x in 2021 to 2.0x by the end of 2025.
The Q1 2026 earnings report shows ECL’s ROIC being ~13.5% while the WACC has stabilized around 10.3%. This WACC reflects the higher interest rate environment compared to the 2019 – 2021 period.
Management is currently targeting a 20% Operating Income Margin by 2027. If ECL can achieve this, ROIC could rise above 14%. This, however, will be dependent upon capital intensity remaining stable.
Risk Assessment
Moody’s continues to assign an A3 rating to ECL’s domestic senior unsecured debt. This rating was affirmed on March 25, 2026.
S&P Global continues to assign an A- domestic senior unsecured debt rating. This was last reviewed on August 20, 2025.
Fitch continues to assign an A- long-term issuer default rating. this was affirmed on March 25, 2026.
All 3 ratings are the lowest tier within the upper-medium investment-grade group of ratings.
This rating means ECL has a STRONG capacity to meet its financial commitments. It is, however, somewhat more susceptible to the adverse effects of changes in circumstances and economic conditions than obligors in higher-rated categories.
Dividend and Dividend Yield
On May 7, ECL declared a regular quarterly cash dividend of $0.73/share, to be paid July 15, 2026, to shareholders of record at the close of business on June 16, 2026.
Looking at ECL’s dividend history, this is the 3rd consecutive $0.73 quarterly dividend.
The dividend yield is typically around 1%.
ECL generates ample cash flow to service the quarterly dividend.
ECL has increased its consecutive annual cash dividend for 34 years and maintains an unbroken record of paying cash dividends for 89 consecutive years. Investors should not, however, fixate on dividend metrics. The potential TOTAL investment return is far more important.
Share Repurchases
In November 2022, ECL’s Board authorized the repurchase of up to 10,000,000 shares of its common stock. At the end of Q1 2026 (March 31, 2026), 4,643,448 shares remained to be repurchased under the repurchase authorization.
In Q1 2026, ECL reacquired 1,343,178 shares of its common stock, of which 1,253,373 related to share repurchases through open market and 89,805 related to shares withheld for taxes on the exercise of stock options and the vesting of stock awards and units.
In Q1 2026, the diluted weighted-average common shares outstanding were 283.7 million versus 292.5 million in FY2019.
Valuation
On April 29 I acquired 100 additional shares in a ‘Core’ account in the FFJ Portfolio @ $256.845. Using this purchase price and ECL’s $8.43 – $8.63 FY2026 adjusted diluted EPS outlook, the forward adjusted diluted PE range is ~29.8 – ~30.5.
The forward-adjusted diluted PE levels using the current share price and broker estimates are:
- FY2026 – 21 brokers – ~30.7 using a mean of $8.37 and low/high of $8.03 – $8.55.
- FY2027 – 21 brokers – ~26.8 using a mean of $9.59 and low/high of $9.06 – $10.00.
- FY2028 – 11 brokers – ~23.8 using a mean of $10.78 and low/high of $10.20 – $11.08.
NOTE: Revisions to these estimates are likely over the next few days.
ECL’s adjusted diluted EPS is generally (FY2024 is an exception) greater than its diluted EPS (see table in the Operating Cash Flow (OCF), Free Cash Flow (FCF), and CAPEX (FY2019 – FY2025 and Q1 2026) section of this post).
At the end of Q1 2026, adjusted diluted EPS exceeds diluted EPS by ~$0.18. If the variance in each of the next 3 quarters is ~$0.20, the adjusted diluted EPS could be ~$0.78 greater than diluted EPS.
Using the $8.53 mid-point of management’s $8.43 – $8.63 FY2026 adjusted diluted EPS outlook, it is likely that FY2026 diluted EPS will be ~$7.75 ($8.53 – $0.78). If ECL’s modified FCF conversion ratio ends up being ~88%, ECL’s FY2026 FCF is likely to be ~$6.82. Using my $256.845 purchase price, the modified P/FCF is ~37.7.
Final Thoughts
On April 29, I acquired 100 shares @ $256.84 in a ‘Core’ account in the FFJ Portfolio.
The recent weakness in the company’s share price is likely because of concern that inflation in raw material costs stemming from higher energy costs resulting from the US-Iran conflict will likely affect ECL’s profitability. Management indicates price increases (albeit with some lag) will enable the company to pass along any raw materials and energy cost inflation.
Approximately 80% of ECL’s sales across all segments come from its installed base and consumables model where the switching costs are high. The remaining 20% of sales come from services, including pest control, regulatory and supply chain consulting, and manufacturing plant monitoring.
ECL is a ‘high-quality compounder’ with recurring revenue which explains why it historically trades at a premium to fair value. In my opinion, it warrants a ‘wide moat’ and with the share price below what I perceive to be a fair value range (~$280 – ~$290), I acquired 100 shares @ $256.84 on April 29.
I wish you much success on your journey to financial freedom!
Note: Please send any feedback, corrections, or questions to finfreejourney@gmail.com.
Disclosure: I am long ECL.
Disclaimer: I do not know your circumstances and do not provide individualized advice or recommendations. I encourage you to make investment decisions by conducting your research and due diligence. Consult your financial advisor about your specific situation.
I wrote this article myself and it expresses my own opinions. I do not receive compensation for it and have no business relationship with any company mentioned in this article.